Equity funds absorbed $55.6B in a single week, a figure that would normally read as a market brimming with confidence. Yet the strategist most closely watched for sentiment signals told clients on the same day to stay “tactically risk-off.” If you read that inflow as a green light, the defensive view suggests you may be reading it backwards.
Michael Hartnett‘s team at Bank of America anticipates further declines in equities, Treasury yields and the dollar before any bottom takes shape. This is a timed, conditional call running to mid-November, not a permanent bearish verdict.
One caveat shapes everything below. The primary BofA note was not publicly accessible, so the figures come from secondary reporting, chiefly Investing.com on 23 October 2026, and some of those figures conflict.
Here is how a major strategy desk links politics, AI credit risk and fund flows to market timing, and how you can test the call yourself.
What has to happen before the risk-off phase ends?
The targets are specific. BofA sees the 30-year Treasury yield pushing toward 5% and the Dollar Index (a measure of the dollar against a basket of major currencies) falling below 100, with real yields, meaning yields after inflation, near 3%.
Those targets do not end the phase on their own. Three separate mechanisms have to resolve, and each runs through a different part of the financial system.
Rising bond yields hit equities through three channels at once: higher discount rates, greater opportunity cost against risk-free returns, and higher corporate financing costs, which is why the yield targets matter so much here.
The political channel matters because, according to the original source, a Democratic sweep would bring an end to the low-tax, light-regulation environment and reduce Trump’s capacity to direct capital into the US-China AI race. Hartnett’s condition is that the sweep becomes fully priced, not simply that Democrats win. Uncertainty, rather than the result, is what keeps markets defensive.
The AI-credit channel is the most mechanical. Hyperscalers, the largest cloud and AI spenders, fund much of their build-out with debt, and BofA flags spreads above 200 bp (basis points, where 100 bp equals one percentage point) as the level that could force deleveraging.
| Channel | Trigger | Exit condition | Key data point |
|---|---|---|---|
| Political | Midterm repricing of tax and regulation | Democratic sweep fully priced | Polymarket sweep odds 68-69% |
| French bonds | Disorderly rise in French yields | ECB and French government halt the selloff | 10-year OAT yields up 150 bp since the Hormuz crisis (Allianz) |
| AI credit | Hyperscaler spreads widening | AI capex cut or very large equity issuance marks a spread peak | Hyperscaler IG spreads +25 bp vs +4 bp for broader IG |
| Oil and peace deals | Russia, Ukraine or Iran deals | Upside catalyst rather than a requirement | Oil lower by $10-$20 per barrel |
The stress is already visible. CoreWeave‘s five-year credit default swap, the cost of insuring its debt, jumped from 368 bp on 6 October to above 1,140 bp by 15 October.
The conflicting figures and what they mean
The original source put BofA’s Bull & Bear Indicator at 7.4, down from 8.1, while later research cites 7.2 from 7.4. Either way it reads as neutral, and Hartnett stressed that ending a sell signal is not a buy signal. Sweep odds also vary, with an earlier Newsquawk reading at 65%.
What this tells you is that “mid-November” matters less than the trip-wires. You can monitor all three yourself.
When big ASX news breaks, our subscribers know first
How do the three 2027 scenarios change the picture?
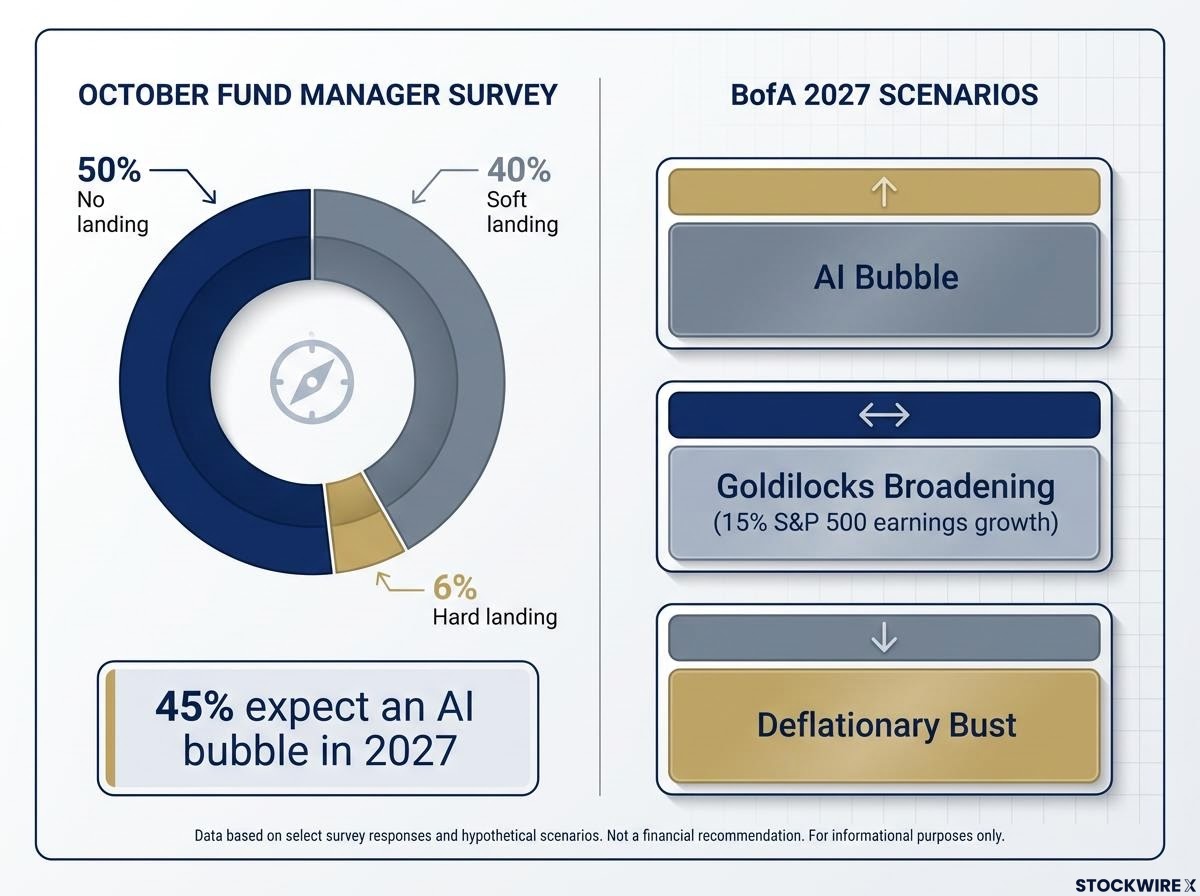
BofA sketches three 2027 outcomes, and investors are most comfortable with the first two.
The AI bubble case depends on AI mirroring the railroads of the 1800s and on a government backstop without precedent in the US. The Goldilocks broadening case relies on consensus expectations of a 40 bp fall in Treasury yields and 15% S&P 500 earnings growth. Consensus 2027 forecasts also assume 5% US nominal GDP growth and 43% global tech earnings growth, and BofA expects both to be revised down.
The third case is the one BofA thinks the market is underpricing: a deflationary bust, where credit tightening forces hyperscalers to cut capex.
| Scenario | What it relies on | What it implies |
|---|---|---|
| AI bubble | Railroad-style mania plus a government backstop | Valuations stretch further before any reckoning |
| Goldilocks broadening | Lower yields and 15% earnings growth | Gains spread beyond tech |
| Deflationary bust | Credit tightening forcing capex cuts | Hard landing that consensus largely ignores |
The October fund manager survey shows the skew: 50% expect no landing, 40% a soft landing and only 6% a hard landing, even as 45% expect an AI bubble in 2027.
The railroad analogy cuts both ways. Those booms built national networks, but they ended in excess capacity and collapsing freight rates.
Railroad precedent: Railroads suffered three 30%-50% drawdowns during their boom, with investment near 5% of US GDP at the first boom’s peak.
Why the capex figure is large but not conclusive
Investing.com reports BofA’s 2027 hyperscaler capex estimate at about $1.2 trillion. UBS puts it at $1.3 trillion, while Futunn cites $1.16 trillion after $807 billion in 2026. Hartnett’s comparison places this below the railroad peak as a share of GDP, and AI may monetise faster with more durable cash flows.
For you, the point is that consensus 2027 numbers already assume the benign outcomes. Any disappointment must be absorbed by prices that embed them.
Do fund flows and positioning back the strategists’ view?
At first glance, the flows contradict the defensive call. In the week to 21 October, equities took in $55.6B, with emerging markets drawing $33.5B for a fourth straight week.
Look at the composition and the contradiction resolves into narrowness.
| Asset or sector | Weekly flow | Context |
|---|---|---|
| Equities | +$55.6B | Headline inflow |
| Money market | +$28.8B | Defensive cash allocation |
| EM equities | +$33.5B | Fourth straight week |
| China | +$17B | Largest since July |
| Tech | +$18.8B | Largest since July |
| US equities | +$6.7B | Third week of inflows |
| Europe | -$1B | Second week of outflows |
| Consumer | -$2.1B | Largest since Feb 2014, second largest on record |
| Utilities | -$1.6B | Largest since Mar 2015, second largest on record |
| Energy | +$1.1B | Largest since April |
Money is piling into tech and Asia while near-record sums leave consumer and utility funds. Bonds drew $12.1B, gold $2.6B and crypto $0.2B.
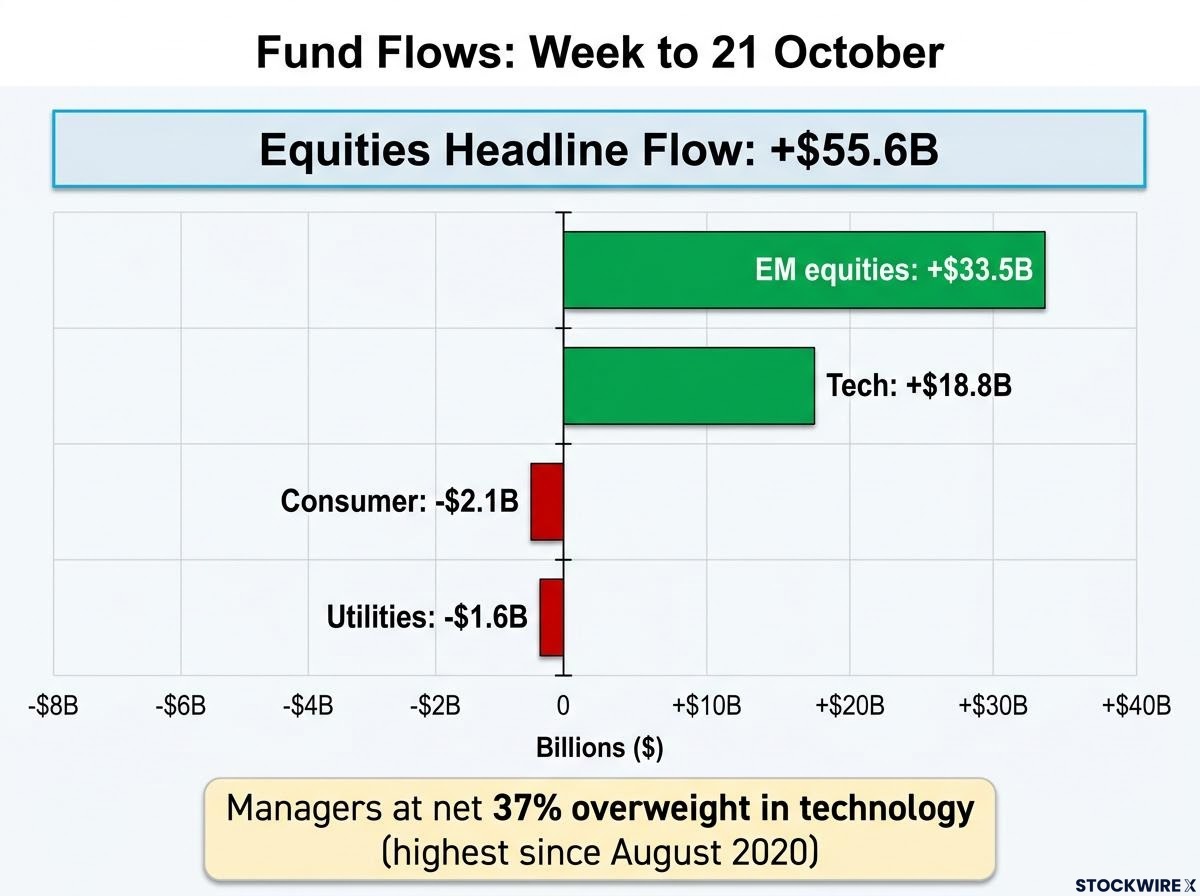
Positioning sharpens the picture. Fund managers sit at a net 37% overweight in technology, the highest since August 2020, which is precisely the crowding Hartnett’s contrarian view targets.
That tech overweight built on record semiconductor crowding earlier in 2026, when a record share of managers named long semiconductors the most crowded trade in the survey’s history.
Fixed income tells the quieter defensive story:
- Treasuries: +$5.4B, a 17th straight week of inflows
- High yield: -$0.5B, a fourth week of outflows
What this tells you is that strong headline inflows can coexist with fragile positioning. Read flows by composition, not total, and note that BofA treats abandoned sectors as raw material for its later rotation.
What is “peak yield” accumulation, and where could the call be wrong?
“Peak yield” accumulation means buying sectors that suffer when borrowing costs rise, on the view that yields and the dollar are near a top. BofA names small caps, REITs (listed property trusts), utilities and consumer discretionary.
The timing logic leans on capitulation, the point where investors give up and sell regardless of price. Near-record outflows from utility and discretionary funds fit that description.
How the rotation is supposed to work
The sequence runs in order: the dollar peaks, yields retreat, credit stress stabilises, and money rotates from crowded tech into the abandoned sectors. That is a mechanism, not evidence that any rebound had begun by 23 October 2026.
Where the call could be wrong
The same trade can fail, and the fork is why yields fall.
- Falling yields help these sectors only if easing inflation drives them, not collapsing growth.
- The sectors are sensitive to refinancing costs, employment and domestic demand, which leaves them exposed in a bust.
- With the Bull & Bear Indicator off its extreme, the case for immediate capitulation is weaker.
- Crowded tech can stay crowded if earnings keep growing, and UBS’s $1.3 trillion capex projection points that way.
- Hartnett’s reputation for timing rests on media characterisation, and no audited hit rate was located.
No named major strategist was found explicitly repudiating the call. Dissent is more nuanced: TwentyFour AM sounds more reassuring on French banks with the 10-year OAT near 4.99%, and Garth Friesen flags AI-credit vulnerability without making an equity forecast.
The distinction that matters: This is a tactical risk-off call into mid-November, built on the expectation that falling yields and stabilising credit create the next opportunity. It is not a forecast of an enduring equity collapse.
The takeaway for you is that the strategy depends on the reason yields fall. The same headline move could reward or punish these sectors.
These statements are speculative and subject to change based on market developments. Past performance does not guarantee future results.
Reading a tactical call: what to watch before mid-November
The Bank of America defensive call is tactical, conditional and built on observable triggers. Political, AI-credit and French-bond channels set the timing, the 2027 scenarios set the stakes, and flows show how crowded the trade has become.
Hartnett has used this structure before, issuing a conditional risk-off directive in August that named specific catalysts, with the 10-year yield and the dollar as leading indicators.
Rather than watching the calendar, track four variables:
- Hyperscaler spreads relative to the 200 bp threshold
- French 10-year yields and any ECB response
- How fully midterm odds are priced into markets
- Whether consumer and utility outflows reverse
If those move together, the rotation thesis gains weight. If yields fall alongside weakening growth, it loses it.
Because the primary note was not publicly available, check these figures against BofA’s own research where you can.
This article is for informational purposes only and should not be considered financial advice. Investors should conduct their own research and consult with financial professionals before making investment decisions.