The Australian dollar edged higher on Friday 23 October, with AUD/USD trading near 0.7035, up about 0.20%, even as US flash purchasing managers’ index (PMI) readings showed American businesses running hot. On the surface, strong US data should have lifted the US dollar. Instead, the Aussie climbed.
Two decisions next week could quickly reset that balance. The US Federal Reserve announces its rate decision on Wednesday 28 October, the same day Australia’s September-quarter consumer price index (CPI) is released.
That puts the pair in a narrow window where rate expectations, not growth headlines, are setting the price. Here is why markets are favouring the policy outlook over activity data, which chart levels matter on the hourly screen, and which events could confirm or break the current move.
Why is the Australian dollar rising when US data is strong?
The answer lies in where interest rates are expected to go, not in which economy looks stronger today. According to TradingKey and FXStreet analyst Ghiles Guezout, the Aussie’s gain was driven mainly by renewed expectations that the Reserve Bank of Australia (RBA) will tighten again.
The RBA has already moved. On 29 September it unanimously raised the cash rate by 25 basis points (bp) to 4.60%, citing higher fuel prices and stubborn inflation. Headline CPI hit 4.0% in August, while the trimmed mean, a measure that strips out the most extreme price moves, sat at 3.6%. Minutes released on 13 October said inflation remained too high.
The Fed sits at 3.75%-4.00% and is expected to hold, with odds ranging from roughly 72% to 87%. Chair Kevin Warsh has declined to pre-commit, which has limited any hawkish lift for the dollar, even though CME FedWatch data via TradingKey prices about an 80% chance of a December hike.
| Measure | RBA | Fed |
|---|---|---|
| Policy rate | 4.60% | 3.75%-4.00% |
| Latest signal | August CPI 4.0%, trimmed mean 3.6% | December hike priced near 80% |
| Next decision | November | 28 October |
| Market expectation | November hike odds about 22%-56% (sources differ) | Hold, about 72%-87% |
November RBA pricing is inconsistent across reports. Some Australian coverage puts it near 22%-27%, while ABC, citing Bloomberg, and CommBank place it closer to 51%-56%. CommBank economists call the next decision “live”, though their baseline remains no change.
The takeaway for you is that currencies tend to follow expected rate gaps between countries. A strong economy alone does not guarantee a stronger currency.
Currencies tend to follow expected rate gaps between countries, and central bank divergence has repeatedly proved the dominant driver when two policy paths separate, because markets reprice the entire future rate path rather than any single decision.
How oil feeds both central banks
Higher fuel costs push Australian inflation up directly, and the RBA explicitly cited oil-supply disruptions when it hiked. That strengthens the case for another move.
The same shock can lift US inflation too, which may eventually support Fed tightening. That two-way channel is what caps the Aussie’s upside.
What the October PMI readings did and did not change
The US numbers were genuinely strong. A PMI above 50 signals expansion, and every reading cleared that line comfortably.
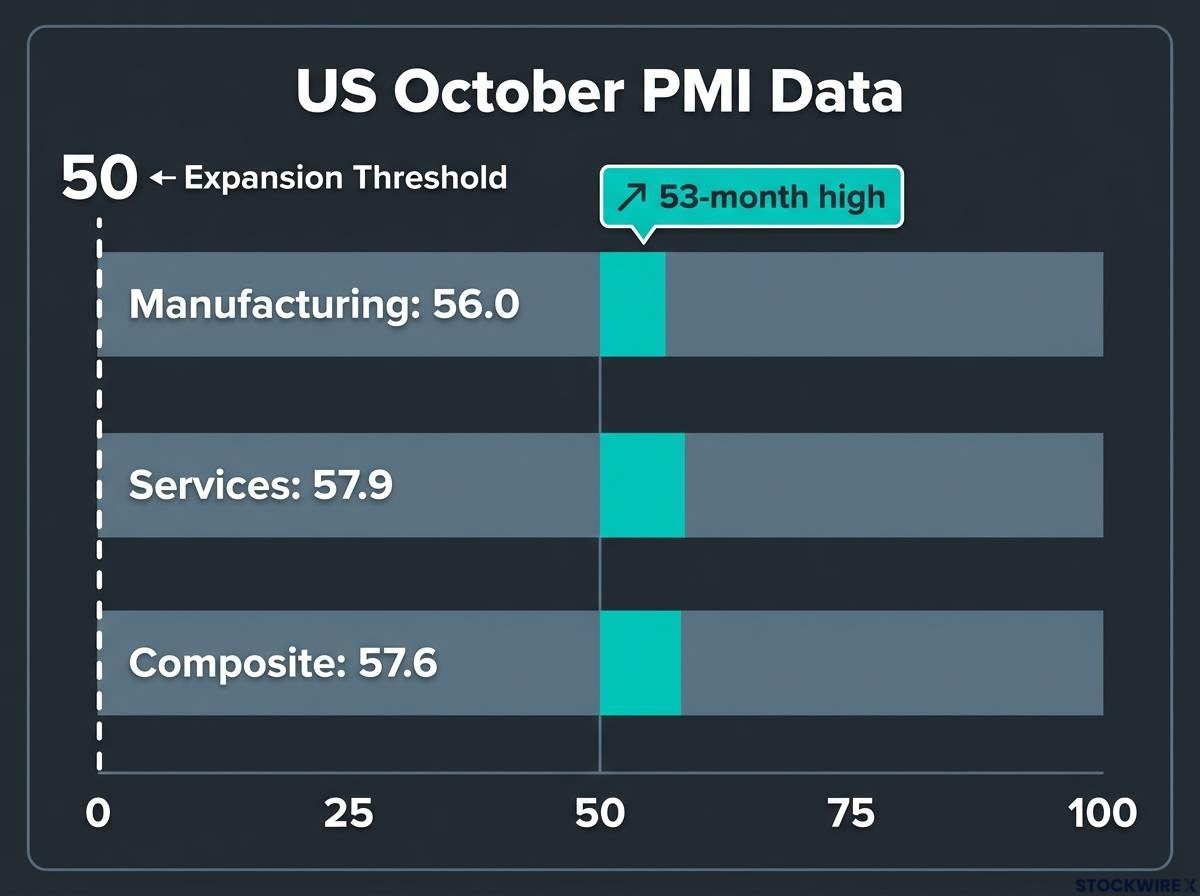
| Measure | October | Forecast | September |
|---|---|---|---|
| Manufacturing | 56.0 | 55.6 (55.5 per InvestingLive) | 55.9 |
| Services | 57.9 | 58.0 | 58.8 |
| Composite | 57.6 | Not available | 58.4 |
Manufacturing reached a 53-month high. Reuters reported strong demand and intensifying price pressures, with oil adding to business costs.
Then look closer. Services and the composite both eased from September, and services landed a touch below forecast, although sources disagree on whether that counts as a miss or in line. Strong but slightly softer, and largely expected, reads as confirmation rather than surprise.
Flash PMI releases are preliminary and subject to revision, which is one reason a single strong or soft print rarely changes a central bank’s near-term path on its own.
With no fresh hawkish signal expected from Warsh this week, the data did not shift the Fed’s near-term path. The same logic has worked in both directions this month:
- 14 October: hotter US inflation lifted the dollar and pushed AUD/USD lower as Fed hike bets rose.
- Around 15 October: weaker Australian jobs data cut RBA hike expectations, sending the Aussie to its lowest since early July.
- 21-23 October: hawkish RBA commentary drove a recovery above 0.7000 to about 0.7035.
Before assuming a data point will move a currency, check what it does to the policy path. That is the mechanism that actually moves the price.
The hourly chart: key AUD/USD levels and the events that could move them
On FXStreet’s AI-assisted one-hour chart, price sits around 0.7034, above both the 100-period simple moving average (SMA) at 0.7009 and the 200-period SMA at 0.6985. An SMA is the average closing price over a set number of periods. The relative strength index (RSI), a momentum gauge running from 0 to 100, reads near 63, suggesting a mild bullish bias without overbought conditions.
UOB strategists Quek Ser Leang and Lee Sue Ann disagree, describing the pair as potentially overbought near 0.7036. The two readings conflict, which is itself a signal of caution.
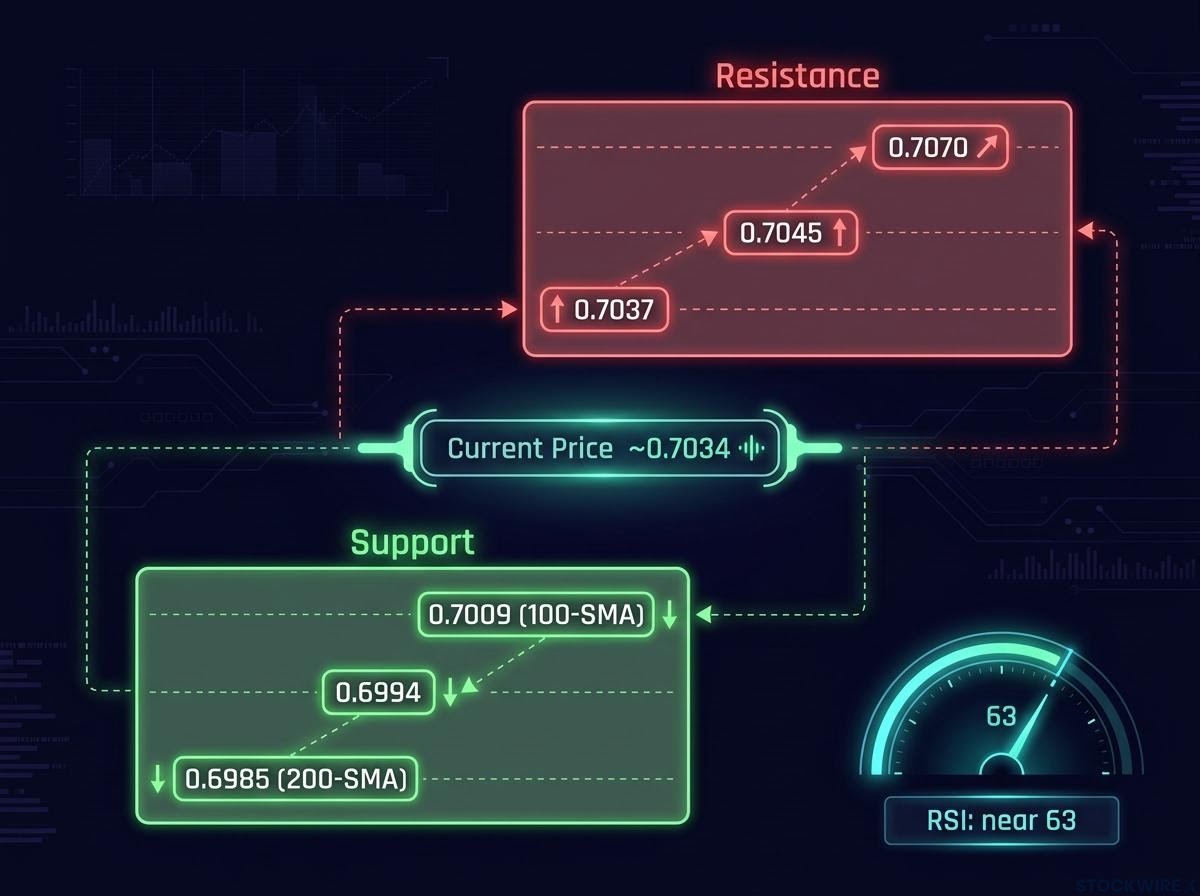
| Type | Level | Source |
|---|---|---|
| Resistance | 0.7045-0.7070 | UOB |
| Resistance | 0.7037, 0.7045 | FXStreet hourly chart |
| Support | 0.7009 | 100-period SMA |
| Support | 0.6994 | FXStreet hourly chart |
| Support | 0.6985 | 200-period SMA |
With resistance this close, the current price is a decision zone. Scheduled events, not the PMI, are what could resolve it.
Trimmed mean inflation is the gauge the RBA watches most closely, so a softer reading in the 28 October release could trim November hike pricing faster than the headline number alone.
- 28 October, Australian CPI: a softer print could quickly trim November hike pricing.
- 28 October, Fed decision: no updated projections accompany this meeting.
- Ongoing: oil, Chinese data and risk sentiment.
Why Warsh matters this week Without fresh economic projections, Warsh’s press-conference remarks may carry the Fed’s main guidance for rates and the dollar.
IC Markets said better Chinese data could support the Aussie, while Middle East tensions and China’s fuel export suspension could lift volatility. An oil reversal would weaken the RBA case, and because the Aussie is a high-beta currency that tends to amplify swings in risk appetite, a risk-off move can override rate differentials entirely. Rate-differential analysis does not guarantee direction and is not a trading signal.
What the divergence trade does and does not tell you
The Aussie’s rise is a relative repricing. Australian inflation and oil risks have lifted RBA hike odds, while the Fed is expected to pause and Warsh remains non-committal. Strong US PMI data supports the American economy, but it has not outweighed the near-term rate advantage.
The next tests arrive together on 28 October: Australian CPI, then the Fed decision and Warsh’s press conference. All probabilities quoted here remain subject to revision until those announcements land.
If CPI disappoints or Warsh turns hawkish, the case for the current level weakens quickly. Watch the policy path first and the chart second.
For readers wanting to see rate gaps in action elsewhere, our full explainer on the Fed and ECB rate gap shows how a 125-basis-point spread drives EUR/USD.
This article is for informational purposes only and should not be considered financial advice. Investors should conduct their own research and consult with financial professionals before making investment decisions. Past performance does not guarantee future results. Market pricing and forecasts are subject to change based on economic developments.