
Most investors treat election season as a signal to hunker down. They trim risk, raise cash, and wait for the political smoke to clear before committing capital again.
The historical record suggests that instinct is usually backwards. Some of the market’s most reliable gains have arrived in the months surrounding midterm elections, precisely when nervous investors are heading for the exits.
As of late September 2026, prediction markets have already priced in specific outcomes for November’s vote, which makes right now the moment to map your strategy rather than the aftermath. This piece gives you a clear framework for evaluating how the four possible combinations of congressional control will shape sector regulation, fiscal policy, and asset pricing. Building a coherent midterm elections investment strategy starts with understanding the pattern, the probabilities, and the powerful macro forces that can override both.
How the post election relief rally actually works
Here is the statistic that reframes the entire conversation. According to UBS strategists, the S&P 500 has gained an average of 14.5% from the end of August through the end of March in midterm election years since 1950, with a median return of 16.4%.
The UBS midterm signal Since 1950, the S&P 500 has averaged a 14.5% gain from late August through the end of March in midterm election years, with a median return of 16.4%.
That pattern is remarkably durable, and the reason has less to do with which party wins than with what the vote resolves.
Markets hate uncertainty more than they hate bad news. In the run-up to a midterm, investors face an open question about the direction of tax, spending, and regulatory policy, and they demand a higher risk premium to hold equities while that question hangs unanswered. Once the results are in, that premium compresses regardless of the outcome, and prices tend to recover.
What this tells you is that the political anxiety weighing on markets in September and October is usually fully priced in by the time you vote. The turbulence you feel now is closer to a seasonal feature than a structural warning to abandon your positions.
The hidden mechanisms behind the rally
Two forces do most of the work. The first is the resolution of political uncertainty itself; the moment near-term policy unknowns are settled, the risk premium eases and buyers return.
The second is timing. Midterm years frequently land at a point in the business cycle where earlier interest rate tightening or a market drawdown has already run its course, leaving valuations more attractive. The rebound gets credited to the election, but a good deal of it is macro-driven.
There is a wrinkle that complicates the simple “buy the midterm” story. Research from the American Economic Association paper “Divided Government and the Stock Market” found that value-weighted excess stock returns averaged roughly 10.3% per year under unified governments versus only 1.6% under divided governments across a 94-year sample.
That gap points in the opposite direction of the popular belief that markets prefer gridlock, and it is your first clue that the relationship between congressional control and returns is messier than any single rule of thumb.
When big ASX news breaks, our subscribers know first
Where the prediction markets point for November 2026
Set the partisan noise aside and look at what traders are actually betting. Prediction markets, where participants buy and sell contracts tied to real-world outcomes, offer a cold read on expectations that opinion polls often blur.
The consensus for November leans heavily one way on the House and far more tentatively on the Senate. The Wall Street Journal reported a roughly 62% probability of a Democratic House victory based on late September contract pricing, while platform data from Polymarket and Kalshi summarised across late September showed considerably higher House odds ranging from 85% to 93%.
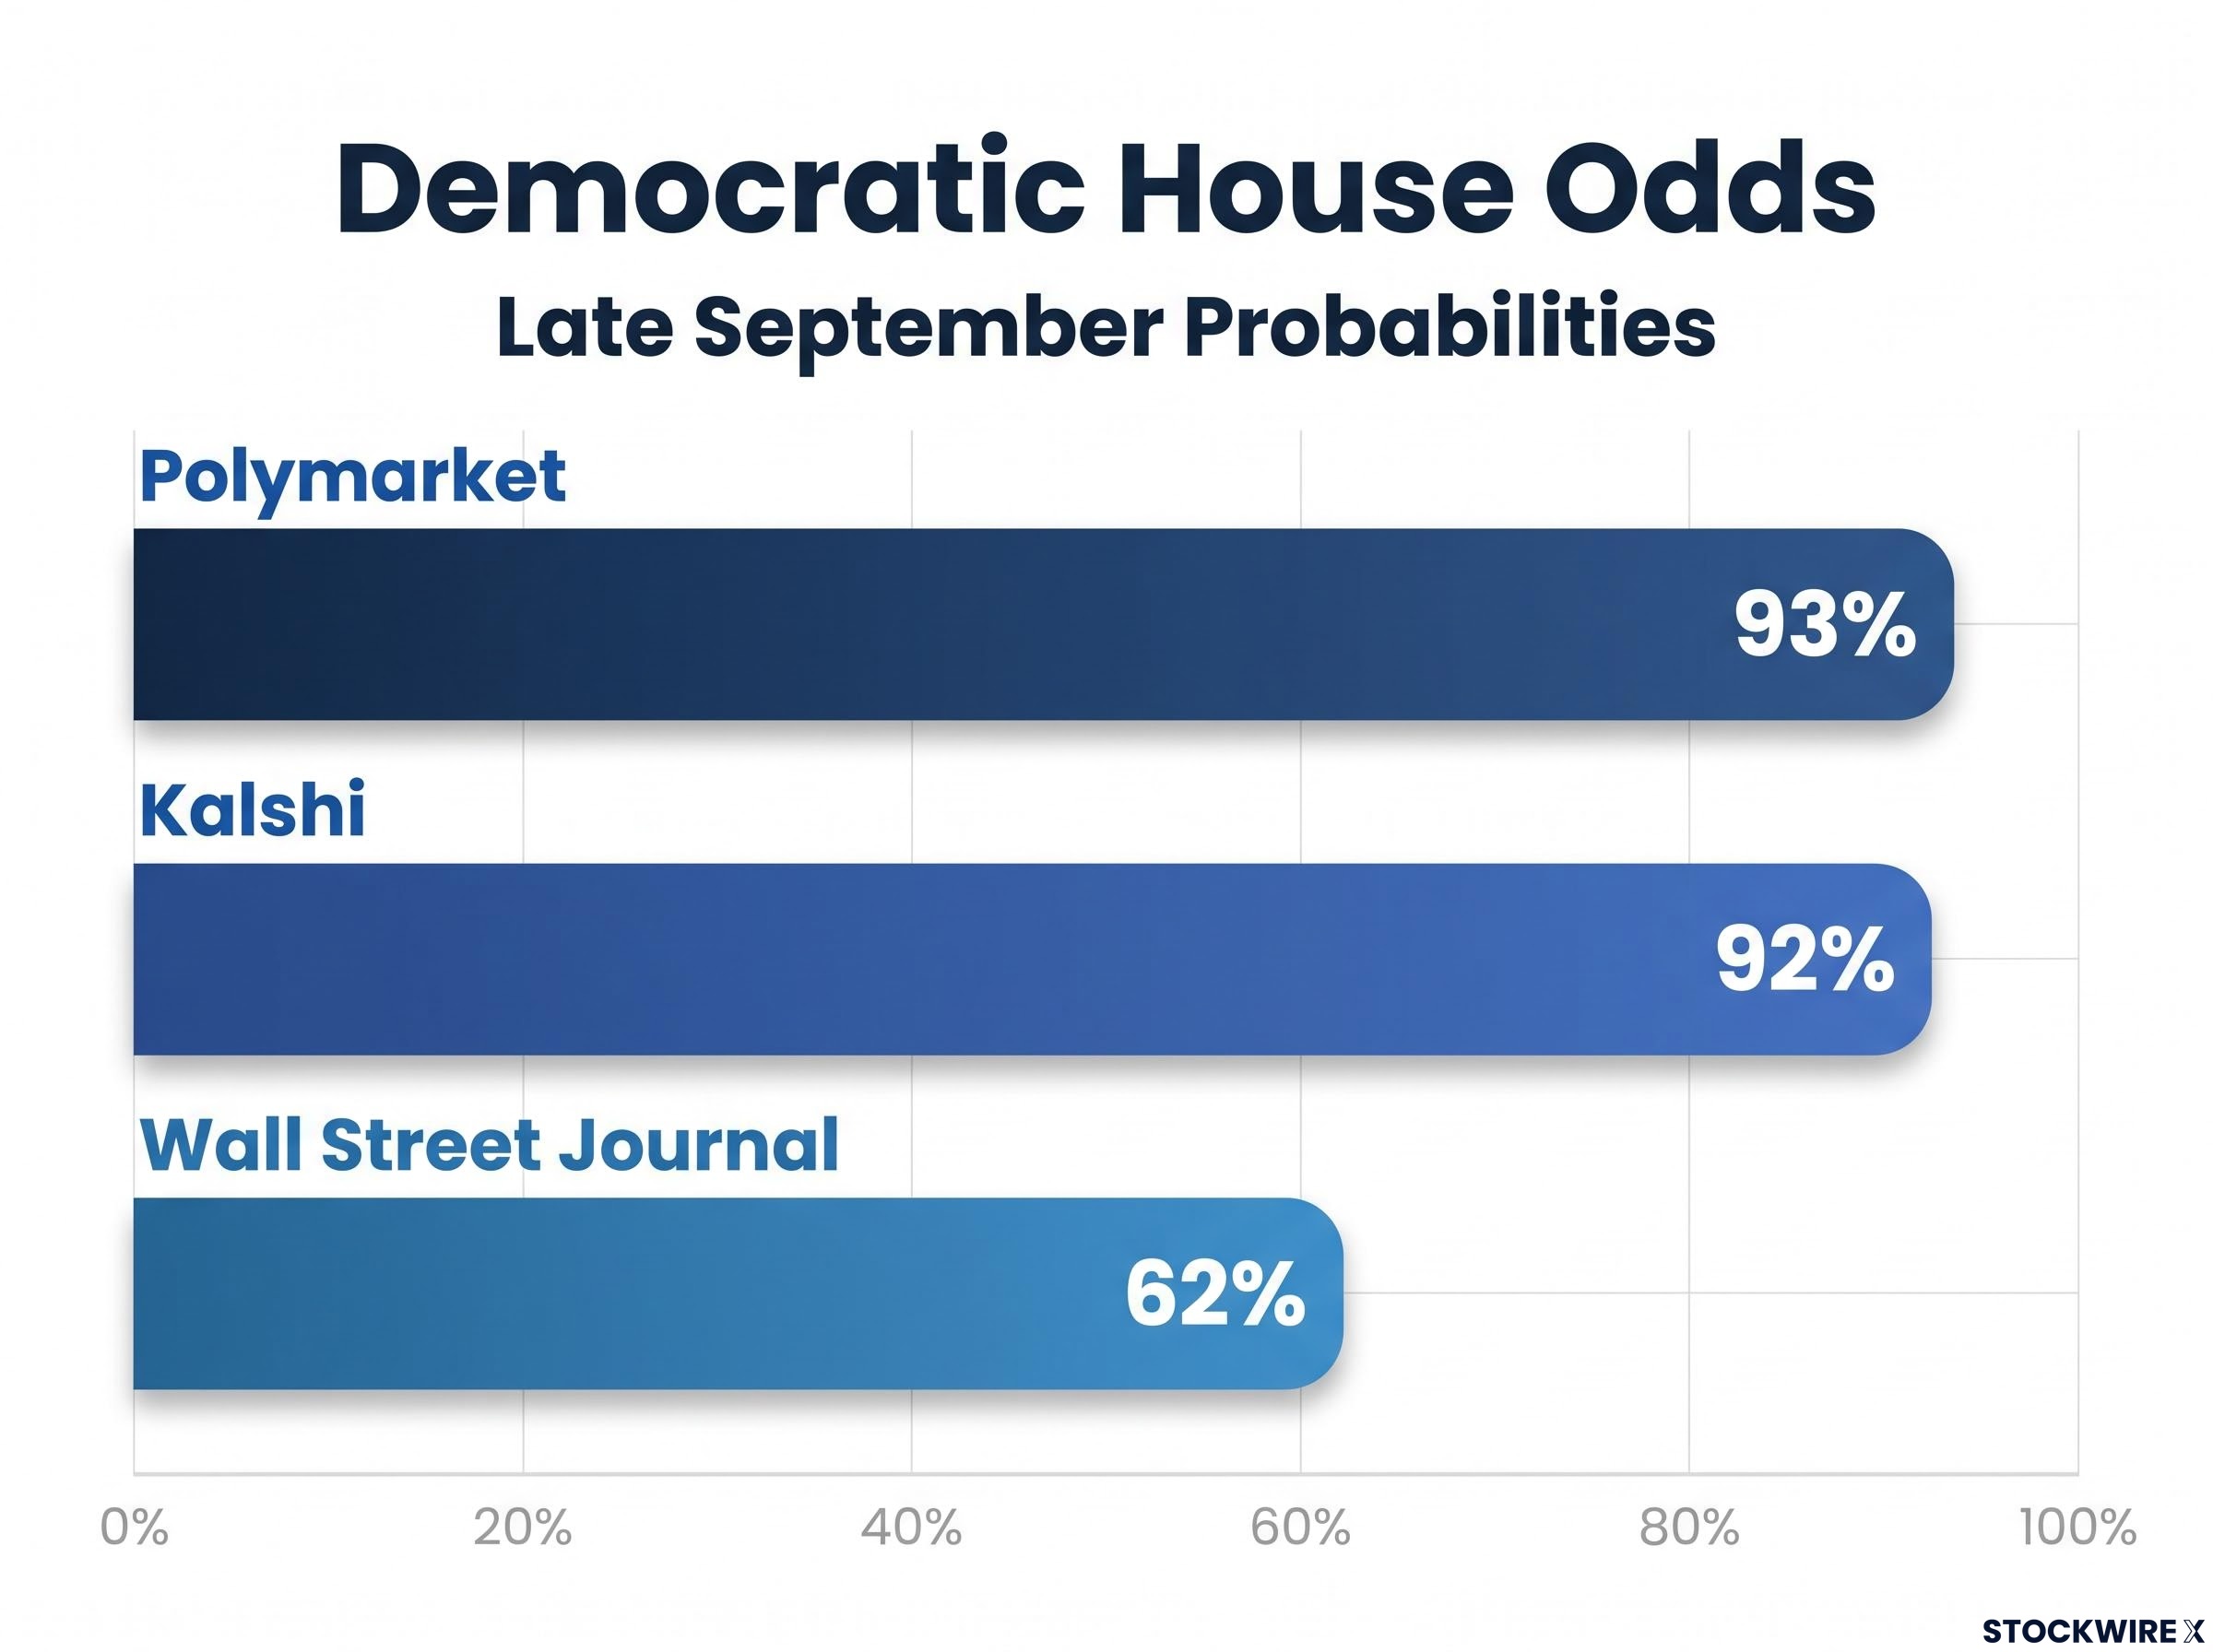
| Platform | Democratic House odds | Democratic sweep odds |
|---|---|---|
| Polymarket (26 September) | 93% | 50-66% |
| Kalshi (24 September) | 92% | 47-64% |
| Wall Street Journal (22 September) | 62% | Not specified |
The Senate is the genuine contest. Prediction market data clustered control odds near 50% to 55% for Democrats, close enough to a coin flip that no serious positioning should assume the outcome.
What the markets are telling you is to prepare primarily for a divided government. That means stress testing your portfolio against legislative gridlock rather than sweeping reform.
One caveat worth holding onto: prediction market probabilities move fast. The spread between the Journal’s 62% and the platforms’ 90-plus figures largely reflects genuine market movement across a three-week window, so treat any single number as a snapshot, not a settled forecast.
Portfolio implications of a divided congress
If gridlock is the base case, the important question changes. It is no longer “what will Congress pass” but “where does policy risk go when Congress passes almost nothing.”
The answer is that risk migrates from the legislative floor to the regulatory agencies. With a Democratic House alongside a Republican Senate as the most likely divided configuration, the prospect of sweeping corporate tax overhauls or major shifts to business regulation becomes considerably more remote. Budget and debt ceiling fights could still rattle markets, but the sweeping bills would stall.
The alternative split, a Republican House with a Democratic Senate, produces similar stalemate through a different route, with added friction around nominations and budget processes. Either way, the executive branch and its rule-making agencies inherit the power that a gridlocked Congress cannot use.
Recent history shows how this plays out at the sector level:
- After the 2018 midterms handed Democrats the House, healthcare stocks, particularly managed care and providers, benefited from the reduced risk of disruptive legislation to the Affordable Care Act.
- Sectors banking on further corporate tax cuts, such as some high-tax industrials, lost their policy tailwind and traded more on global growth.
- Regulatory risk for large technology firms and financials shifted from new laws toward enforcement and rule-making.
- After the 2022 midterms produced divided government, clean energy and climate-related names became far more sensitive to regulatory agencies and state-level policy than to any new federal bill.
- Traditional energy benefited from constrained supply and limited new federal restrictions.
The pattern for you is clear. In a split Congress, watch the sectors most exposed to executive branch regulation, technology and clean energy chief among them, rather than betting on sweeping corporate tax cuts or a fresh wave of infrastructure spending that gridlock makes unlikely.
Mapping the outlier unified sweep scenarios
The base case is divided government, but base cases fail. A single-party sweep sits within the probability distribution, and the fiscal shifts it would unlock make it worth mapping before the vote, not after.
A full Democratic sweep would widen the path for investigations and regulatory or environmental measures, raising scrutiny on large technology firms, major financial institutions, and fossil fuel producers. It would also lift the odds of new fiscal spending, though today’s elevated deficits cap how large any such programme could realistically get.
Polymarket priced the implied probability of a Democratic sweep somewhere between 50% and 66% across late September, higher than many headline narratives suggest, which is exactly why it cannot be dismissed as a tail risk.
The regulatory reach of a Democratic sweep
Unified Democratic control would expand the capacity for regulatory pressure on the sectors most exposed to it. Large technology firms could face heightened antitrust and enforcement attention, financials could see tighter oversight, and fossil fuel producers could confront renewed environmental scrutiny at the agency level.
Deregulation and deficits in a Republican sweep
A Republican sweep points the other direction. Continued control of both chambers would be expected to favour deregulation and tax reduction, benefiting traditional energy and defence.
The catch is fiscal. Deficit-driven inflationary pressure could keep interest rates elevated and weigh on high-growth equities even as other sectors rally.
The long-run data shows how similar the index-level outcomes have been. A 2024 whitepaper from WT Wealth Management found average annual S&P 500 returns of 14.52% under unified Republican governments and 14.01% under unified Democratic governments.
What you should take from this is that a unified government unlocks major fiscal shifts in either direction. If the prediction markets are underpricing a wave election, your exposure to defence or high-tax industrials could reprice suddenly, so build that possibility into your thinking now.
Why macro fundamentals outweigh Washington politics
Here is the reality check that pulls the whole picture back into focus. The partisan makeup of Congress matters far less to your returns than monetary policy, oil prices, and the health of the broader business cycle.
Analysts at Barclays and Wolfe Research have made this point directly, arguing that macro fundamentals ultimately trump electoral outcomes. Rate tightening cycles have historically driven a significant portion of the weakness that tends to surface in midterm years, far more so than uncertainty about which party wins.
The UBS record itself proves the point. That celebrated 14.5% average window turned negative in only three years since 1950, and each exception was a macro story, not a political one.
- 1978: high inflation and aggressive rate tightening overwhelmed any post-election relief.
- 2002: the fallout from the dot-com collapse and early post-9/11 uncertainty dragged returns lower.
- 2018: aggressive Federal Reserve tightening combined with trade war escalation broke the pattern.
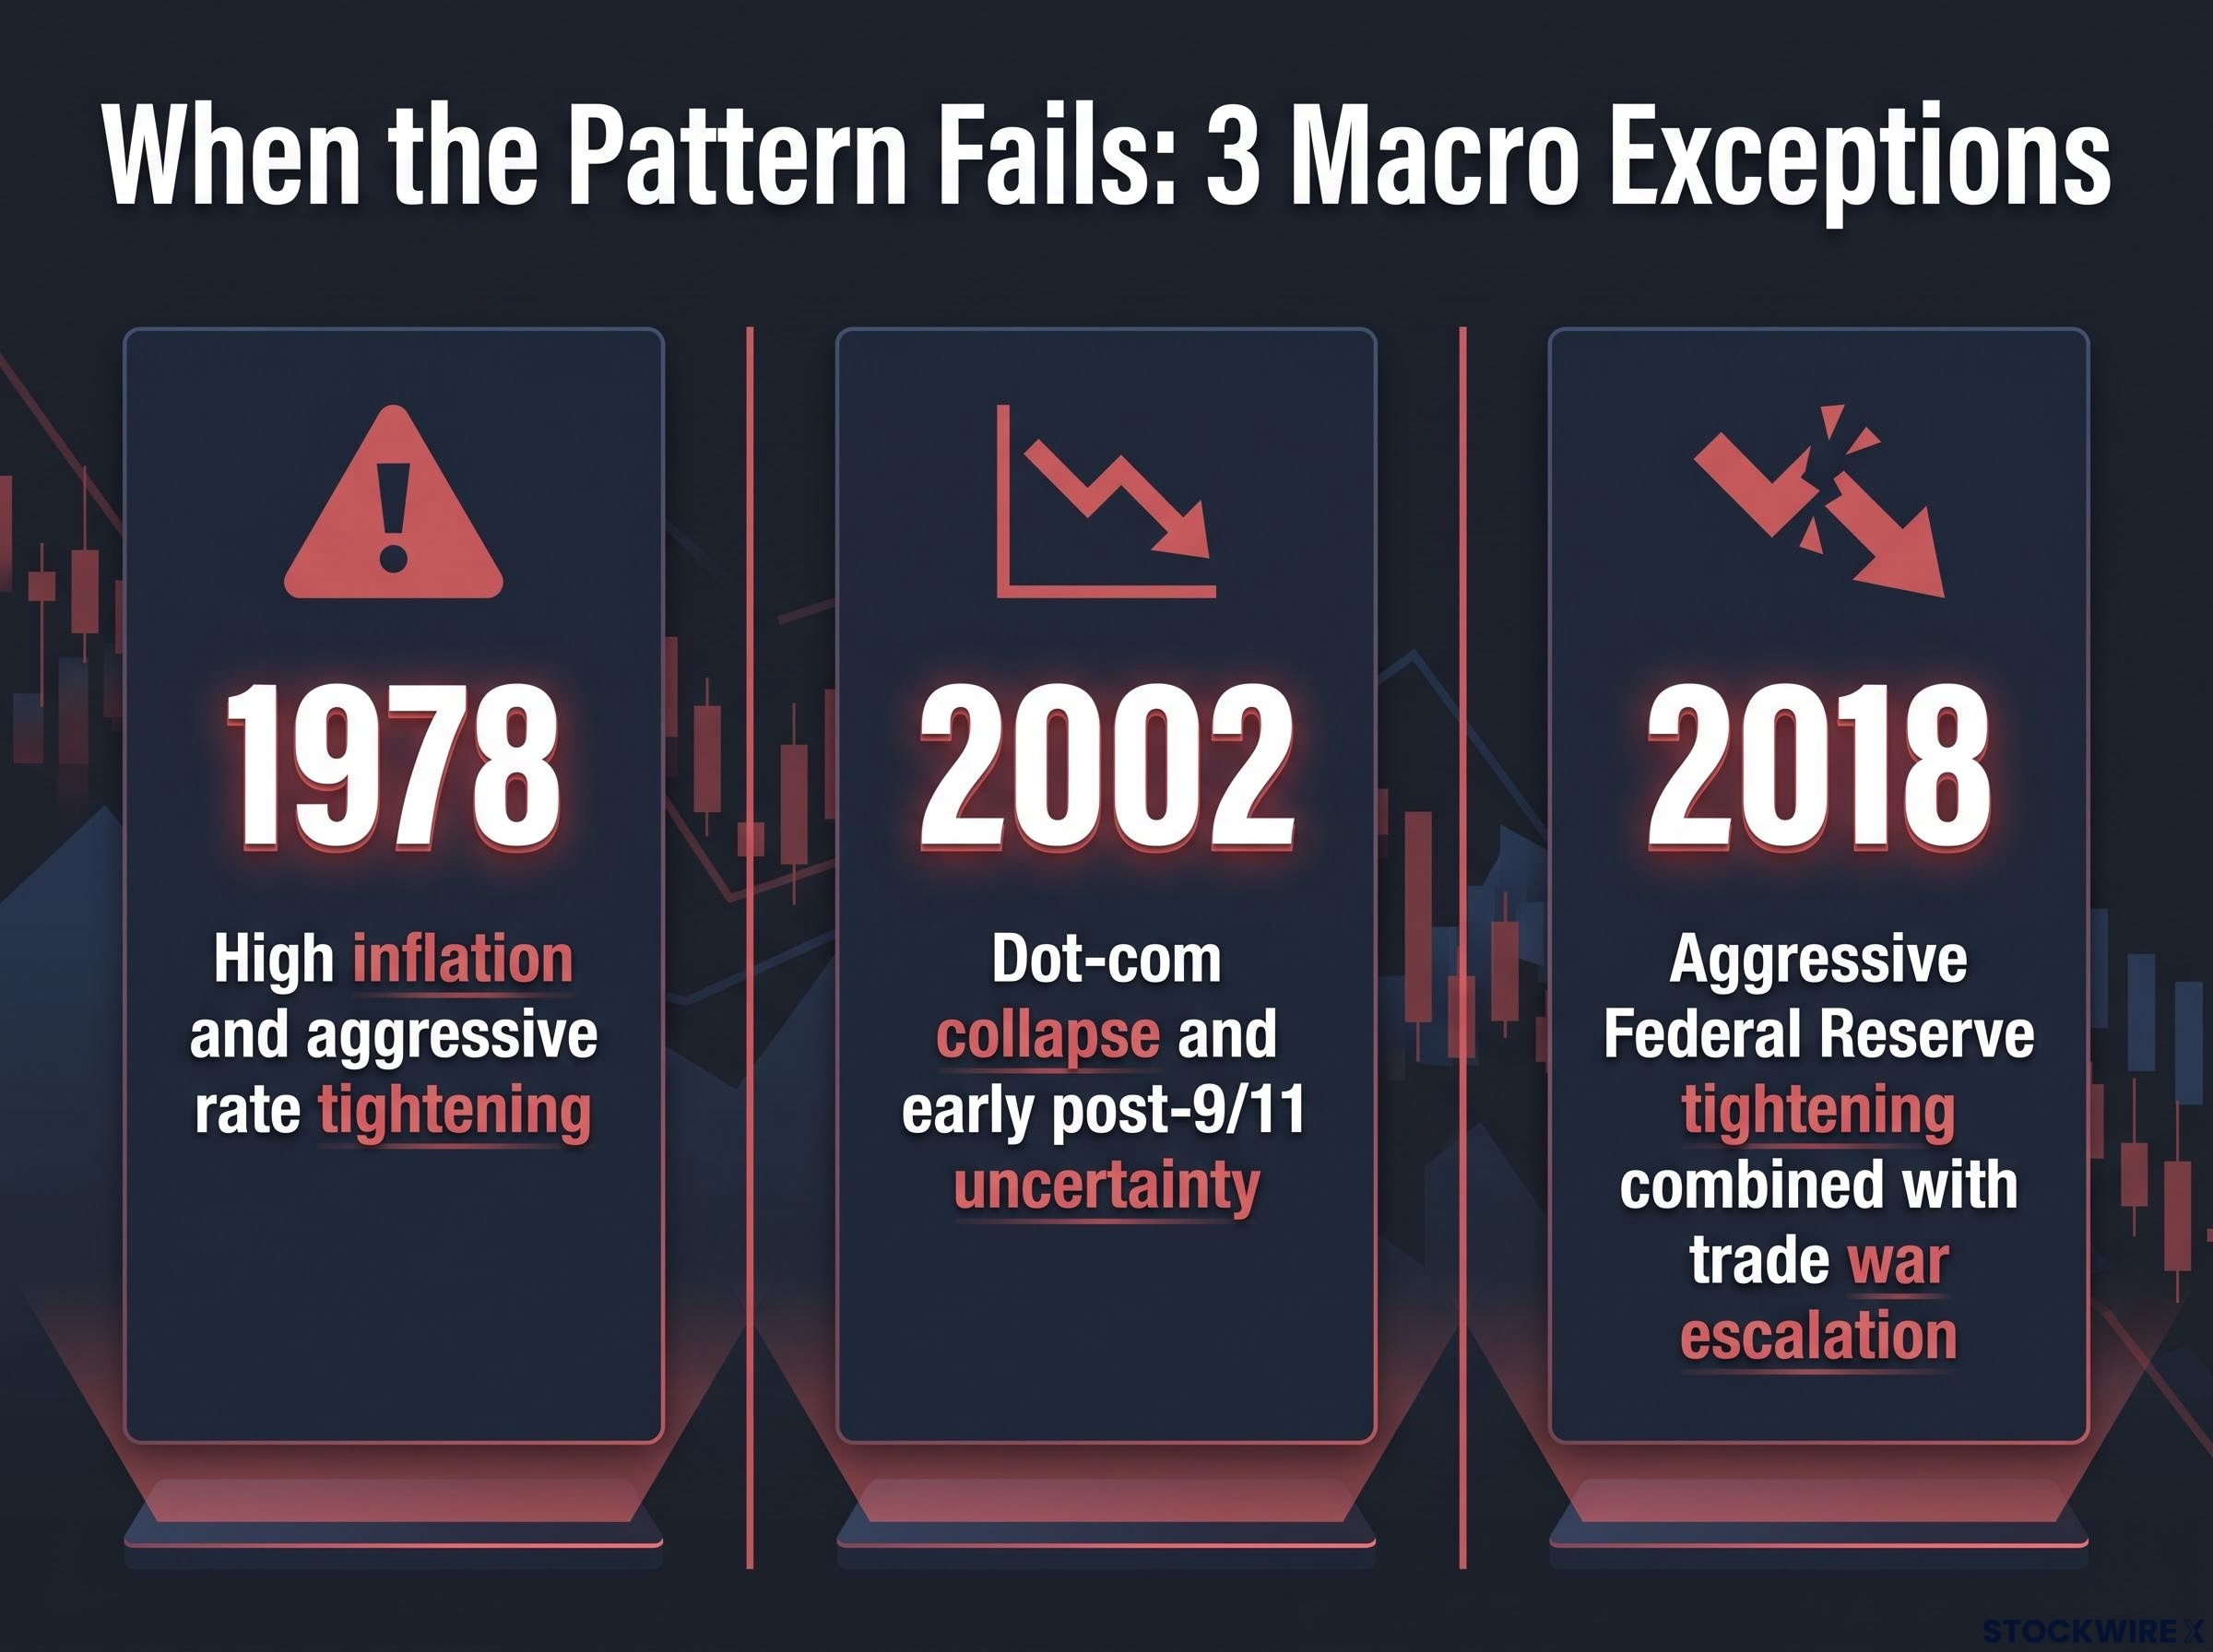
Each of those years carried the usual electoral clarity. What they lacked was a supportive macro backdrop, and that absence was decisive.
For 2026, the complication is the debt overhang. Elevated public deficits and rising interest costs leave little room for large new fiscal stimulus, even if a unified Congress wanted to pass it, and they raise the risk that bond markets push yields higher and pressure equity valuations regardless of who controls the Capitol.
The takeaway for you is uncomfortable but important. If inflation and rates stay elevated, you cannot lean on a historical election relief rally to rescue a struggling portfolio, which means prioritising core economic health over political calculus.
This article is for informational purposes only and should not be considered financial advice. Investors should conduct their own research and consult with financial professionals before making investment decisions.
Past performance does not guarantee future results. Financial projections are subject to market conditions and various risk factors.
Positioning a portfolio for the November transition
The tension running through all of this is straightforward. Prediction markets point to a high probability of gridlock, yet the macro environment of rates, inflation, and deficits will likely matter more to your returns than whichever coalition takes the House or Senate.
That argues against dramatic, binary portfolio moves in the final weeks before the vote. Prediction market odds swing sharply, and repositioning your capital around a number that can shift ten points in a week is a recipe for whipsaw.
The steadier approach is to favour quality fundamentals and sectors that hold up across multiple political outcomes, while watching for the agency-level regulatory risks that gridlock tends to amplify.
Treat November as a catalyst that removes uncertainty rather than a reason to head for the exits. The historical pattern, the probabilities, and the macro backdrop all point to the same conclusion: the election is one input among several, and the investors who keep it in proportion are the ones best positioned for whatever the results deliver.
—