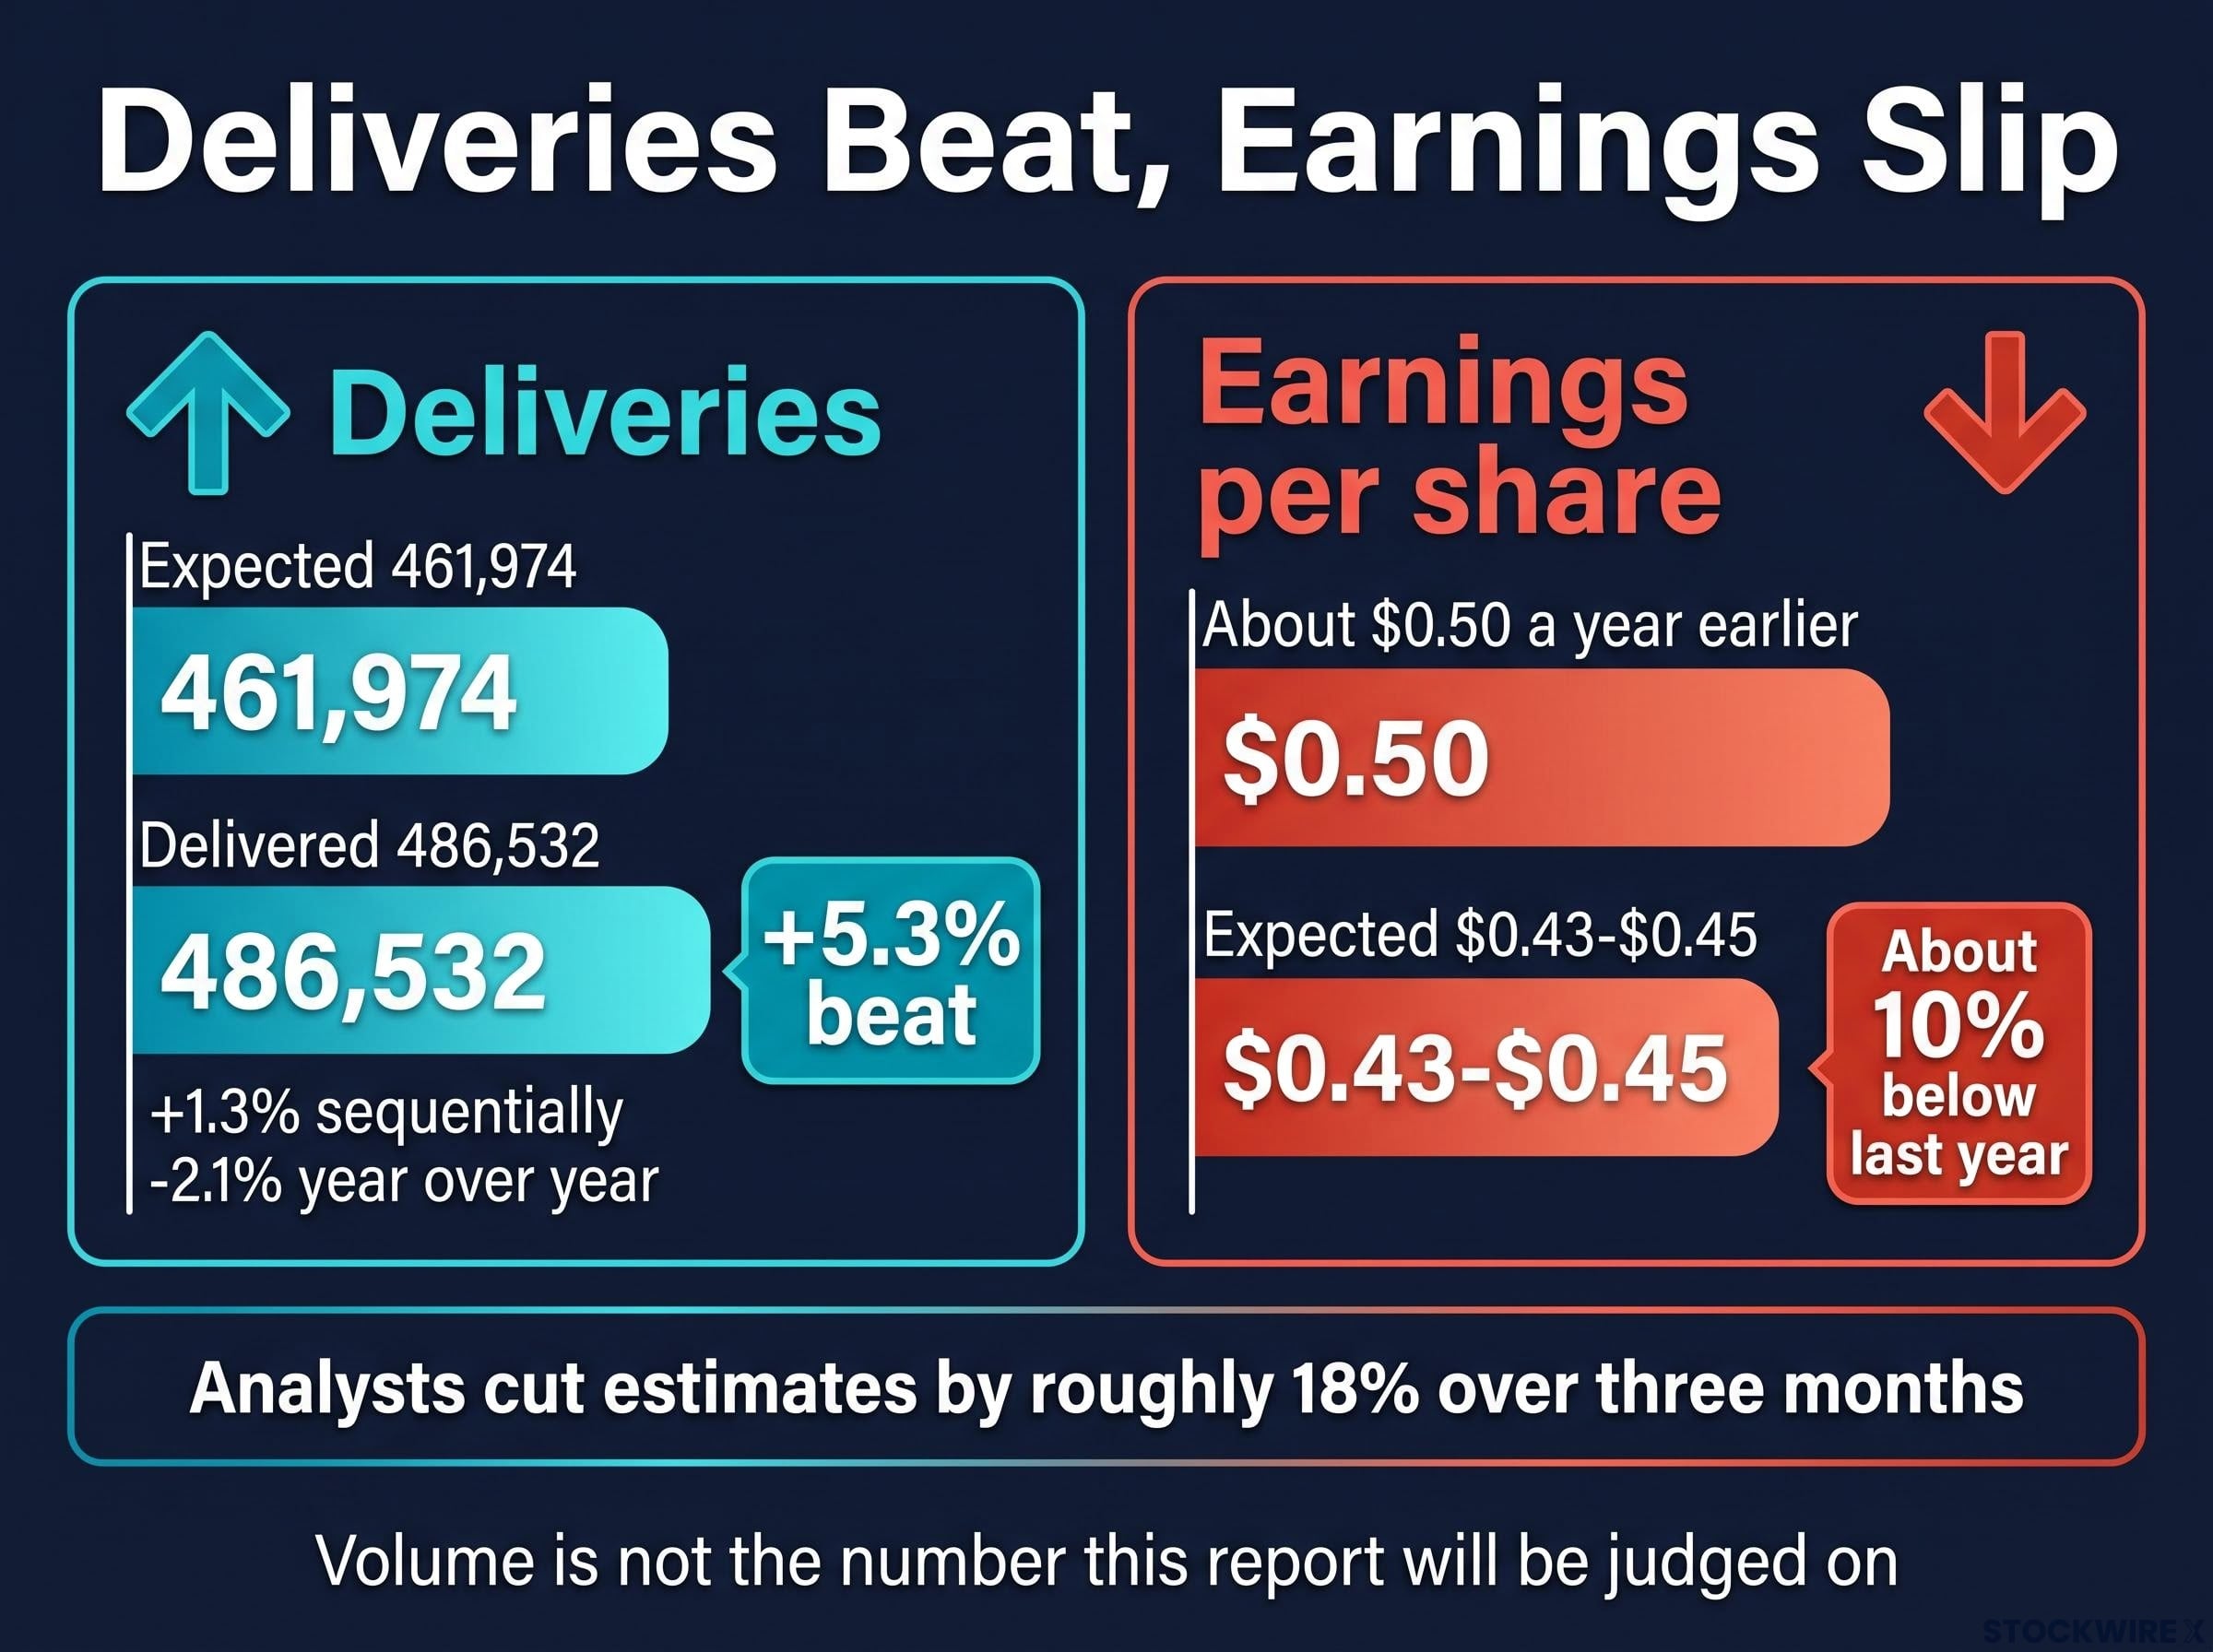
Tesla beat its delivery forecast by about 5.3% last quarter, and Wall Street still expects earnings per share to fall to roughly $0.43-$0.45, down from about $0.50 a year earlier. That gap is the signal many investors miss heading into this Tesla Q3 earnings preview: vehicle volume is not the number this report will be judged on.
Tesla reports after the close on Wednesday, 21 October. The stock is down roughly 19% for the year and has fallen after each of its last three earnings releases.
The Roadster demo and talk of a SpaceX merger are crowding the headlines, competing with margins and cash flow for attention.
Here is how to read the roughly 7.5% implied move and the long-dated volatility behind it, so you can separate what the options market has priced from what is simply noise.
Why is Tesla’s EPS expected to fall when deliveries beat?
On the surface, the contradiction looks strange. Tesla delivered 486,532 vehicles against company-compiled expectations of 461,974. Yet consensus earnings sit about 10% below last year, and analysts have cut estimates by roughly 18% over three months.
The consensus setup
The estimates themselves do not agree, and the spread is worth knowing before Wednesday.
| Source | EPS | Revenue | Date |
|---|---|---|---|
| AlphaStreet (24 analysts) | $0.45 | $28.11B | 16 October |
| Other recent previews | $0.43 | $27.79B | 16-18 October |
| Some data services | $0.47 | $28.44B | 16-18 October |
The delivery figure itself is softer than it looks. Deliveries rose just 1.3% sequentially and fell 2.1% year over year. Reported production of 464,391 sat about 22,000 below deliveries, which suggests inventory drawdown may have flattered the beat, though that production figure has not been independently confirmed.
The same inventory drawdown dynamic appeared in the prior quarter, when roughly 28,000 delivered units came from stock rather than new production, a reminder that one strong delivery print does not confirm durable demand.
What is dragging on profit
The pressure sits below the revenue line. Previews point to several overlapping drags:
- Pricing and mix: aggressive price cuts and a less favourable product mix to stimulate demand
- Tariffs and input costs: cited as gross-margin risks, especially when Tesla absorbs higher costs
- Regulatory credits: less predictable credit revenue could depress earnings even as deliveries improve
- AI, robotics and robotaxi spending: capital expenditure for 2026 reportedly projected above $25 billion (not independently confirmed)
- Energy storage: reportedly 13.7 GWh against roughly 15.9 GWh estimated, limiting any offset (not independently confirmed)
The prior quarter shows how quickly this bites. CNBC reported adjusted EPS of $0.34 against about $0.50 expected, operating margin squeezed to 1.4% and free cash flow turning negative, figures not independently confirmed.
The delivery headline tells you little about profitability. When results land, look first at automotive gross margin excluding credits and at free cash flow.
When big ASX news breaks, our subscribers know first
What does a 7.5% implied move actually tell you?
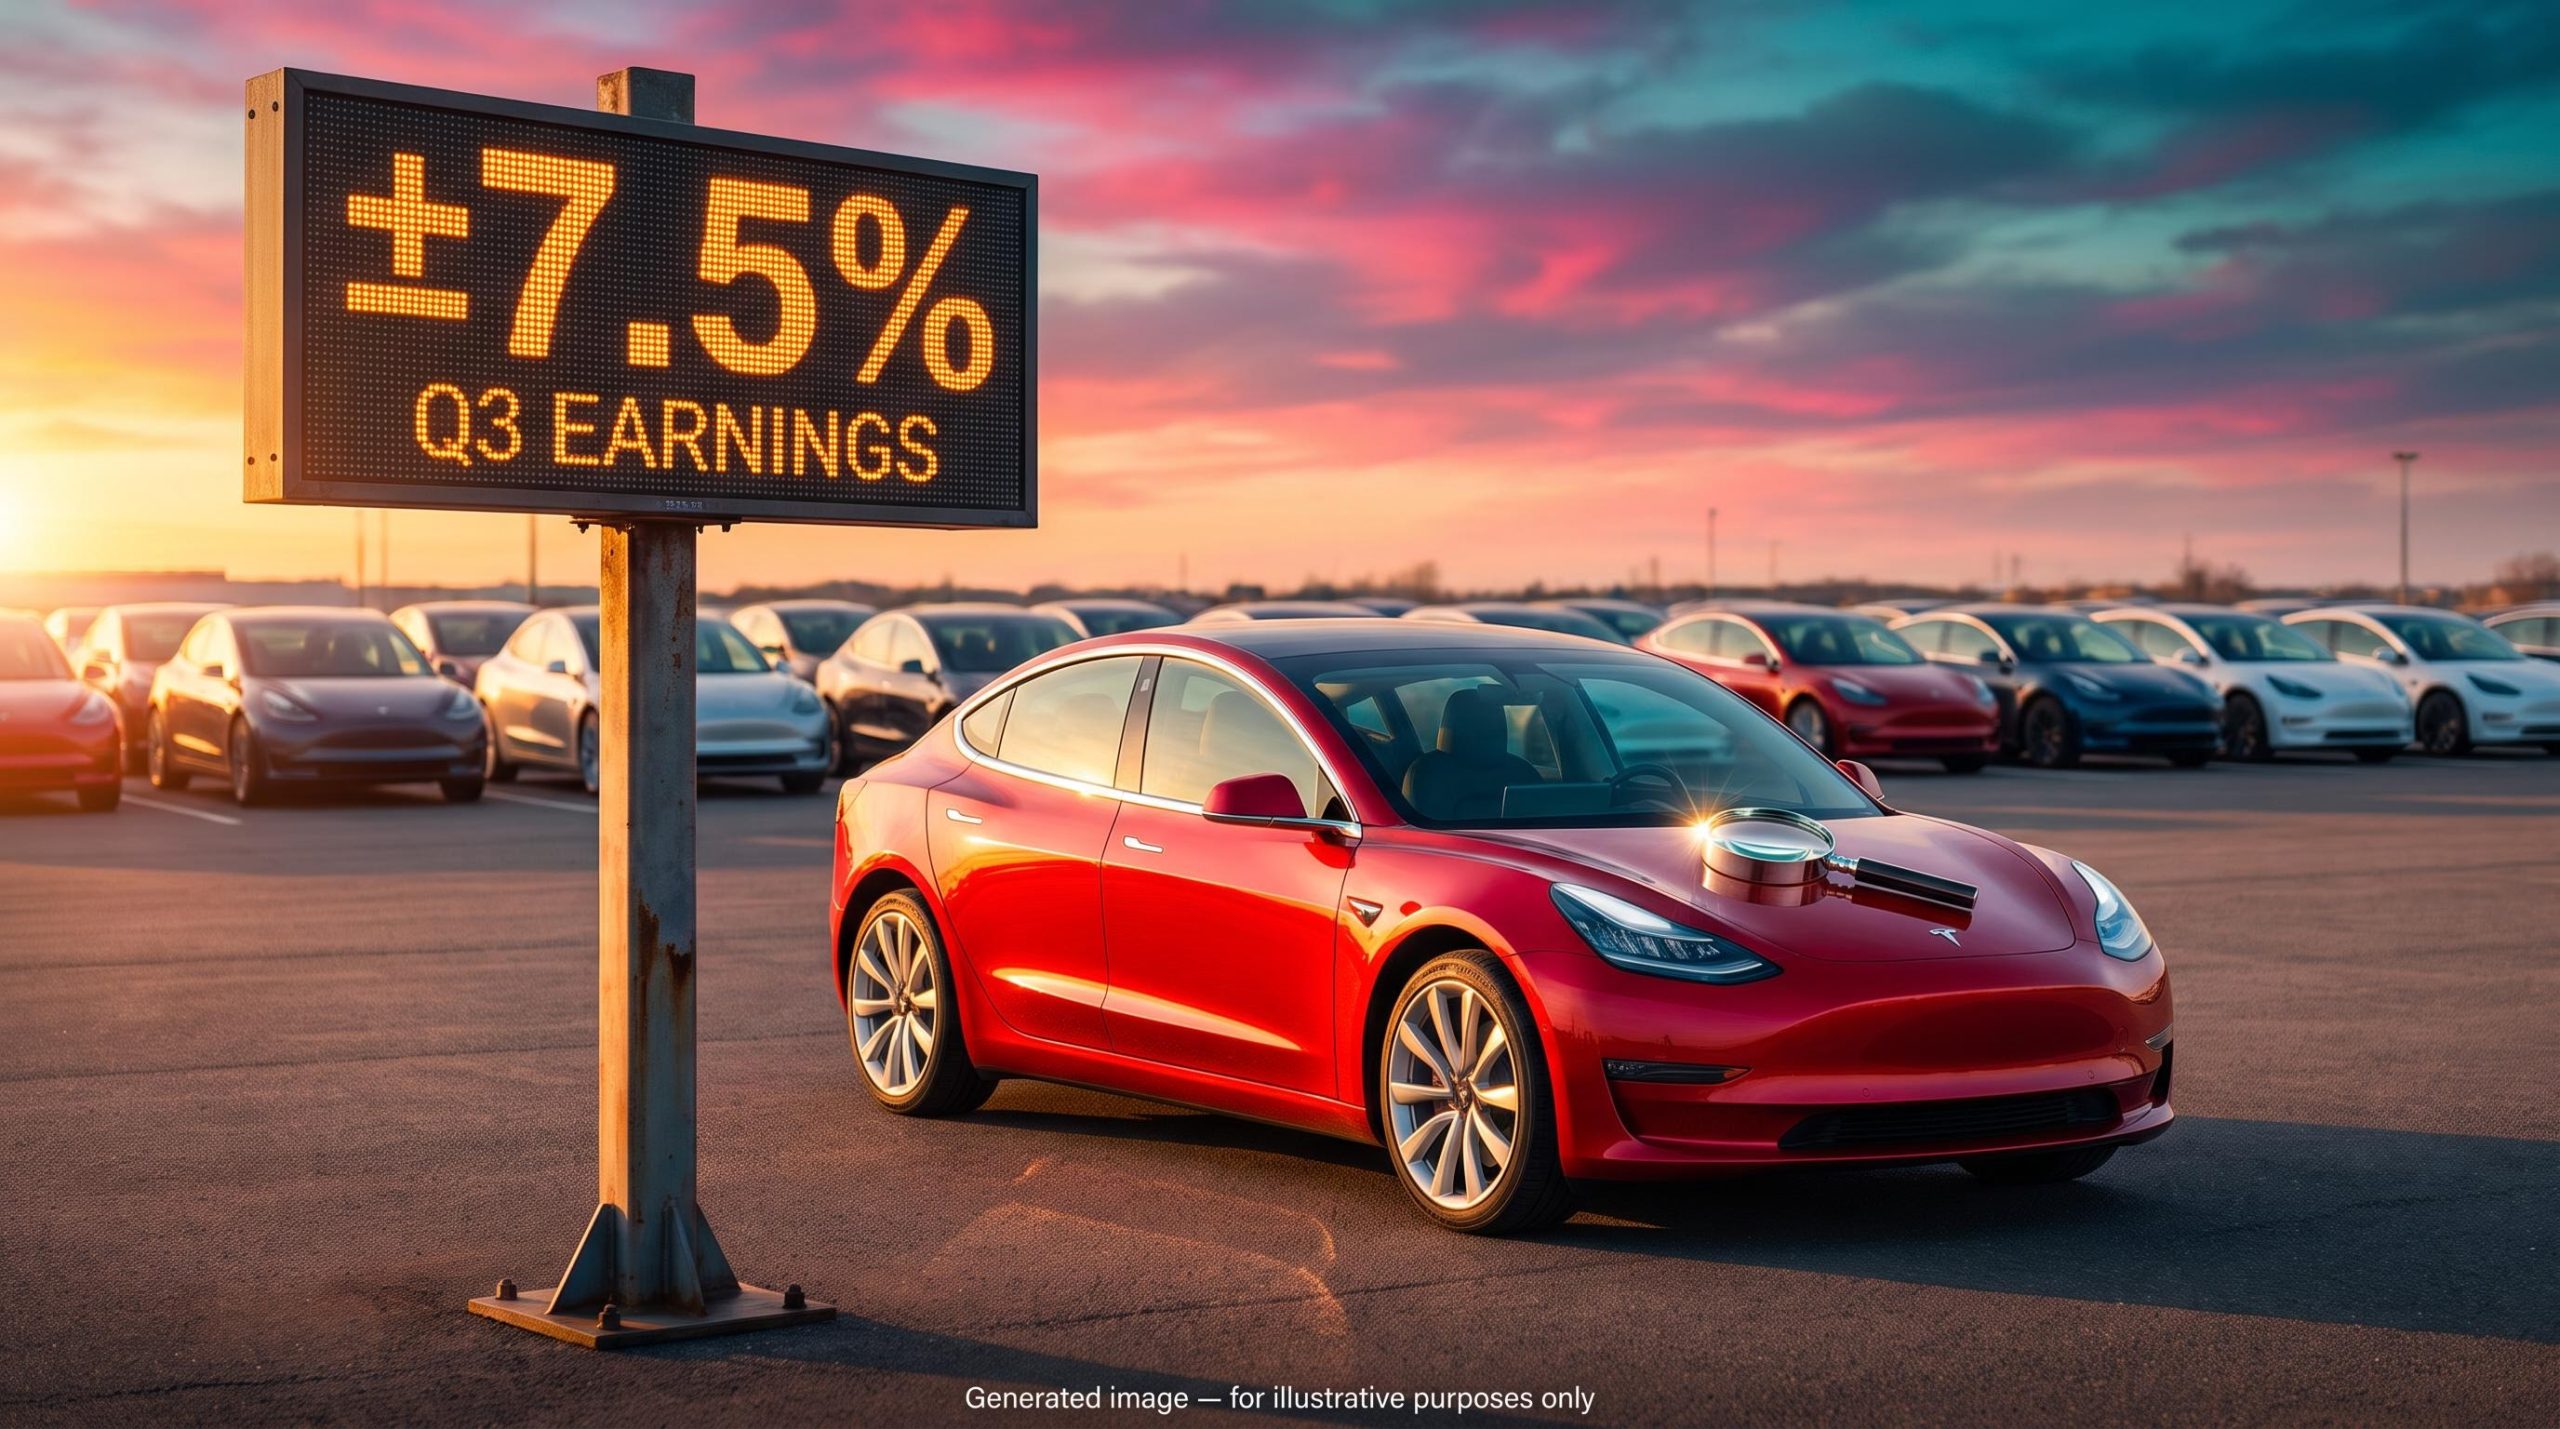
On a trading screen, the number looks simple: options imply roughly a ±7.5% move, about $27 on a stock near $362. That puts the expected range at about $335-$389, according to Earnings-Watcher and Saxo Markets.
The implied move is the size of the swing the options market is pricing for the day after earnings. It measures magnitude, not direction.
The comparison with history is where the headline figure starts to mislead.
| Measure | Figure | Window | Note |
|---|---|---|---|
| Implied move | ±7.5% | This report | About 25% above four-quarter average |
| Realised average | 7.8% | Recent quarters | Lifted by two large reactions |
| Realised median | 4.5% | Recent quarters | The more typical outcome |
| Four-quarter average | 5.95% | Last four quarters | tastytrade calculation |
These figures come from different windows and methods, so they are not directly interchangeable. The pattern still holds across them.
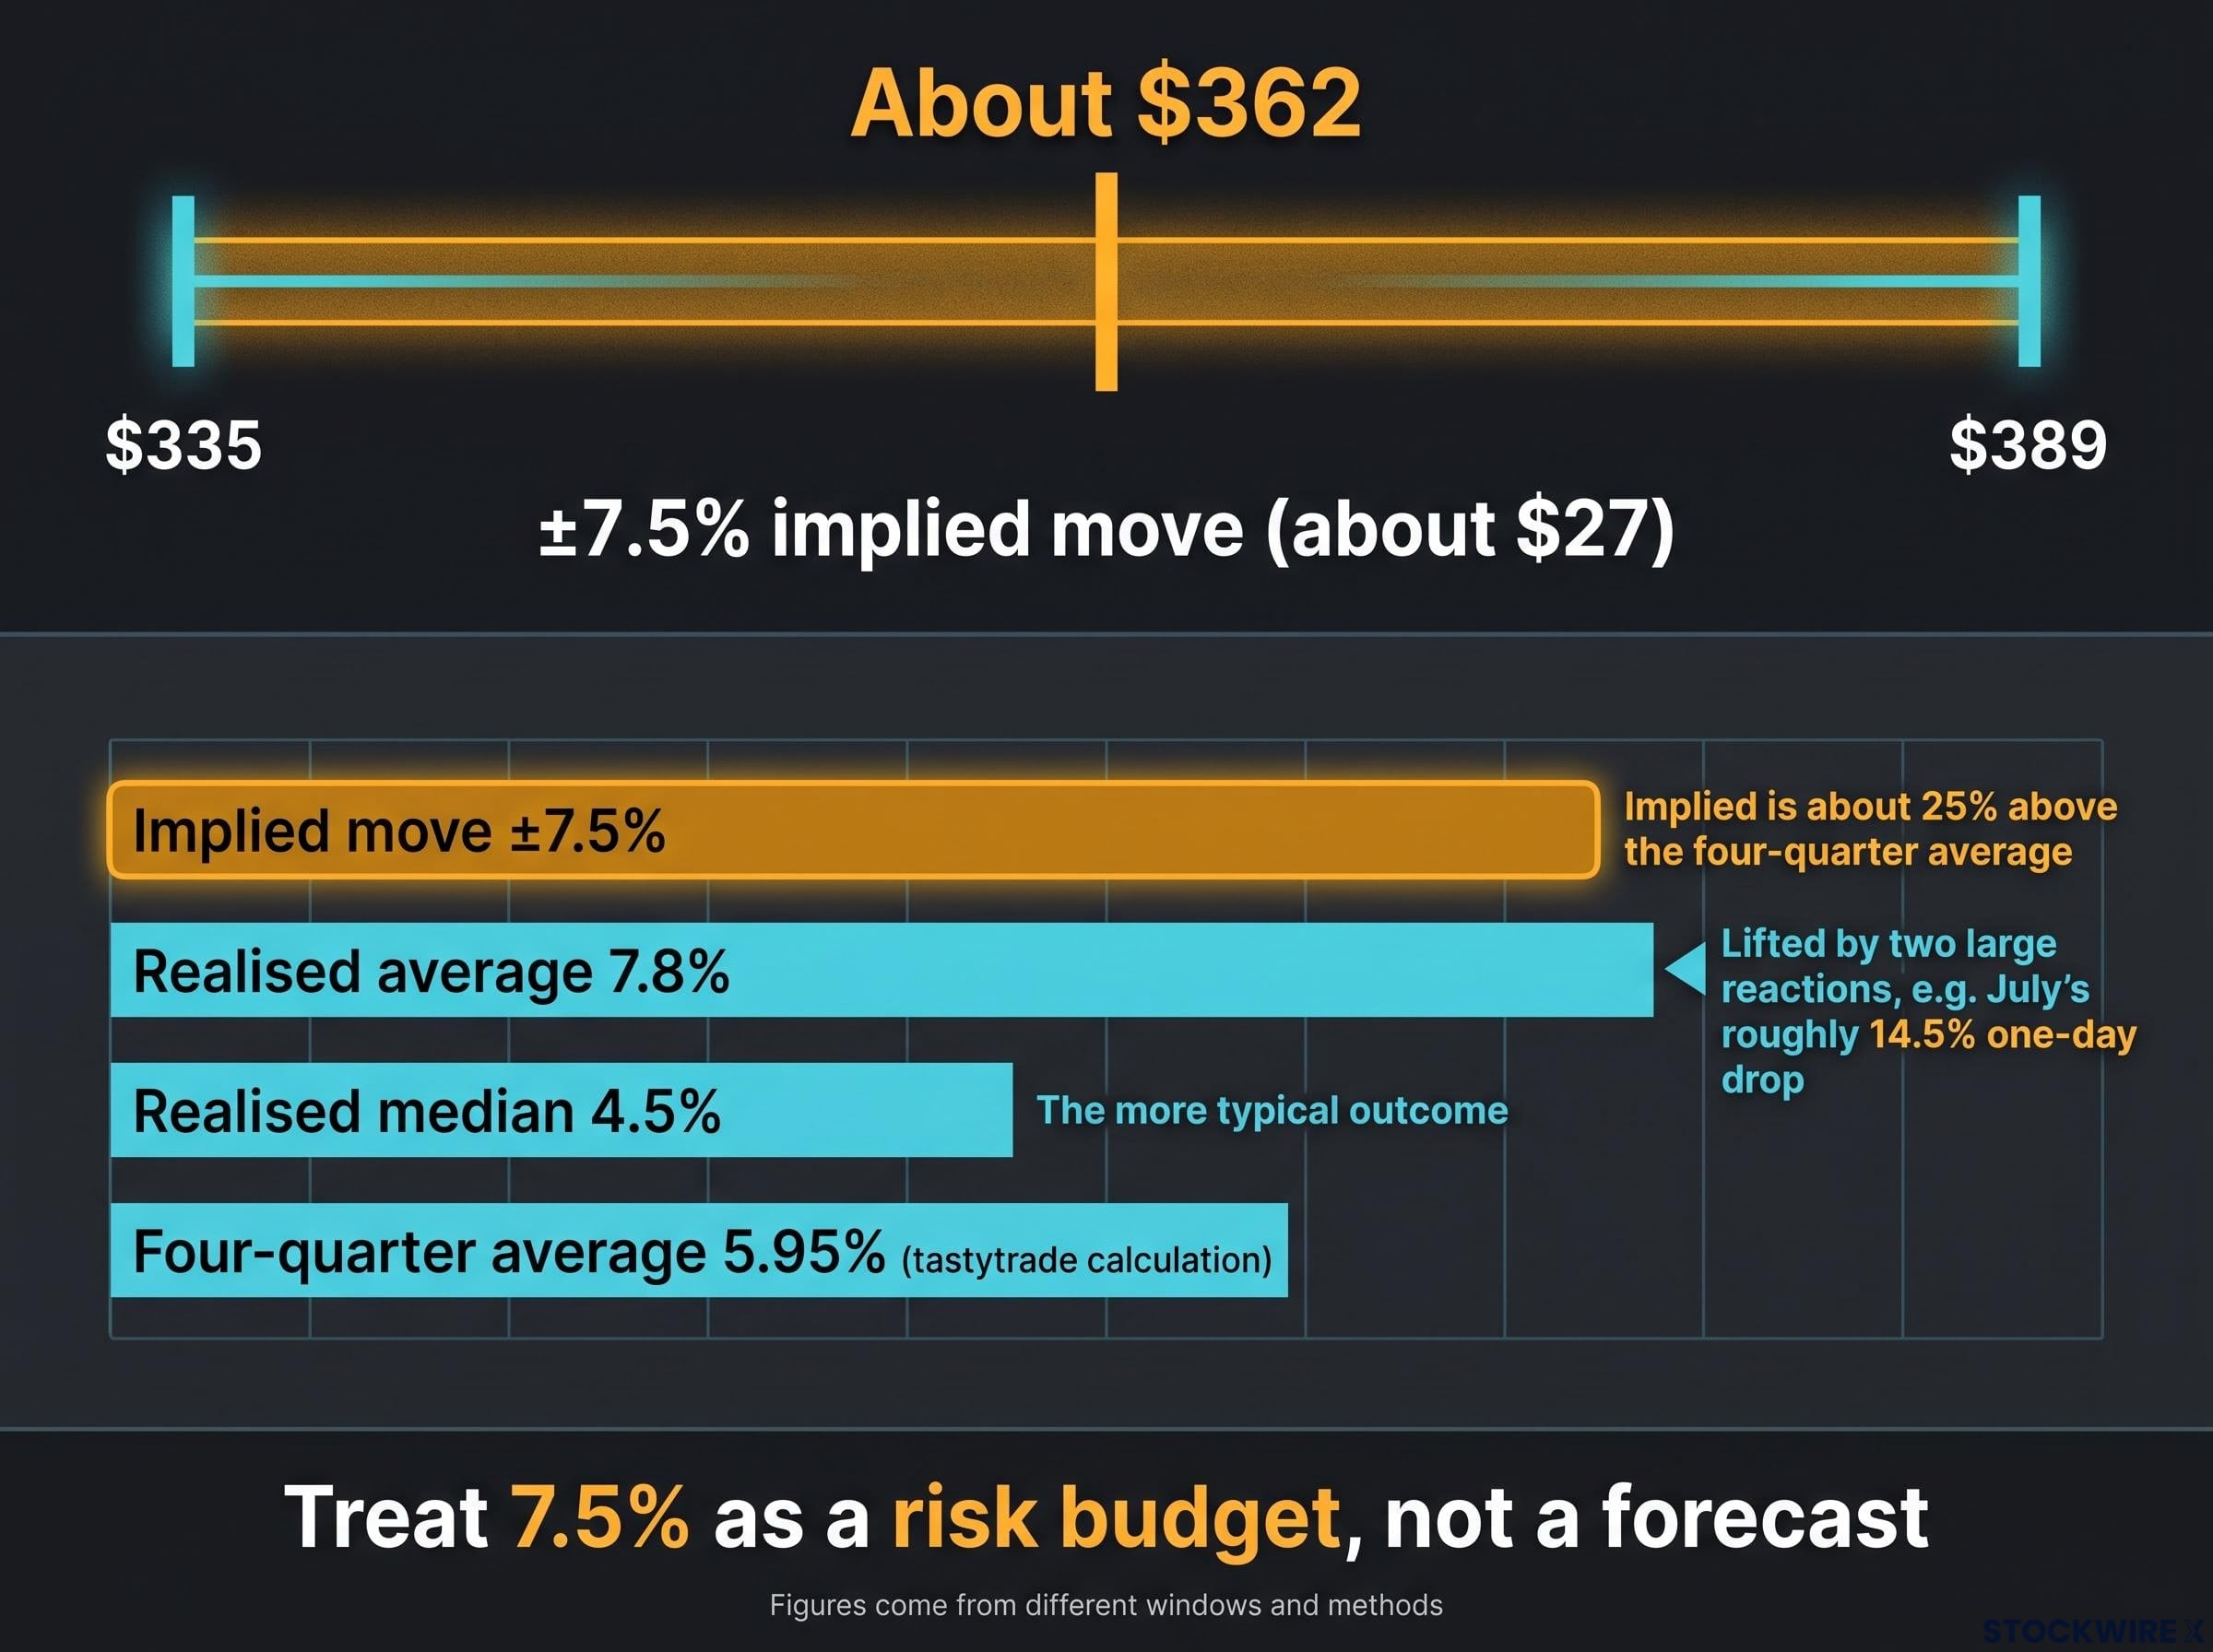
Average versus median Recent post-earnings moves averaged about 7.8%, but the median was only about 4.5%. A few outsized reactions, such as July’s roughly 14.5% one-day drop, pull the average well above the typical result.
The tastytrade presenter attributes the premium to high expectations across large tech names and Tesla-specific uncertainty, and considers it reasonable.
Further out, implied volatility (the market’s estimate of how much a stock may swing over a period) runs roughly 43-47% from November to March expirations, with some contracts in the 50s. Options expiring in 2028 imply a move of about $183-$185. That reflects broad uncertainty over autonomy, robotaxi, Optimus, AI spending and regulation, not a single event.
Treat 7.5% as a risk budget, not a forecast. The median reaction has been well below it.
Options signals around earnings describe the cost of risk and the positioning of holders, not a price target, which is why a 7.5% implied move can coexist with a median realised reaction of only 4.5%.
Did the Roadster demo and SpaceX merger talk change what is priced in?
The past week delivered two stories built for headlines. The options data tells a quieter one.
The Roadster: sentiment, not earnings
Tesla reportedly showed the redesigned Roadster in Waco, Texas, on 15 October, using SpaceX-derived thrusters; that date and the demo details have not been independently confirmed. Shares rose about 4% premarket, according to Reuters. By 16 October, the Los Angeles Times reported, the stock had fallen about 2% to trade near $355.
Production is not expected until 2028, and no price was disclosed. Gary Black of Future Fund ran the materiality test: 3,000 cars a year at $100,000 profit each would add only about $0.06 to projected 2029 EPS.
That is immaterial to this quarter.
The SpaceX question: speculation versus structure
The bull case is loud. Barclays’ Dan Levy described a combination as increasingly the consensus expectation, possibly announced before Tesla’s annual meeting, which must occur by 6 December. Wedbush’s Dan Ives puts the odds of a combined company in 2027 at 80%.
Barclays’ framework values SpaceX at about $2.1 trillion and Tesla at $1.5 trillion, implying Elon Musk could own about 37% of the combined group while controlling roughly 56% of votes. The obstacles are substantial:
- Valuation and exchange-ratio negotiations
- Conflicts of interest between companies tied to one controlling figure
- Director recusal requirements
- Antitrust review
- China exposure, which JPMorgan reportedly views as a practical bottleneck
- Board and shareholder approval at both companies
The tastytrade presenter is sceptical on options grounds. A January 2029 $530 call costs about $60, a breakeven near $590, which he argues implies an unrealistic valuation. The research found no discrete options premium tied to a merger, and no transaction has been confirmed.
Neither story is a reliable earnings catalyst. Positioning on them is a bet on headlines, not on Wednesday’s numbers.
For readers wanting the full picture, our deep-dive into the Tesla-SpaceX merger structure examines how the SpaceX listing changes the mechanics of a possible stock-for-stock deal.
How to think about earnings-week positioning and the risks to the setup
The setup looks orderly on paper. The risks sit in how quickly a tidy setup can break.
July is the cautionary case. Tesla reportedly posted revenue of $28.2 billion (a figure not independently confirmed), but EPS of $0.34 missed the roughly $0.50 consensus, and the stock fell about 14.5% in one day. Constructive revenue did not protect the shares when margins and cash flow disappointed.
The prior quarter showed the same pattern at larger scale, as record Q2 revenue coexisted with a 35% EPS miss, a 1.4% operating margin and the first negative free cash flow since early 2024.
The risk runs both ways. A strong margin or autonomy surprise could produce a move well above the 4.5% median, while another cash-flow miss could hit hard. Merger talk also cuts both ways: no announcement, or unfavourable terms, could turn speculation into a negative catalyst.
The setup in brief EPS of roughly $0.43-$0.45, revenue of $27.8-$28.1 billion, 486,532 deliveries against 461,974 expected, and an implied move of about ±7.5%.
With the stock down about 19% this year and lower after three straight reports, these five variables are likely to decide the reaction:
- Automotive gross margin excluding regulatory credits
- Free cash flow
- 2026 capital expenditure plans
- Forward guidance
- Robotaxi timing
The information that matters sits in margins and guidance, so prepare for outcomes in both directions rather than a single scenario.
What the numbers can and cannot tell you before Wednesday’s report
This report is a margin and cash-flow test, not a volume test. The 7.5% implied move is a budget for risk rather than a prediction of direction, and the median reaction has run far below it.
The Roadster and SpaceX stories have moved headlines, but the options data does not clearly price either one as an earnings event.
When results land after the close on 21 October, check automotive margin excluding credits first, then free cash flow. Those two lines will tell you more than any delivery figure.
This article is for informational purposes only and should not be considered financial advice. Investors should conduct their own research and consult with financial professionals before making investment decisions. Past performance does not guarantee future results, and forward-looking statements are speculative and subject to change.