The PHLX Semiconductor Index is up about 57% in 2026, yet it fell 3.83% on 16 October and has lost roughly 12% so far this month. Many readers will see that drop as a sign that AI demand is cracking. The data points somewhere else: the earnings outlook for AI stocks still looks solid, and what changed was the price of money.
The S&P 500 fell about 2% for the week, its worst stretch since late June. The 10-year Treasury yield sits near 5.09%. Meta, Lam Research, Texas Instruments, Tesla and SpaceX all report in the coming days.
If you treat every AI name as the same trade, you risk selling a cash-rich business because a leveraged one wobbled, or holding a debt-heavy one because a profitable peer looks fine.
Here is why the selloff happened, how borrowing costs feed into it, and the specific numbers that will decide whether this week’s results repair confidence.
Why did AI stocks sell off while the earnings backdrop looks strong?
Start with the gap. The S&P 500 closed at 7,659.44 on Friday, down 1.09%, yet it remains about 2% below the record it set this month and is up roughly 12% for the year. Chip stocks tell a sharper version of the same story.
| Asset | 16 October move | Wider context |
|---|---|---|
| S&P 500 | -1.09% | About -2% for the week; about +12% YTD |
| PHLX Semiconductor Index (SOX) | -3.83% | About -12% in October; +57% YTD |
| CoreWeave | About -12% | About -25% for the week |
| Meta | About -3.7% | Market value about $1.8 trillion |
Lam Research is still up 54% in 2026 and Texas Instruments 59%. The selling was selective, too: chips and hardware, including Dell Technologies, fell, while healthcare and consumer staples gained over the week.
Then the inflation data landed. September headline CPI (the consumer price index, which tracks what households pay for goods and services) came in at 3.7%, and core CPI, which strips out food and energy, rose to 2.6% from 2.4%. The 10-year yield briefly touched about 5.33% before settling near 5.09%.
Futures markets moved with it. Reuters reported a 27% probability of a Fed hike at the 27-28 October meeting as of 15 October, up from roughly 20% before the CPI print, with odds of about 89.5% for December.
“On-off” market Garrett Melson of Natixis Investment Managers Solutions described a nervous mood with real uncertainty about where AI stands, calling it an “on-off” market in which AI dominates when it works.
Strategists at Deutsche Bank and RBC Capital Markets separately cut their tech recommendations. None of this touched profits: S&P 500 Q3 earnings are expected to grow more than 30%, according to LSEG IBES.
What this tells you is that a stock can fall hard on a day when nothing is wrong with its business. The rate used to value its future profits simply went up.
Long-duration growth stocks suffer most when yields jump, a property known as equity duration, because most of their value rests on profits expected many years out and those cash flows are discounted more heavily.
When big ASX news breaks, our subscribers know first
How do rising rates and debt turn a spending boom into a financing test?
Higher yields do not hit every AI company the same way. The pressure travels through a chain:
- Discount rates rise, shrinking today’s value of profits expected years from now.
- Debt-service costs climb for companies that borrowed to build.
- Data centres need heavy upfront capital, much of it borrowed.
- Treasuries near 5% compete with expensive growth stocks for investor money.
- Credit stress spreads to cloud providers, project-finance vehicles and customers that depend on lending.
The scale makes the chain matter. Bloomberg expects the five largest US hyperscalers (giant cloud operators such as Microsoft and Amazon) to spend about $800 billion on AI capex in 2026. Capex, or capital expenditure, is money spent on long-lived assets like servers and buildings. Goldman Sachs estimates about $1.2 trillion for 2027, roughly 50%-54% higher and above a consensus near $1.1 trillion.
The scale of the build matters because capex absorbs operating cash flow at a rate PIMCO estimates near 93-94% for hyperscalers, leaving little room for buybacks, dividends or financial flexibility if returns disappoint.
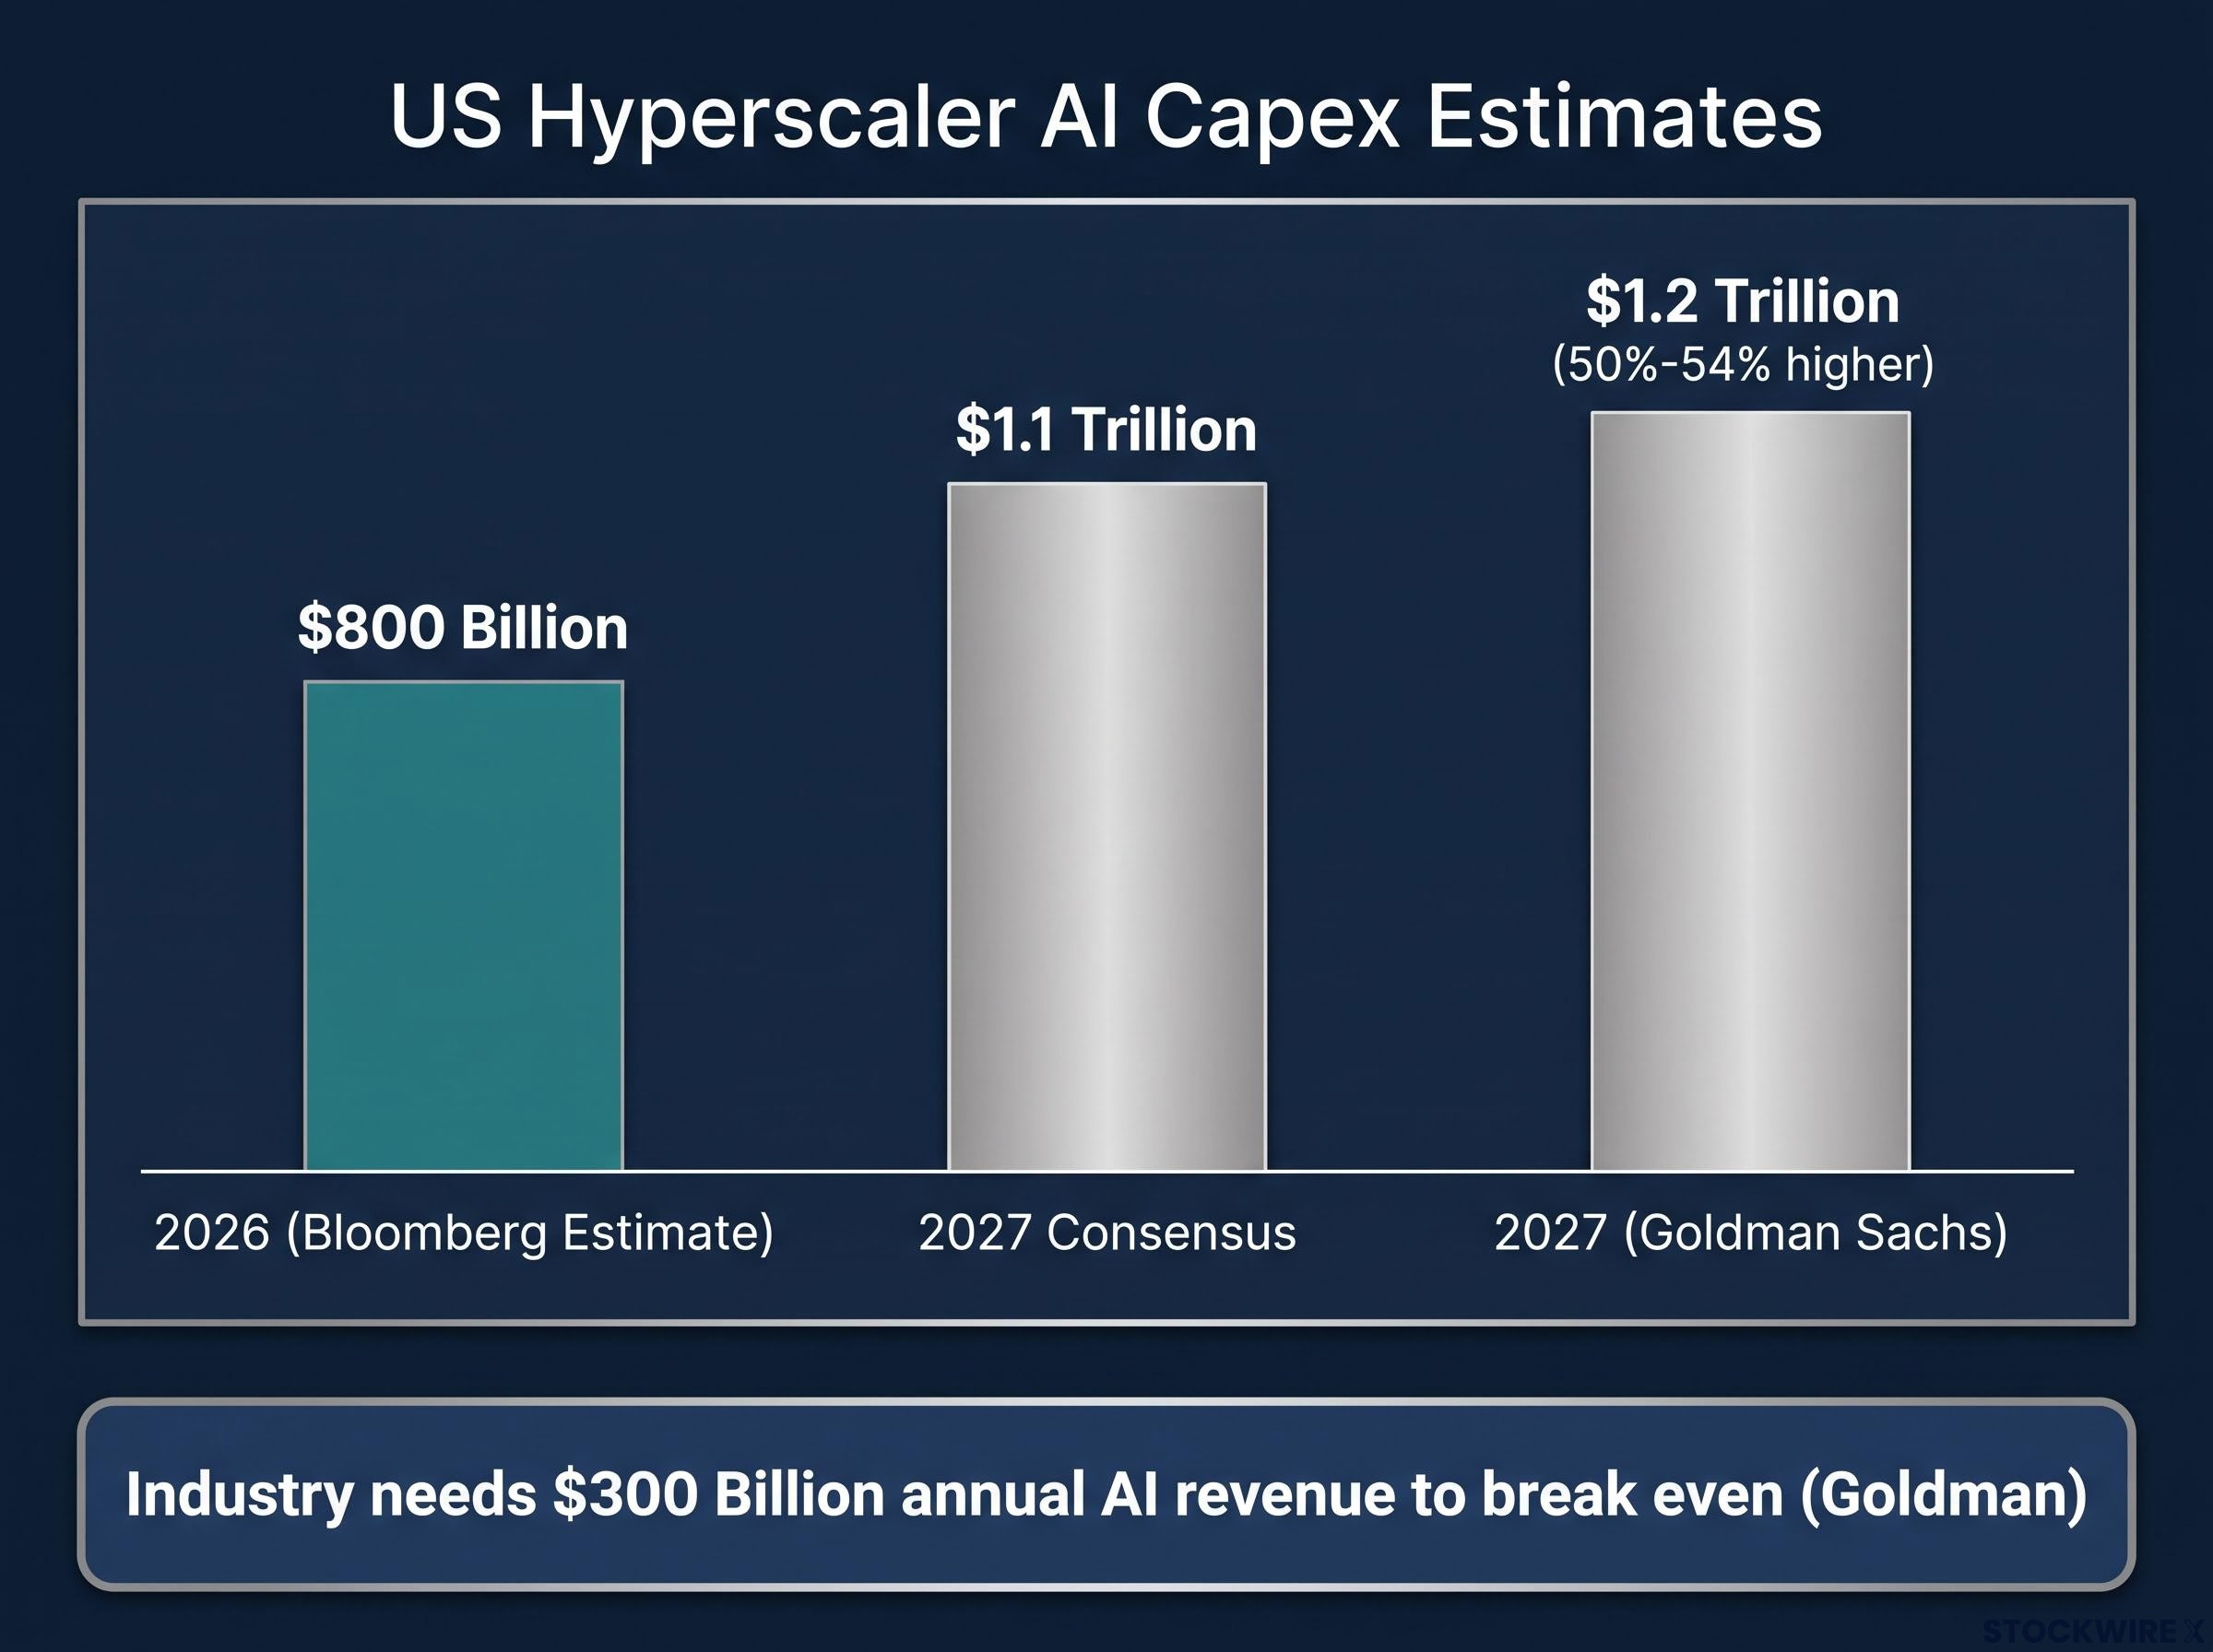
Reuters reported that the inflation shock lifted rate-hike expectations and deepened borrowing-cost worries across AI infrastructure.
CoreWeave as the stress gauge
CoreWeave, which listed in March 2025, is where the chain becomes visible. Its debt shows up as three different numbers, and they measure different things:
- About $35.6 billion: borrowed principal at 30 June, per its Q2 filing
- About $50 billion: a broader debt burden, per LSEG data cited by Reuters
- About $52 billion: total obligations including roughly $16.3 billion of operating leases, per Investors.com
Against that, CoreWeave reports about $103.7 billion of remaining performance obligations, meaning contracted revenue not yet earned. Some reporting, not independently confirmed, puts its bond yields around 15%-16% and credit-default-swap costs (the price of insuring its debt against default) near 1,000-1,200 basis points. Other unverified reports say Goldman-related analysis sees more than a third of 2027 Big Tech AI investment funded with debt, and that AI debt issuance fell from $113 billion in June to $23 billion in September.
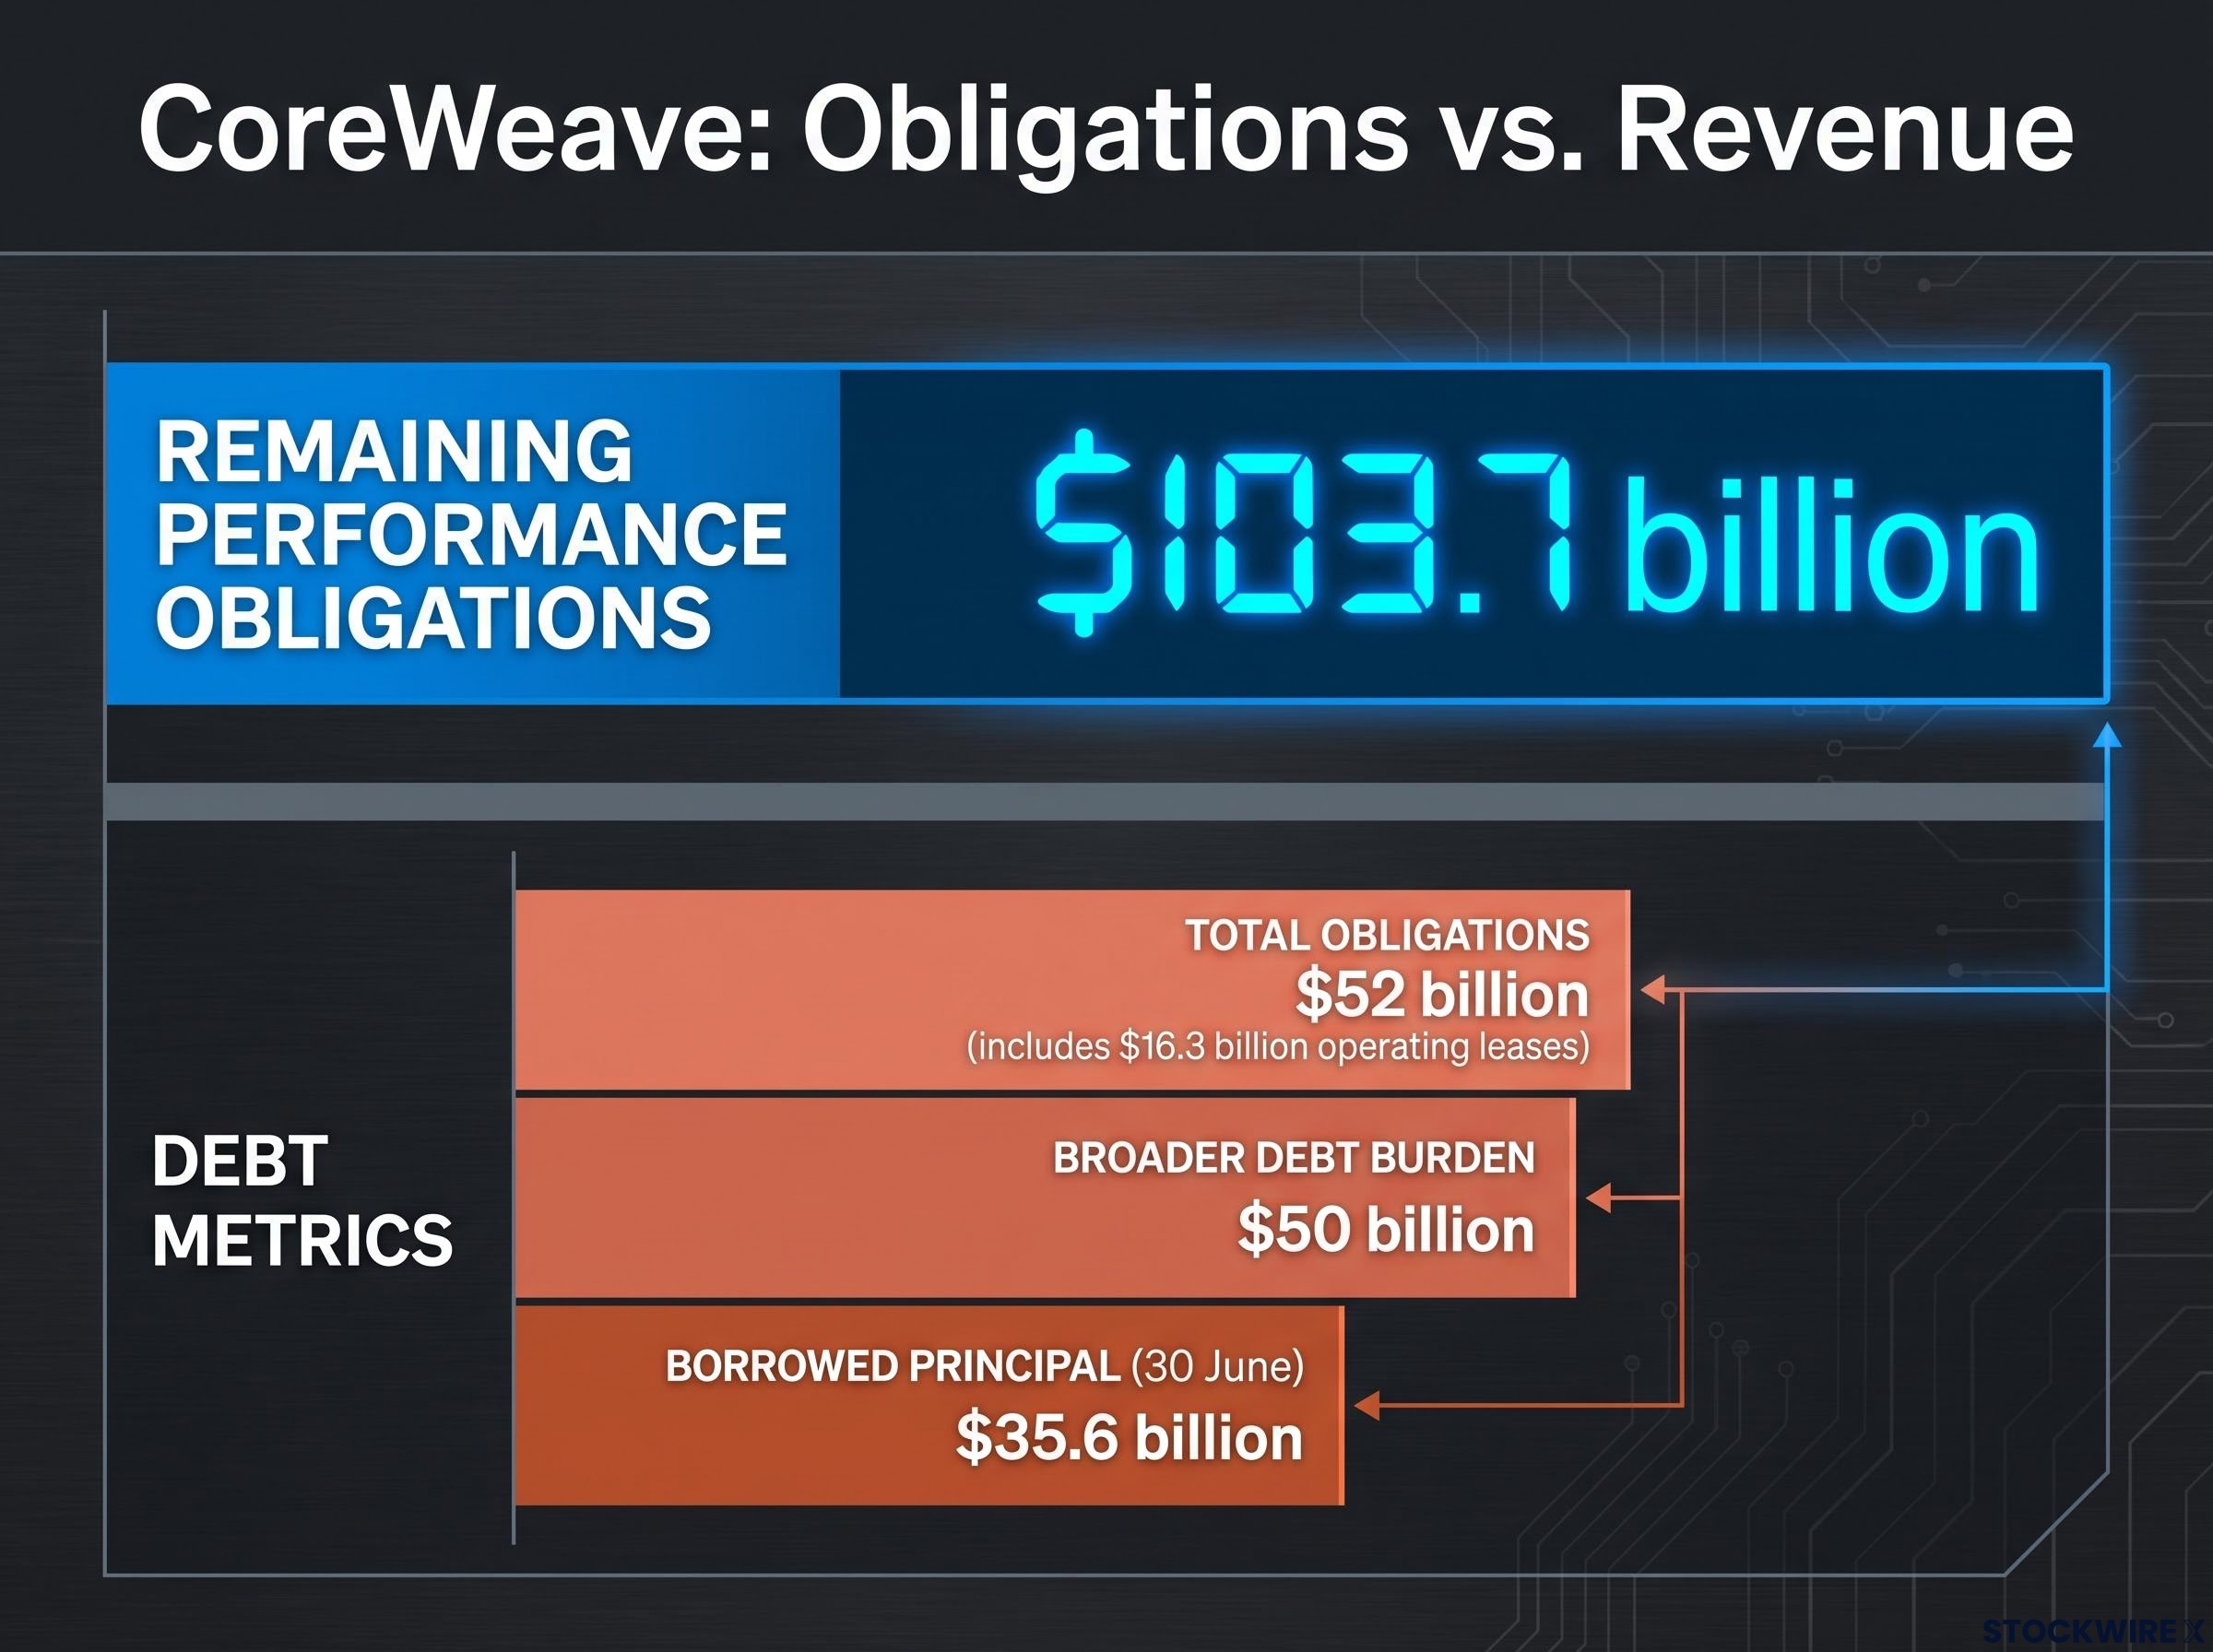
Microsoft, Alphabet, Amazon and Meta still fund much of their build from operating cash flow and keep investment-grade access. That leaves you holding two different risks under one AI label, and they respond very differently to a 5% yield.
Can AI spending earn its keep? What the major institutions disagree on
Why useful technology can still disappoint investors
A technology can be real while the money poured into it earns poor returns. Depreciation, the accounting charge that spreads an asset’s cost over its useful life, bites hard when chips age quickly. Circular financing, where firms act as one another’s investors and customers, can inflate demand signals. A capital cycle describes how booms attract so much supply and funding that returns sag near peak spending.
Goldman estimates the industry needs about $300 billion of annual AI revenue to break even, yet stays constructive on the cycle.
| Interpretation | Support | Caveat |
|---|---|---|
| Healthy correction | UBS GWM calls AI a transformation, not a bubble | Corrections can be sharp if capex guidance disappoints |
| Bubble warning | Gartner’s reported $8.5 trillion revenue need through 2030 for a 12% return (unverified) | A financing bubble is not adoption failure |
| Structural boom | Deutsche Bank sees a structural boom (unverified) | It still flags debt and stock selection |
| Capital-cycle overshoot | Bank of America framing, per Fortune (unverified) | May prove temporary if demand catches up |
| Systemic financing risk | Reported IMF circularity warning (unverified) | State Street calls circularity normal in an installation phase (unverified) |
Allianz Research has reportedly warned that data-centre construction is outrunning power and grid investment, raising input costs. Chuck Carlson, CEO of Horizon Investment Services, argues that higher capital costs lift the return hurdle every project must clear.
The question that matters Kevin Shea of BNY Wealth framed the issue as whether hyperscaler profit growth can outpace capex growth.
What history does and does not tell us
The dot-com era built vital infrastructure that temporarily outran profitable demand. The 2022 rate shock compressed tech valuations as yields jumped. The difference now is that rate pressure coincides with a giant, partly debt-funded physical build, so interest expense and refinancing carry more weight.
That makes “bubble or not” the wrong question for you. The useful one is whether returns exceed depreciation and financing costs at today’s rates.
What to watch in this week’s reports: a scorecard for Meta, chips and the rest
Meta: the first return-hurdle test
Meta, worth about $1.8 trillion, reports first among the AI heavyweights and carries 2026 capex guidance of $130-145 billion, with no official 2027 figure. Estimates diverge, partly over how a legal charge is treated.
| Metric | Source | Figure |
|---|---|---|
| Q3 revenue | Pepperstone | $63.29B |
| Q3 revenue | MarketBeat | $63.34B |
| Adjusted EPS | Pepperstone | $6.85 |
| Adjusted EPS | MarketBeat | $6.58 |
| Adjusted EPS | Admiral Markets | $6.74-$6.77 |
A beat against one source may be a miss against another, so the headline number will settle little on its own.
Guidance often matters more than the headline print, and chip names that beat estimates and still fall, as Sandisk and Western Digital did in August, show how elevated expectations can turn a good quarter into a selloff.
Chips and the rest of the week
Lam Research and Texas Instruments report Wednesday. A UBS-related preview expects Lam near the top of guidance, at about $6.05 billion revenue and $2.48 adjusted EPS. No clearly identified Q3 consensus was found for Texas Instruments.
Tesla and SpaceX, which listed in June 2026 (Nasdaq: SPCX) and is valued above $1 trillion, will act as sentiment signals for the wider ecosystem. Netflix, Procter & Gamble and GE Aerospace round out the week. UBS GWM expects that a further solid run of results could help the equity market cope with somewhat higher interest rates.
Use this scorecard as each report lands:
- Capex discipline: spending tied to demand is reassuring; open-ended increases are a warning.
- Free cash flow: steady or rising is good; shrinking under heavier spending is not.
- Customer commitments: longer, larger contracts help; concentration in a few buyers hurts.
- Utilisation: busy capacity supports returns; idle capacity signals overbuild.
- Depreciation: charges growing slower than revenue are healthy; the reverse squeezes margins.
- Monetisation timing: clear revenue dates calm markets; vague timelines extend the wobble.
Weigh capex guidance and cash generation at least as heavily as revenue. The Fed’s 27-28 October decision follows as the next macro test.
What this earnings week can settle, and what it cannot
The selloff reads best as a financing-and-returns test, not proof that AI demand has disappeared. Results can rebuild confidence only if they show accelerating AI revenue, durable margins, disciplined capex and adequate cash generation.
The counterpoint is that AI megacaps defying rates have done so through earnings growth strong enough to compress their own multiples, which is why the profit outlook, not the yield alone, decides the next leg.
One week cannot answer the 2027 capex question, clear the credit backdrop or fix the Fed’s path. The 27-28 October meeting and December hike odds come next.
The practical step is sorting: which holdings fund their build from cash flow, and which depend on borrowing at rates above 5%. That split may matter more than any single print.
Past performance does not guarantee future results. Financial projections are subject to market conditions and various risk factors. These statements are speculative and subject to change based on market developments and company performance.
This article is for informational purposes only and should not be considered financial advice. Investors should conduct their own research and consult with financial professionals before making investment decisions.