
The 10-year Treasury yield closed at 5.09% on 16 October, after briefly touching about 5.34% earlier in the month, its highest level since 2002. Yet in September, as yields climbed roughly 40 basis points (a basis point is one-hundredth of a percentage point), both the S&P 500 and the Nasdaq finished higher. The assumption that rising bond yields drag down stock valuations did not hold that month.
Citi argues this is not a fluke. Its analysts say higher rates now bear more on expectations for economic growth than on the price investors pay for stocks. They point to AI-driven earnings and to lasting changes in who owns equities.
That claim deserves scrutiny. The evidence available as of mid-October 2026 supports it in some parts of the market and contradicts it in others.
Here is how far the decoupling really goes, where it breaks down, and what it means if you are deciding between stocks and bonds right now.
Is the link between yields and stock multiples really broken?
The yield backdrop alone would normally alarm equity investors. The 10-year yield has risen nearly 120 basis points in 2026, according to Reuters, and recent readings show how high it has run:
- 7 October: about 5.34%, the highest since 2002 (Reuters)
- 8 October: 5.22% (official Treasury data)
- 16 October: 5.09% (official Treasury data)
Citi’s reading of that move is direct.
Citi’s central claim Higher rates now likely bear more on economic-growth expectations than on stock-market valuations, as AI fundamentals and shifts in equity ownership erode the usual bond-yield relationship.
Where the decoupling shows up
The resilience sits in growth stocks and AI-linked mega-caps, and the earnings explain why. BlackRock data shows AI-infrastructure earnings grew 54% year over year in Q2 2026, against 14% for the rest of the S&P 500. Morgan Stanley expects hyperscaler capital spending of roughly US$800 billion in 2026 and US$1.16 trillion in 2027.
Hyperscaler capital spending of this scale is increasingly debt-funded, with free cash flow across major AI-exposed firms forecast to swing from positive to negative, which tests how long the earnings story can offset higher discount rates.
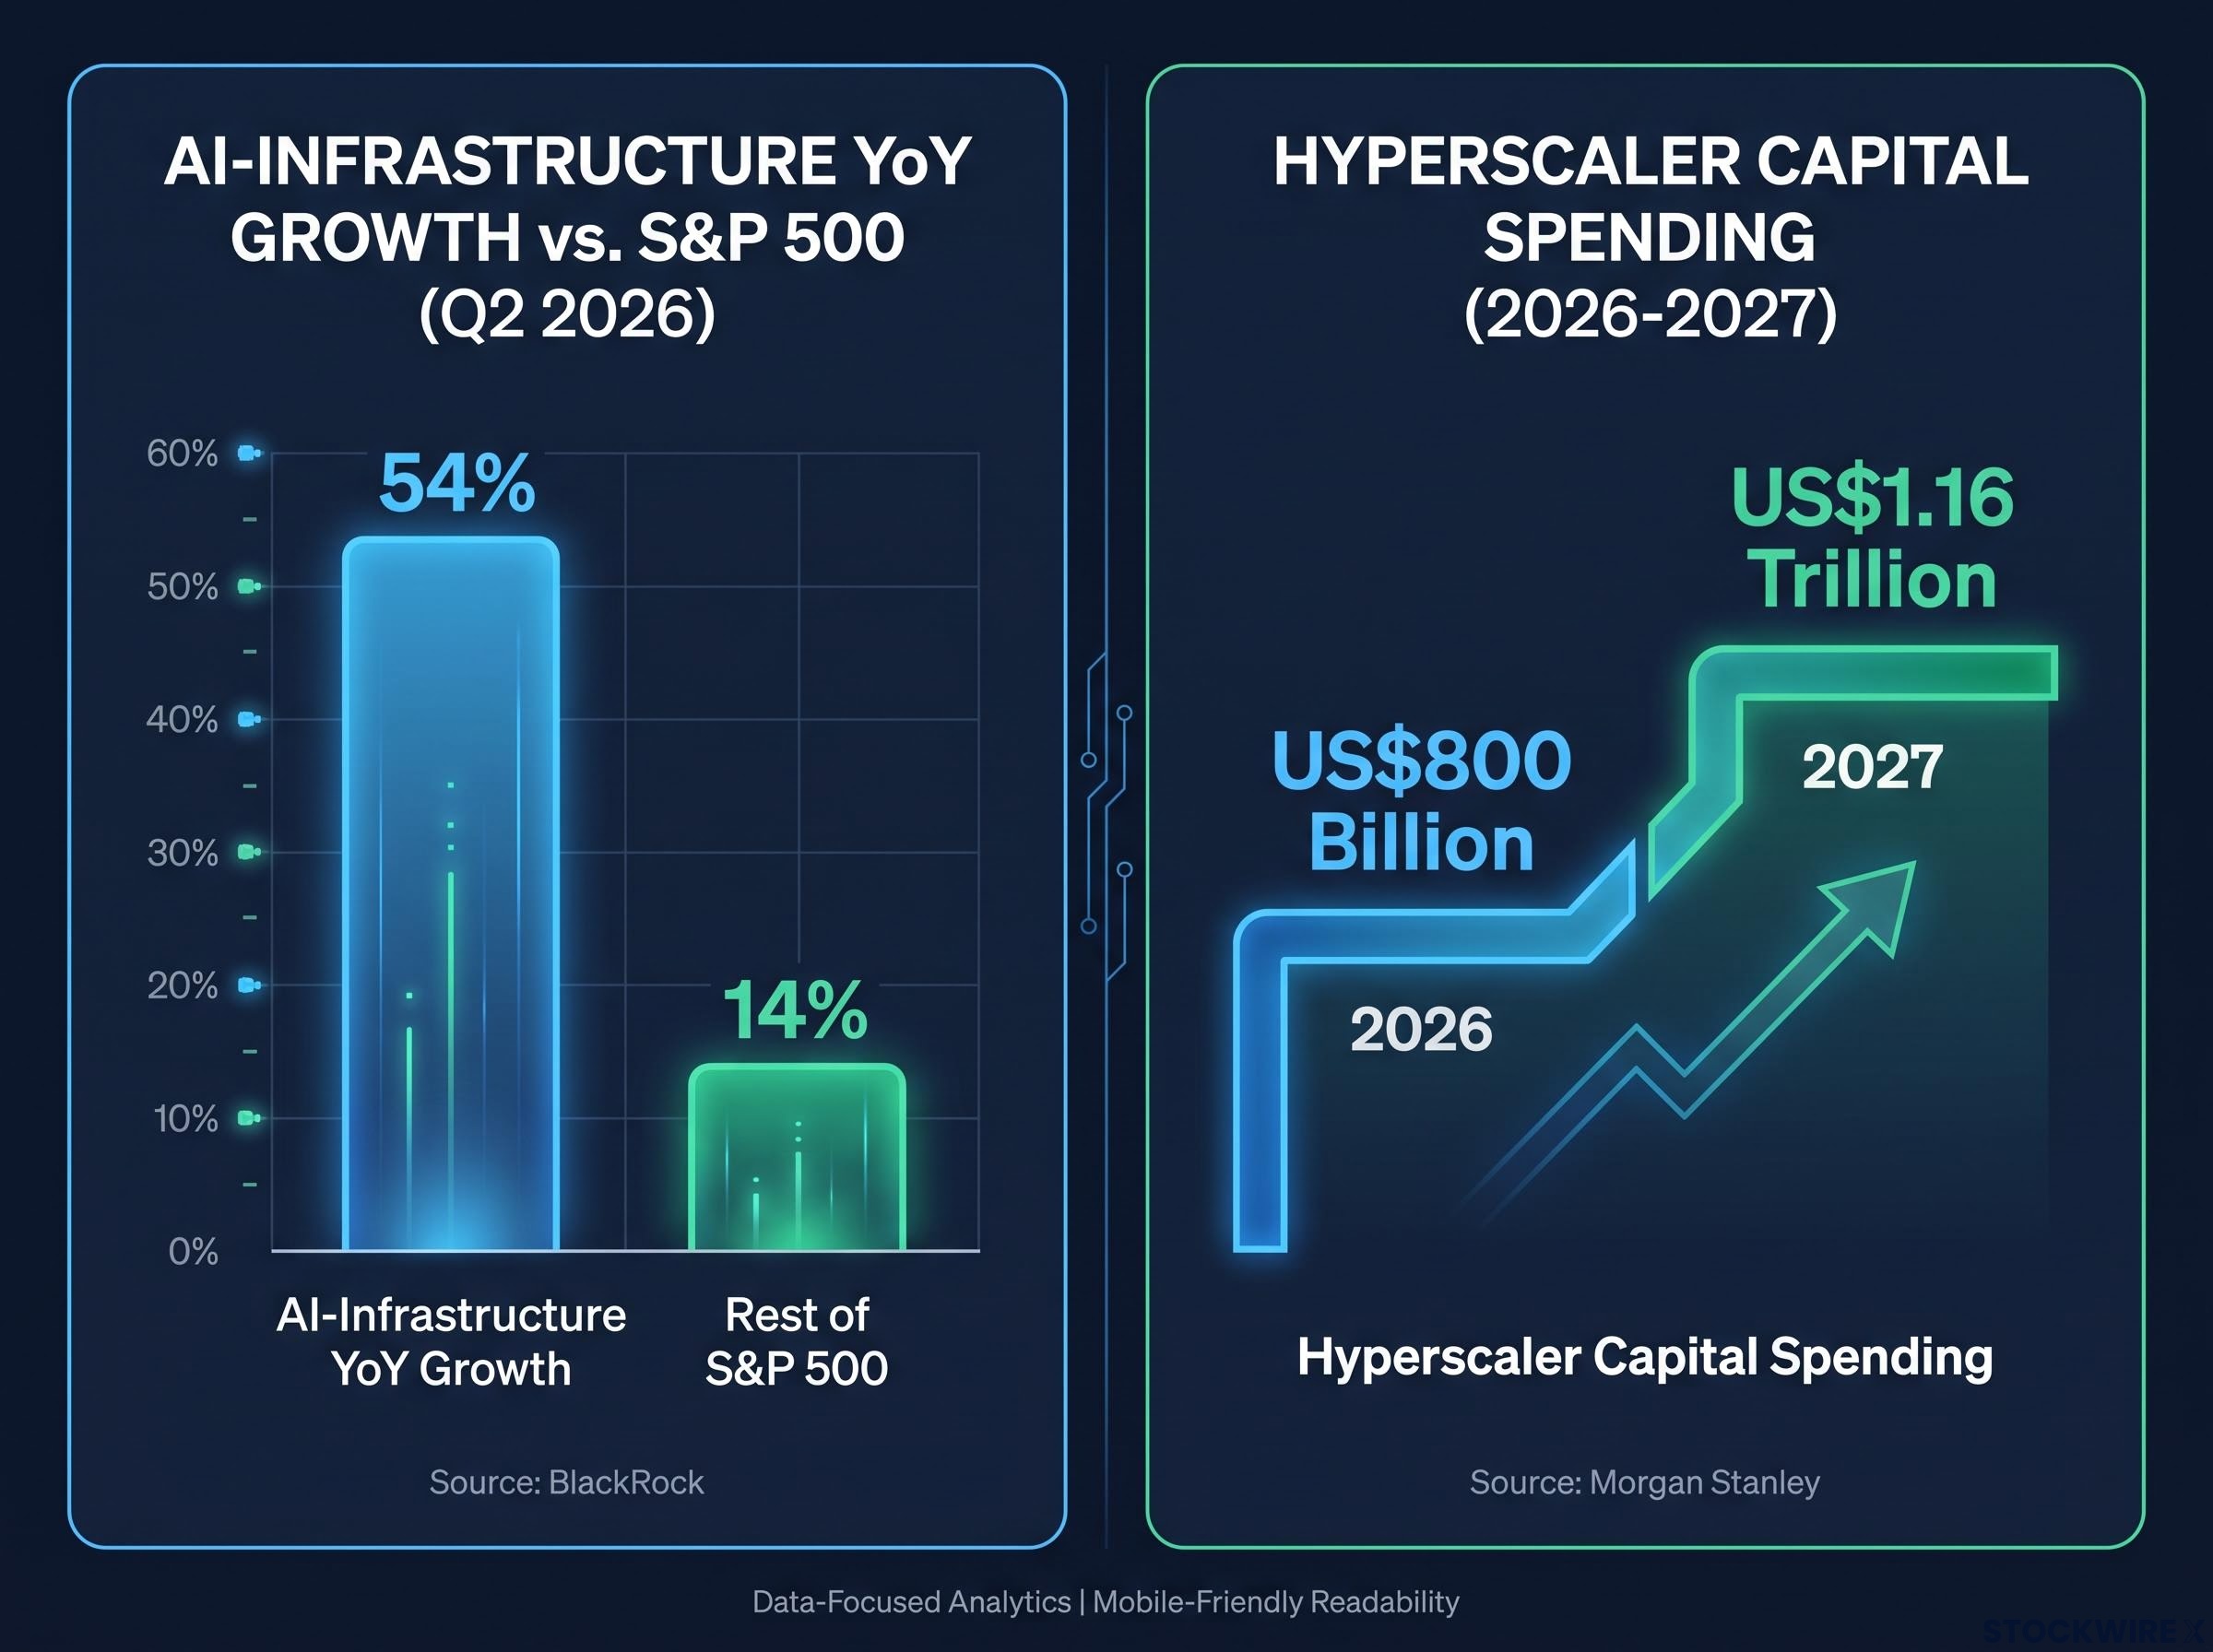
When profits grow that fast, a higher discount rate matters less. BlackRock says equities have absorbed higher yields far better than in 2022, when stocks and bonds fell together as inflation and rate expectations surged.
Where traditional rate sensitivity still holds
Outside that group, the old rules are intact. Cyclical and defensive stocks have fallen since late August, moving exactly as rate-sensitive sectors usually do.
That changes the headline. If your portfolio leans towards AI-linked growth, it has tolerated higher yields so far; if you hold cyclicals or defensives, the traditional rate sensitivity still applies to you.
When big ASX news breaks, our subscribers know first
Why Citi says the old stocks-versus-bonds trade-off has weakened
To judge Citi’s claim, it helps to understand what it says has weakened.
The traditional link in one paragraph
A stock’s value rests on the profits it is expected to earn in future, converted into today’s money using a discount rate. The discount rate is the return investors require to justify waiting for those profits. When the risk-free yield on government bonds rises, that required return rises with it, so future profits are worth less today. Higher yields also give you a competing option: a guaranteed return from a Treasury bond. Both forces normally push down the price-to-earnings (P/E) multiple, which measures how many dollars investors pay for each dollar of company earnings.
That logic assumes someone is actively weighing stocks against bonds. Citi’s argument is that fewer of the buyers now do.
Three shifts in who owns equities
Citi identifies three structural changes:
- Pensions moving from defined benefit to defined contribution: money flows into individual retirement accounts on a schedule, not through a manager rebalancing on yield.
- Equity-heavy target-date funds for younger investors: these funds hold a fixed, high stock allocation for savers far from retirement, regardless of bond yields.
- Growing foreign ownership of U.S. stocks: overseas buyers may respond less to U.S. bond yields than domestic investors do.
The difference is behavioural. A traditional pension manager shifts money into bonds when yields look attractive. An automatic payroll contribution into a target-date fund keeps buying stocks whatever the 10-year pays.
Citi does not put numbers on these flows, and no current 2026 figures for defined-contribution assets, target-date assets or foreign holdings were available. These are mechanisms, not measured quantities.
Citi also asks where the next wave of equity demand will come from. If target-date allocations, foreign purchases or passive flows slow, investors may demand a larger equity risk premium, the extra return they require for owning stocks over bonds.
Citi’s warning about demand fading maps onto the equity risk premium, the margin of safety that has compressed to roughly 2.1% by JPMorgan’s measure, leaving stocks more exposed if real yields keep climbing.
If your retirement contributions flow automatically into equity-heavy funds, you are part of the structural bid Citi describes. That bid is not unlimited.
Is the S&P 500 expensive? It depends on which multiple you use
Citi’s own valuation model gives a clear answer. It starts from the 10-year Treasury yield, layers on macroeconomic adjustments, and produces a fair-value range for the S&P 500.
Citi’s valuation check Fair-value range: 17.1-22.1x earnings. Reported S&P 500 multiple: 22.4x. The index sits above the top of the range.
Analysts read that gap as a sign of stretched sentiment and complacent positioning. The irony is plain: even as Citi argues the rate link has weakened, its own rate-anchored model still flags valuation risk.
Other data providers paint a less uniform picture.
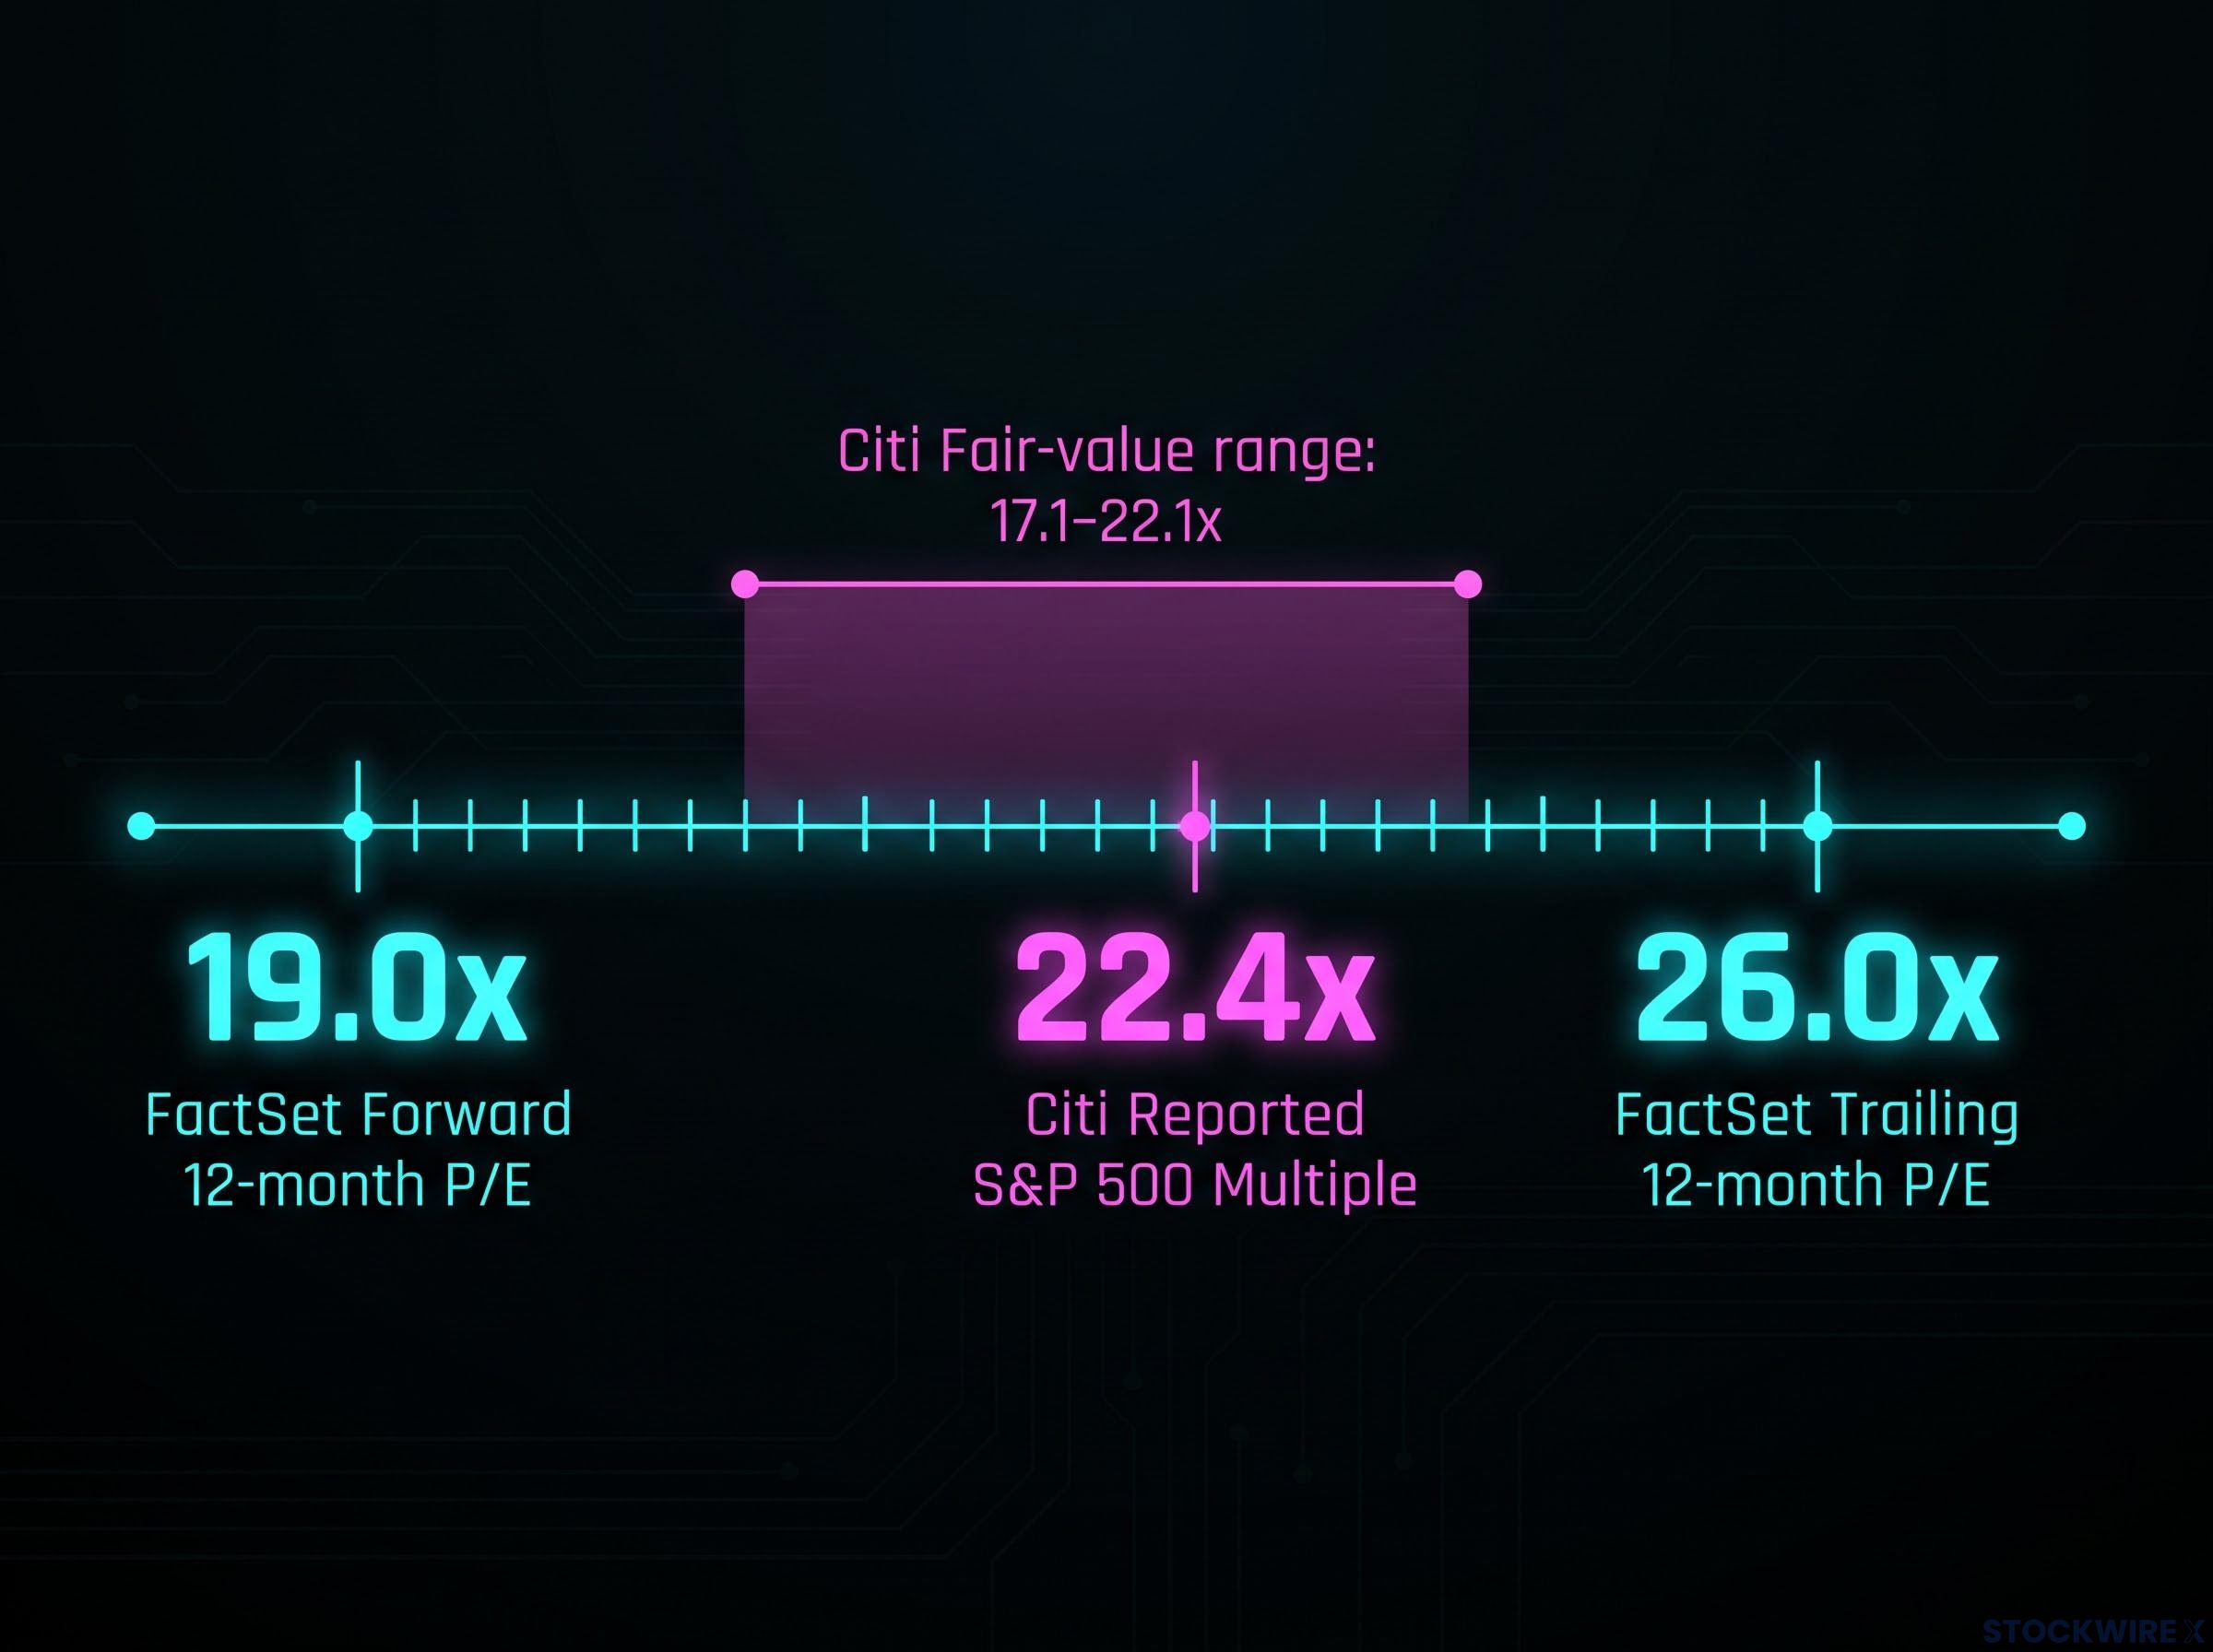
| Source | Measure | Multiple | Reference average |
|---|---|---|---|
| Citi | Reported multiple vs model | 22.4x | Fair value 17.1-22.1x |
| FactSet | Forward 12-month P/E | 19.0x | 5-yr 19.8x; 10-yr 19.1x |
| FactSet | Trailing 12-month P/E | 26.0x | 5-yr 24.4x; 10-yr 23.6x |
| WSJ/Birinyi | Forward P/E | 19.25x | Not available |
| WSJ/Birinyi | Current P/E | 23.51x | Not available |
A separate market-data compilation puts the trailing multiple at 25.9x. The spread comes down to definitions. Forward P/E divides price by expected earnings over the next 12 months; trailing P/E uses the past 12 months of actual earnings. Results also shift depending on whether earnings are measured on an operating basis (excluding one-off items) or as reported.
On forward earnings, the index trades slightly below its five-year average. On trailing earnings, it looks well above historical norms. Exactly how Citi’s 22.4x reconciles with these figures remains unresolved in the available data.
The gap between trailing and forward readings is not unique; forward P/E and CAPE diverge even more sharply, with CAPE near 37-40x while forward multiples look only moderately elevated.
One comparison cuts through the noise. FactSet’s forward multiple implies an earnings yield of about 5.3%, barely above a Treasury yield near 5.1%. That narrow gap tells you stocks are offering little extra compensation over bonds.
Before acting on any “the market is expensive” claim, check whether it uses trailing or forward earnings. The same index can look fairly priced or stretched depending on that one choice.
What happens if yields are rising because of bond supply, not a hot economy?
Citi’s other argument is that mixed economic data suggests yields are climbing partly because of expected government debt issuance, not overheating growth. The fiscal numbers lend weight to that view.
The Congressional Budget Office (CBO) estimated the fiscal-2026 deficit at about US$2.0 trillion, US$218 billion above fiscal 2025. The Treasury reported US$1.992 trillion, with net interest costs of about US$1.05 trillion. In a higher-rate scenario, the CBO projected the 10-year yield, which closed at 5.2% on 1 October, averaging 5.8%.
The San Francisco Fed puts the 10-year term premium, the extra yield investors demand for locking money up long term, at 1.33 percentage points. That is up from 1.28 at the September Federal Reserve meeting and 1.07 a year earlier. This evidence supports a supply-driven story, though it does not prove issuance is the only cause.
Investors exploring why long-dated yields are rebuilding worldwide will find that term premium is rising in the US, Japan, the UK and Australia at once, driven by debt supply, quantitative tightening and weaker safe-haven demand.
What the institutions say
| Institution | Stance | Key reason |
|---|---|---|
| Citi | Rates matter more for growth than valuations | AI earnings, ownership shifts, debt supply |
| Goldman Sachs | Overweight global equities for 3 months; bonds over 12 months | Yield-driven de-rating improved near-term risk/reward |
| BlackRock | Constructive on equities; short-term over long-duration bonds | AI-led earnings; issuance and term-premium risk |
| J.P. Morgan | Year-end target 7,800, 2026 EPS US$350 (July) | Growth and AI capex, but concentration raises spike risk |
| Morgan Stanley | Speed of yield rise matters more than level | Volatility tightens financial conditions |
The divergence is telling. Goldman’s Christian Mueller-Glissmann still sees yields mattering, and Goldman expects 18% U.S. earnings growth in 2027, a cyclical argument rather than a claim that rates are irrelevant. Morgan Stanley’s Mike Wilson watches the pace of the move, while J.P. Morgan warned in August that heavy AI concentration makes the index behave like a long-duration asset, unusually exposed to a sharp yield spike.
That leaves two historical readings. The late-1990s technology boom shows productivity gains supporting high valuations for a time, then ending in a sharp reversal; 2022 shows what happens when earnings expectations crack alongside rising rates.
Three signals that would challenge the thesis
- Accelerating yield moves: a fast, volatile rise rather than an orderly climb.
- AI earnings shortfalls: results that fail to justify current expectations.
- Slowing structural equity demand: weaker target-date, foreign or passive inflows.
If you are weighing stocks against fixed income, the source of the yield rise matters as much as its level. A supply-driven rise may leave equities resilient only for as long as profits stay strong; the force holding stocks up and the financing costs pressing on them can each become the story.
Past performance does not guarantee future results. Forecasts and projections cited are subject to market conditions and various risk factors, and may change.
What the weaker link changes, and what it does not
The decoupling is real but partial. It is concentrated in AI-linked growth names, while cyclicals and defensives still trade on rate sensitivity, and Citi’s own model places the index above fair value.
The condition that matters is simple to state. Yields carry less weight for multiples only while earnings remain credible and the rate rise stays orderly. Break either condition and the old relationship can return quickly.
Three variables deserve your attention from here: the pace of yield changes rather than the level alone, whether AI companies keep delivering on earnings, and any sign that automatic and foreign equity inflows are slowing. Together, they will tell you whether the weaker link holds.
This article is for informational purposes only and should not be considered financial advice. Investors should conduct their own research and consult with financial professionals before making investment decisions.