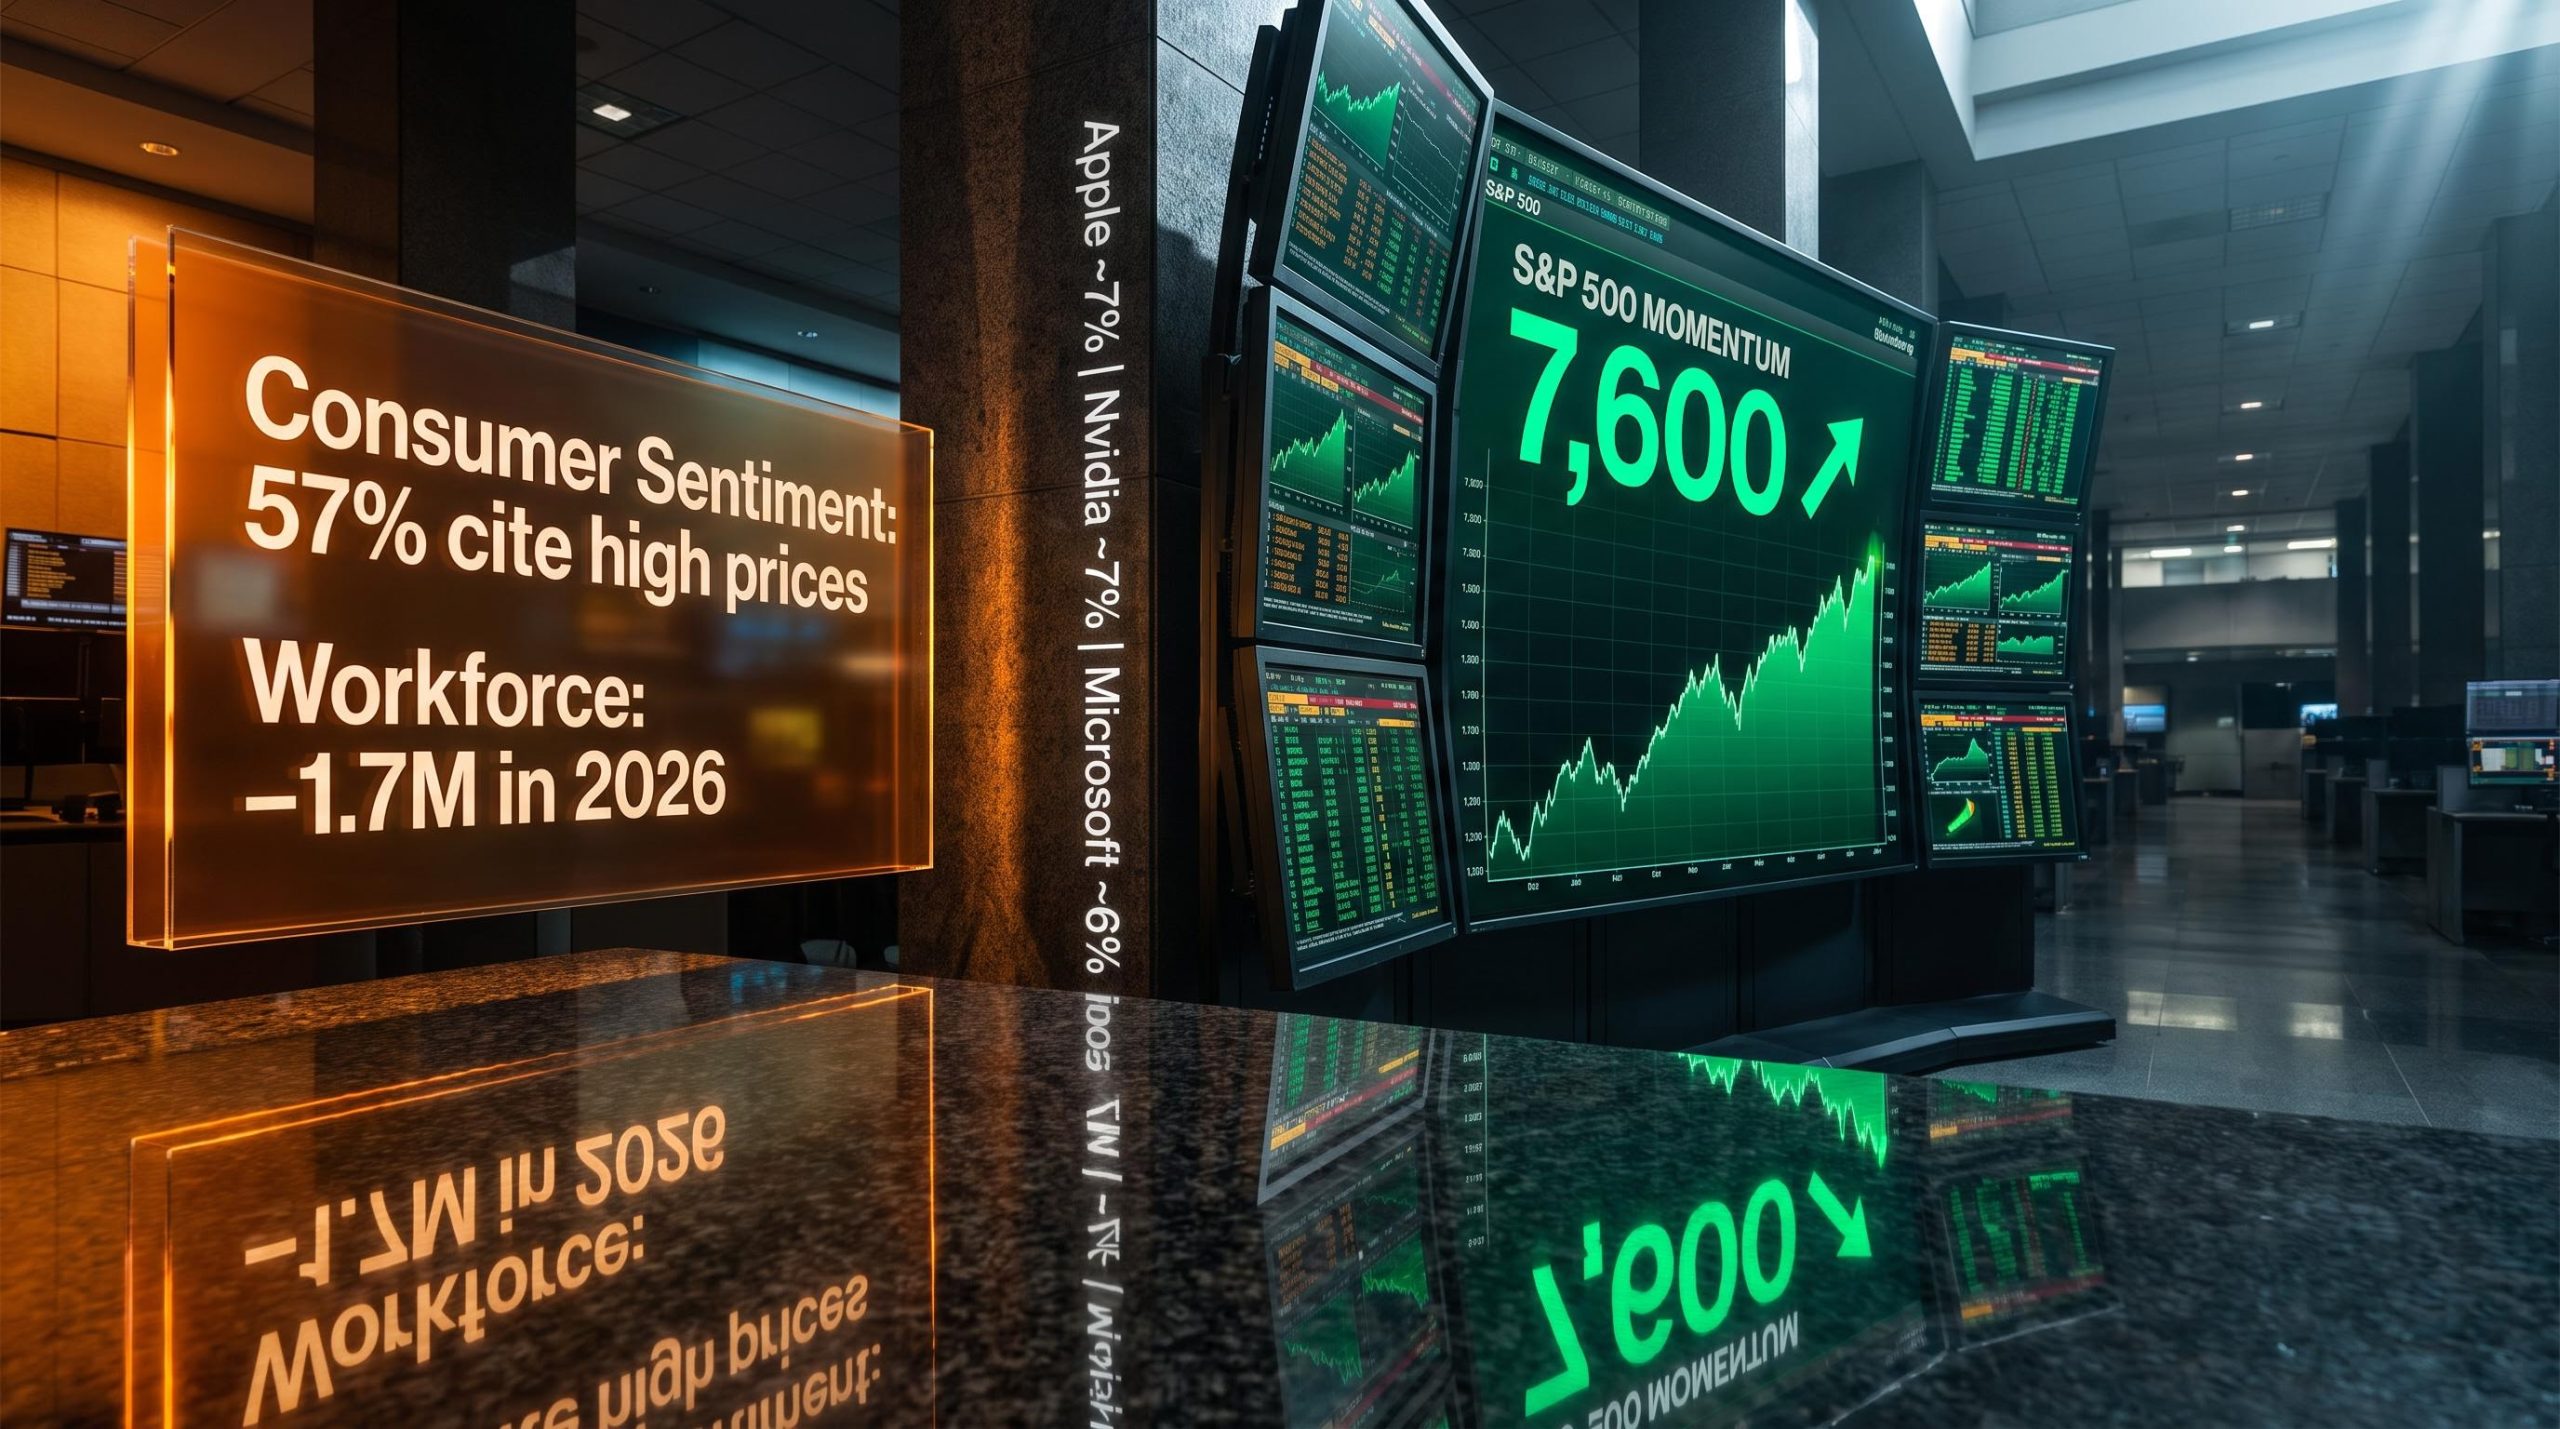
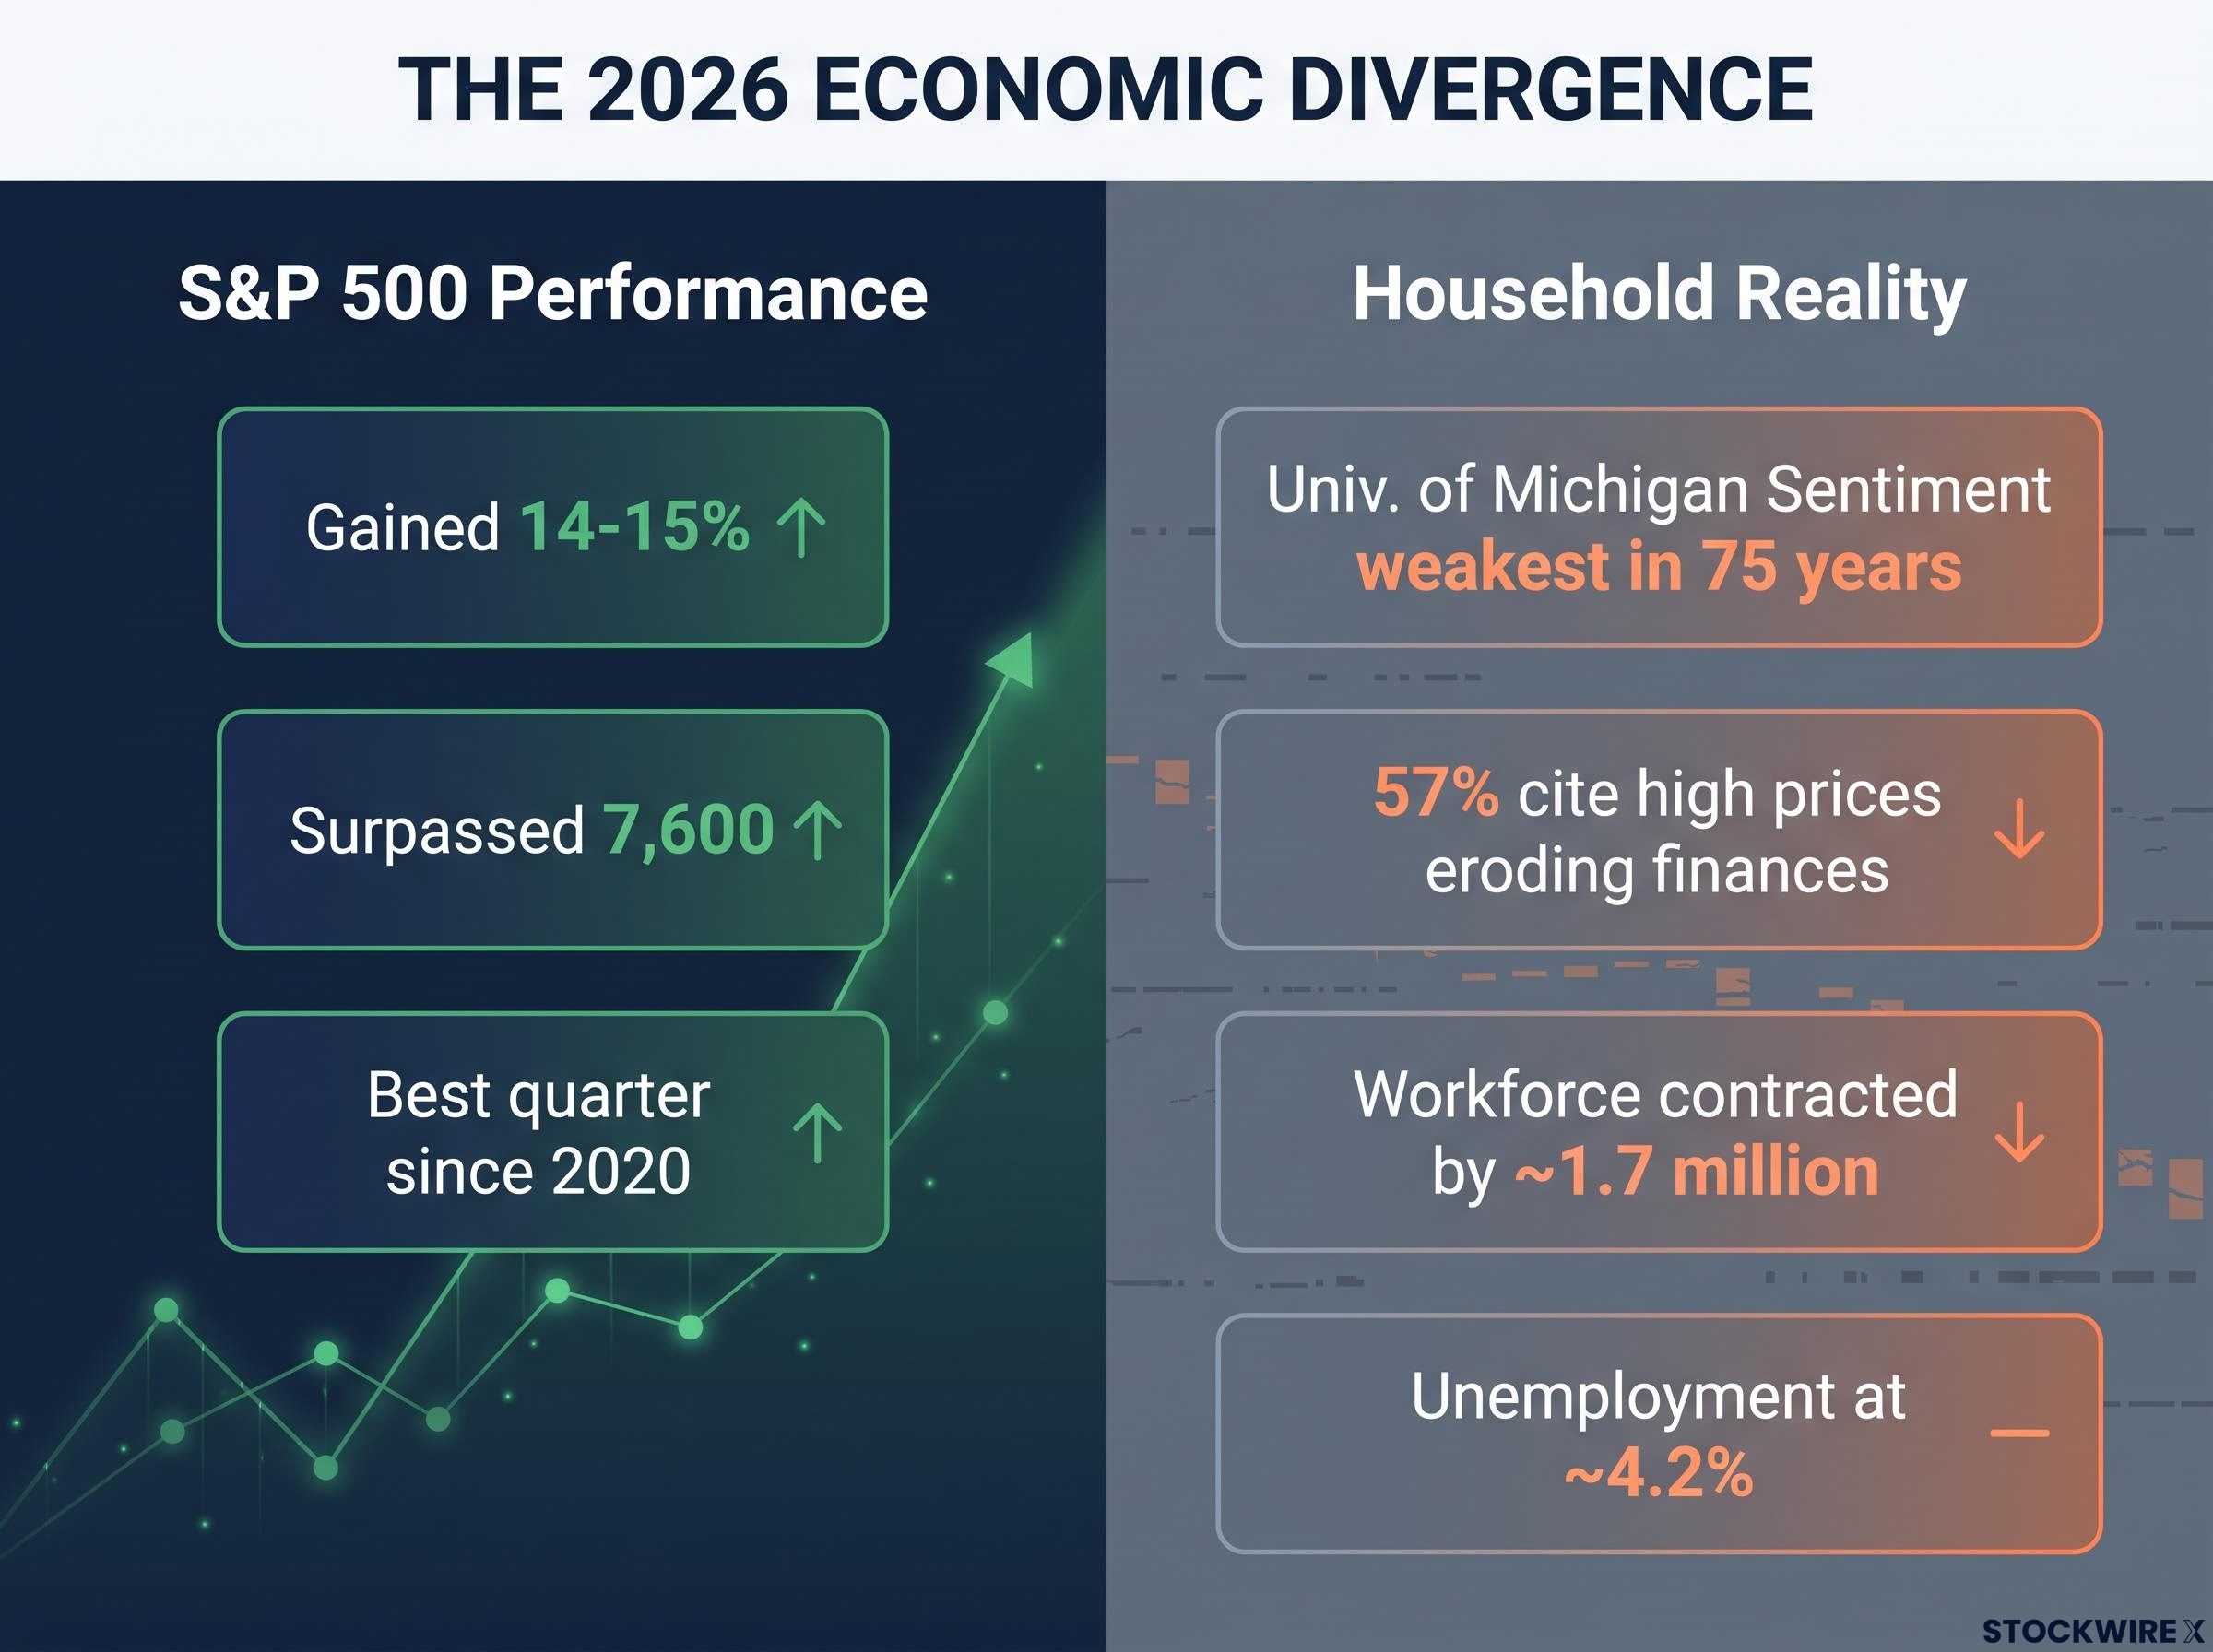
The S&P 500 just posted its best quarter since 2020, gaining roughly 14-15% and surpassing 7,600. In the same period, the University of Michigan Consumer Sentiment Index registered one of the weakest readings across its 75-year history, with 57% of survey participants pointing to persistently high prices as the primary cause of their worsening financial situation, up from 50% the month before.
That is not a timing lag. It is a structural mismatch between what the index measures and what the economy actually delivers to the people living in it. The S&P 500 in 2026 reflects anticipated earnings from a narrow cluster of AI-linked mega-caps. The economy, meanwhile, is shedding roughly 1.7 million workers from the labour force, watching credit-card delinquencies climb, and producing GDP growth of approximately 2.0-2.1% that leans heavily on a single capital expenditure theme.
Here is what the index number is actually measuring this year, what it is leaving out, and how to read market headlines without being misled by them.
The S&P 500 is not a report card on the American economy
Most people treat the S&P 500 as a scorecard for economic health. When it goes up, things are good. When it falls, something is wrong. That intuition is understandable, but the index was never designed to measure what most Americans actually experience.
The S&P 500 is a market-cap-weighted measure of the projected profits of 500 large listed companies, with market capitalisation referring to the total market value of a company’s outstanding shares. Because the heaviest-weighted names drive the index, a record high carries a precise meaning: investors expect the largest companies to generate greater earnings going forward. It says nothing about whether wages are rising faster than prices, whether ordinary people can afford housing, or whether jobs are easy to find.
The S&P 500’s market-cap weighting is one example of how index construction mechanics shape what a benchmark actually measures; the Dow Jones, by contrast, weights by share price rather than market capitalisation, meaning a single high-priced stock can move the index more than a company ten times its size.
The gap between those two realities is wide right now. Consumer expenditure makes up close to two-thirds of US economic output, yet that daily spending experience is essentially invisible in how the index is constructed. Unemployment sits at approximately 4.2%, but the workforce has contracted by roughly 1.7 million in 2026 and payroll growth is weakening. In the University of Michigan survey, 57% of participants said high prices were eroding their finances, an increase from 50% the previous month.
A record-high S&P 500 is fully compatible with genuine household financial stress. In 2026, those two things coexist.
- What the S&P 500 measures: corporate earnings projections, share price momentum, large-cap stock performance, investor expectations for future profits
- What broad economic health tracks: real wage growth, credit-card delinquency trends, housing affordability, labour force participation, consumer purchasing power
Understanding this distinction is the prerequisite for reading any market headline intelligently. Without it, you mistake a performance metric for a welfare metric.
When big ASX news breaks, our subscribers know first
How AI-linked mega-caps turned the index into a narrow bet
Look at the top of the S&P 500, and the concentration becomes difficult to ignore.
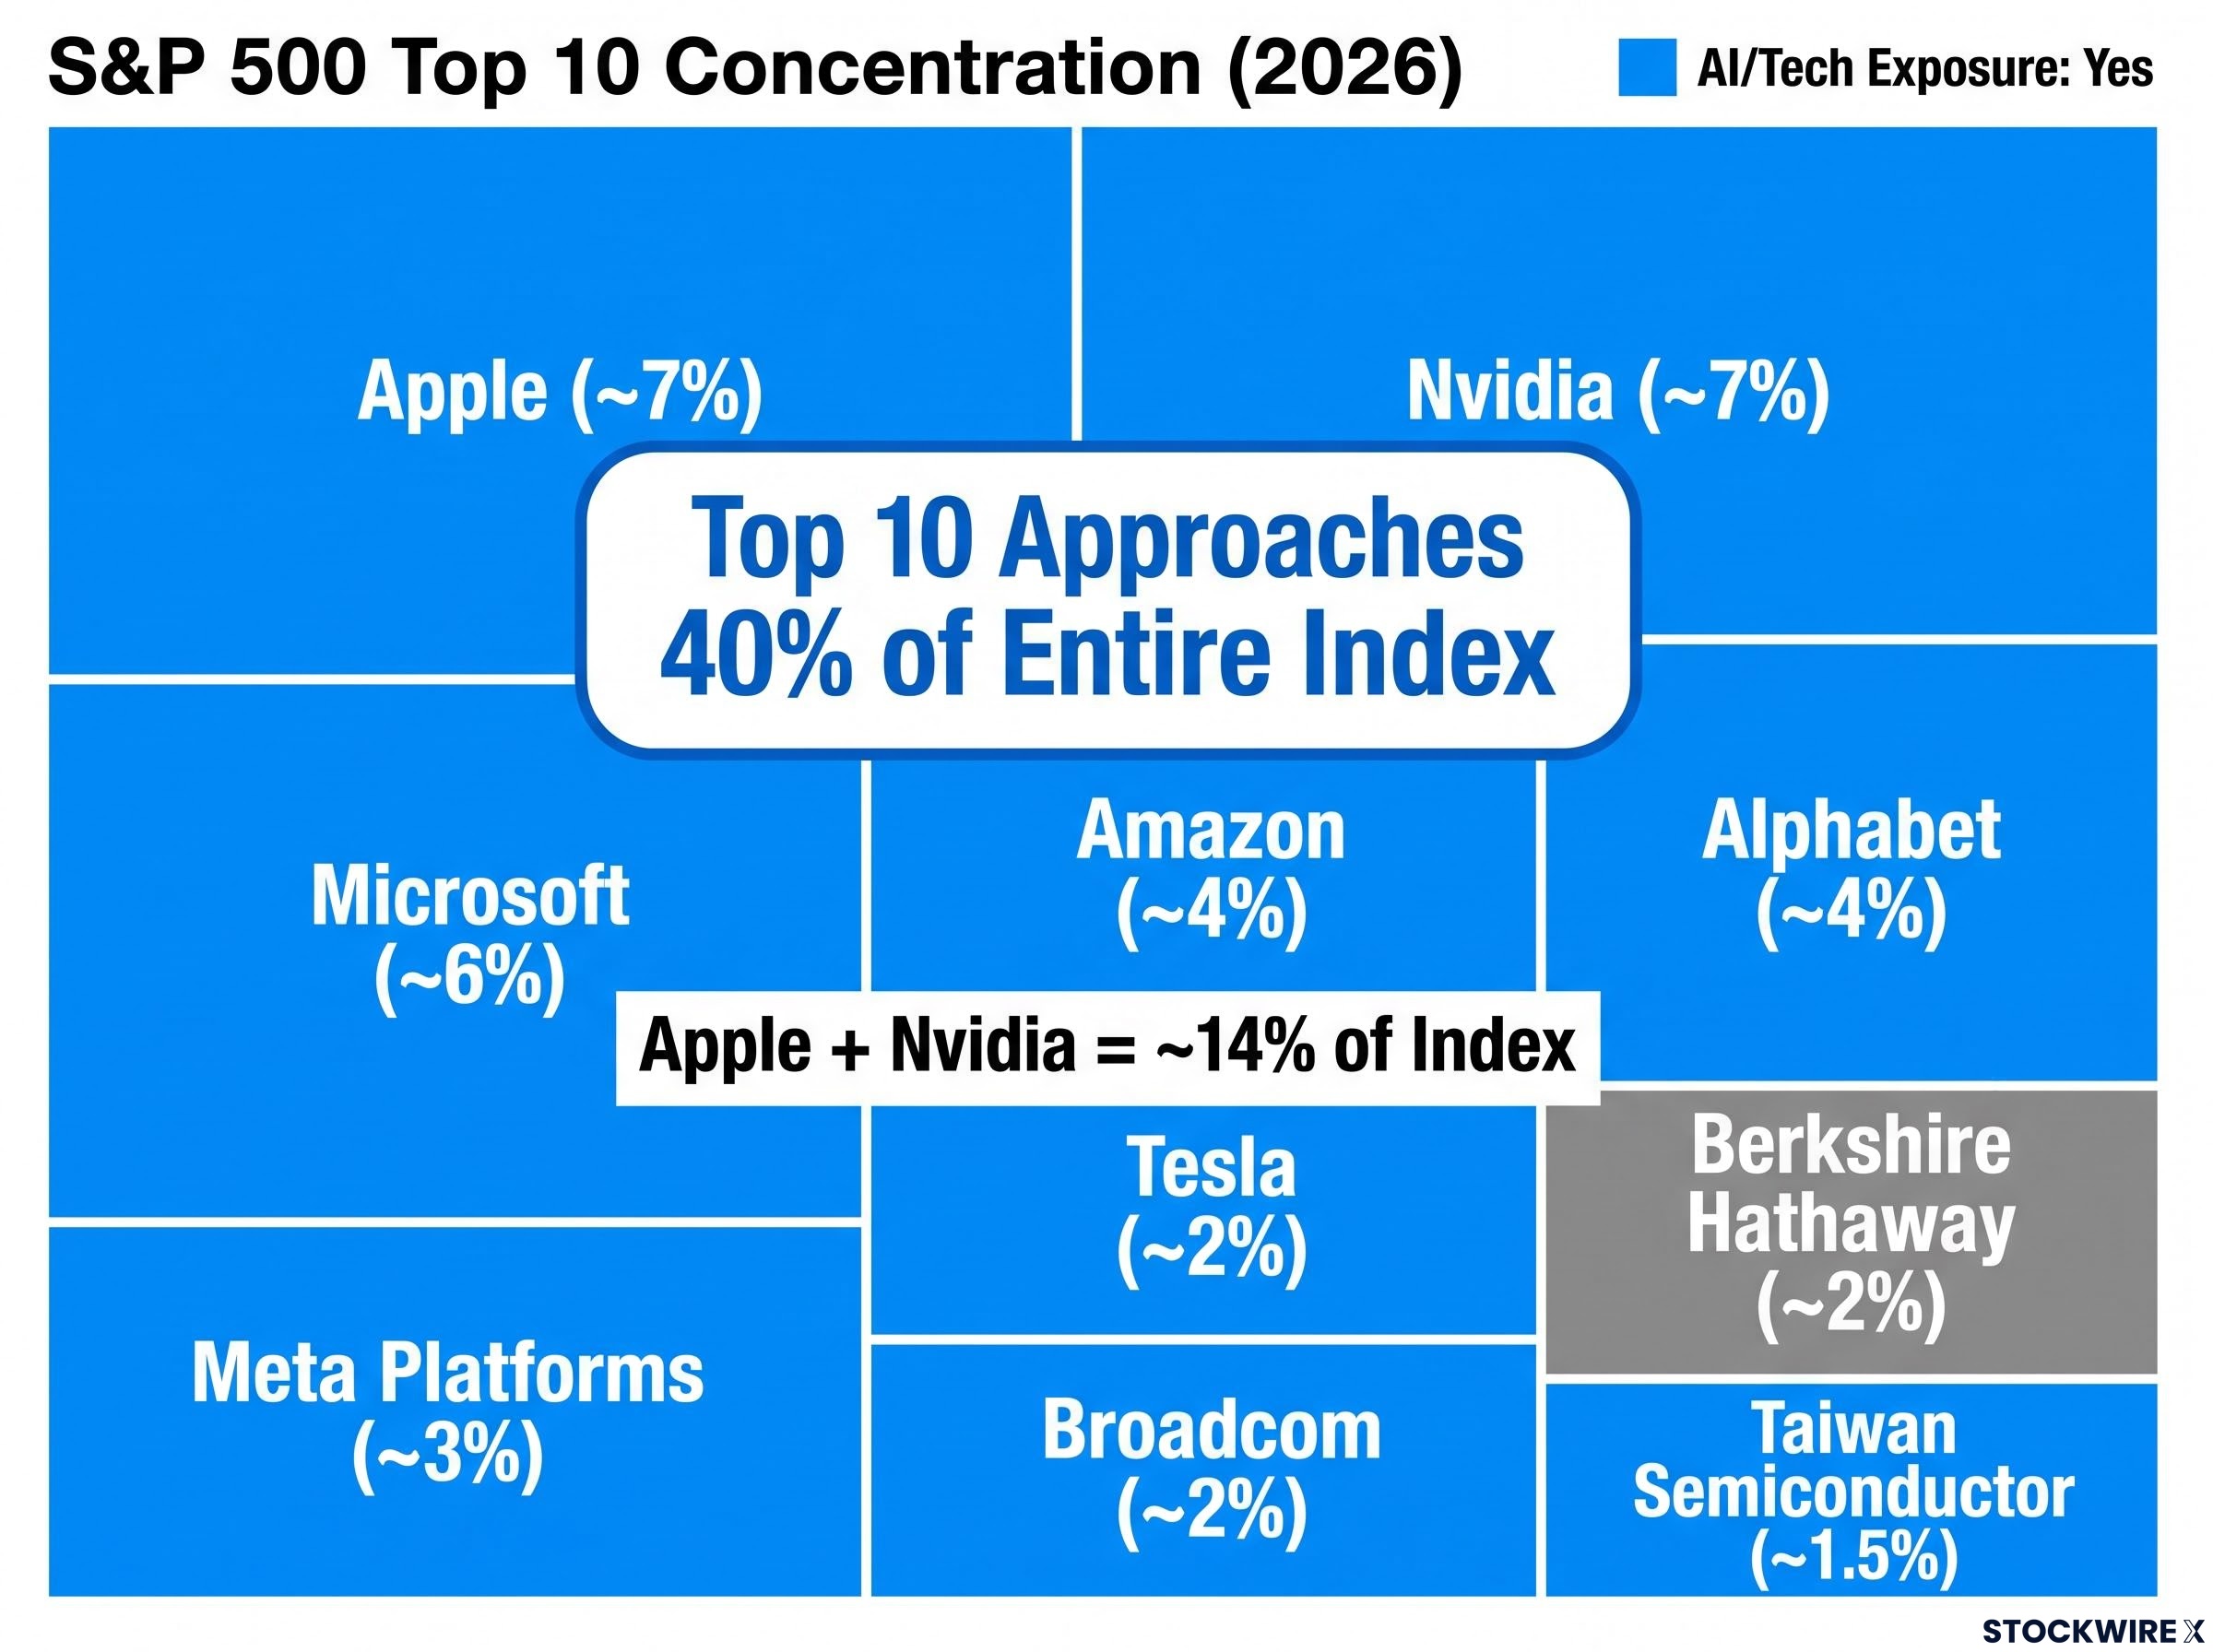
Each of Apple and Nvidia carries an index weight of roughly 7%, meaning just two companies together account for around 14% of the entire index. Of the top ten holdings, nine are directly linked to artificial intelligence or technology in some form, with Berkshire Hathaway standing as the only exception.
| Company | Approximate Index Weight | AI/Tech Exposure |
|---|---|---|
| Apple | ~7% | Yes |
| Nvidia | ~7% | Yes |
| Microsoft | ~6% | Yes |
| Amazon | ~4% | Yes |
| Alphabet | ~4% | Yes |
| Meta Platforms | ~3% | Yes |
| Tesla | ~2% | Yes |
| Broadcom | ~2% | Yes |
| Berkshire Hathaway | ~2% | No |
| Taiwan Semiconductor (ADR) | ~1.5% | Yes |
Together, these ten names account for well over one-third of the index, with their combined share approaching 40% by various estimates. At the height of the dot-com era in 2000, that same cohort of leading companies commanded a materially smaller portion of the index than they do today, according to historical S&P Dow Jones Indices data.
Morgan Stanley has noted that “equity price gains have stayed concentrated, with only a small group of large stocks and sectors, especially those tied to the AI buildout, driving most of the market’s recent advance.”
Some broadening of participation was observed in Q2 2026, with small caps and emerging markets joining the rally. That is a genuine development. But when two companies carry more index weight than the bottom 200 combined, a record-high headline number tells you about the health of those two companies, not the American corporate sector. If you hold a broad index fund, you are, in practice, making a concentrated bet on a small cluster of AI-linked names, and that changes how to think about diversification.
Passive index concentration has reached a level where the cap-weighted S&P 500 returned roughly double the equal-weighted version over a recent three-year period, but the entire performance gap was driven by valuation expansion in a handful of mega-caps rather than superior earnings growth across the index.
Why GDP growth in 2026 is a narrower story than it looks
The same concentration dynamic that distorts the index also distorts the economy’s headline number.
US GDP growth of approximately 2.0-2.1% has been widely cited as evidence of resilience, with the Federal Reserve’s own forecasts pointing to growth of around 2.2% across the full year. But analysts and research houses have estimated that AI-related capital expenditure has driven the substantial majority of that expansion, with independent modelling suggesting the residual growth rate would have been close to flat had that spending been excluded.
The Federal Reserve’s Summary of Economic Projections from June 2026 places the median FOMC participant forecast for real GDP growth at 2.2% for the full year, a figure that sits close to the widely cited 2.0-2.1% range and carries the weight of the central bank’s own modelling assumptions.
The scale of the spending makes this plausible. Major technology firms are together committing enormous sums to AI infrastructure, with aggregate AI-related capex across the sector reaching well above $800 billion in 2026. To put that figure in context, it comfortably surpasses the total annual economic output of Sweden.
The logical chain runs like this:
- AI capital expenditure lifts corporate investment as a GDP component, boosting the headline growth figure.
- This investment flows disproportionately to a small number of technology and semiconductor firms, concentrating the economic benefit.
- Those same firms drive the S&P 500, creating a feedback loop where market and economic headlines reinforce each other while masking underlying fragility.
When a single investment theme accounts for a substantial share of headline growth, the GDP number is as concentrated as the index. The question that follows is the same one: what does the number look like if that theme decelerates?
AI spending runs ahead of revenue, and history offers a warning
The AI capital expenditure boom is real. The question is whether revenue will catch up before the gap becomes unsustainable.
Multiple research houses have flagged that AI-related investment is currently running ahead of clearly measurable AI revenue. The spending is massive and visible; the returns remain, in many cases, speculative or early-stage.
Reuters has noted that investors are concerned about lofty valuations in the technology sector and continued massive spending on AI by technology companies.
This is not a new pattern. In the late 1990s, companies poured capital into fibre optic cables, server farms, and internet ventures at a pace that outstripped revenue realisation. The structural similarities between then and now are worth noting, not as predictions, but as a reference class for how investment cycles can behave:
- Massive infrastructure buildout ahead of proven commercial returns
- Narrow index leadership concentrated in the dominant technology theme
- Valuations driven in part by enthusiasm for the technology’s potential rather than its delivered earnings
- An abrupt correction when the gap between investment and revenue became unsustainable
The parallel is not destiny. AI may well generate the productivity gains and revenue that justify the capex. But the investment-revenue gap does mean the current trajectory requires companies to eventually demonstrate that the spending is generating proportionate returns. The timeline for that reckoning is shortening, not extending, and the dot-com era illustrates what happens when it arrives before the returns do.
For investors wanting to weigh the dot-com parallel more rigorously, our full explainer on the AI bubble debate examines Nvidia’s current forward P/E against Cisco’s dot-com peak multiple, alongside econometric bubble-detection research covering all seven Magnificent Seven stocks.
A layered risk picture concealed by a single headline number
Three distinct risk categories sit beneath the record-high headline, and conflating them produces a muddier picture than separating them clearly.
| Risk Category | Description | Key Indicator to Watch |
|---|---|---|
| Cyclical | GDP, corporate earnings, and high-income consumer spending all depend on the continuation of the AI capex cycle | Quarterly AI-related capital expenditure from major tech firms |
| Structural | The S&P 500 is more concentrated in a narrower group of names than at any prior point, including the dot-com peak | Top-ten index weight as a percentage of total market capitalisation |
| Household-level | Real purchasing power is weakening, consumer debt stress is rising, and the labour market is softer than the headline unemployment rate suggests | University of Michigan Consumer Sentiment and credit-card delinquency rates |
The cyclical risk is about what happens if AI spending decelerates. The structural risk is about what the index now measures regardless of whether AI spending holds up. The household-level risk is where the lived economy diverges most sharply from the headline.
Where household stress sits in the picture
Research from Morgan Stanley has pointed to deteriorating household balance sheets, citing climbing credit-card delinquencies, a rise in personal bankruptcies, and wage growth that has failed to keep pace with inflation. The workforce has contracted by approximately 1.7 million in 2026, payroll growth is weakening, and options markets are currently assigning a roughly 75% probability to at least one further Federal Reserve rate increase before December, a development that would tighten borrowing conditions further.
The Bureau of Labor Statistics Employment Situation report for June 2026 recorded a 0.3 percentage point decline in the labour force participation rate to 61.5%, providing the official measure behind the approximately 1.7 million workforce contraction cited across economic commentary this year.
If all three risks materialised simultaneously, the feedback loop would be severe: an AI capex deceleration would compress earnings and the index; a structurally concentrated index would amplify the move; and a consumer base already under financial stress would lack the spending cushion to soften the macroeconomic impact.
Naming these risks precisely is more useful than a generic warning. Each has a different trigger and a different implication for how you assess portfolio positioning and economic claims.
Reading the market without being misled by it
The S&P 500 at record highs in 2026 is a real data point. It reflects real earnings momentum in a narrow cluster of AI-linked companies. It is not fabricated.
But it is not a measure of broad economic health. Treating it as one produces systematically wrong conclusions about wages, jobs, purchasing power, and financial stability for most American households.
The next time you encounter a headline about the index hitting a new high, three questions will tell you more than the number itself:
- Who is driving this gain? Is it broad-based participation, or is a handful of mega-caps pulling the index while most of the 500 constituents tread water?
- What is the breadth of participation? Are small caps, mid caps, and non-tech sectors confirming the move, or is the rally narrow?
- What economic conditions does this number leave unmeasured? Consumer sentiment, real wage growth, credit stress, and labour force participation sit outside the index entirely.
One encouraging signal deserves honest acknowledgment: Q2 2026 did show some broadening, with small caps and emerging markets participating alongside mega-caps. That is worth watching. But it does not alter the concentration picture at the top, where the ten largest names still command an unprecedented share of the index.
Until the AI capex cycle broadens into measurable, distributed economic gains, the gap between what the headline measures and what the economy delivers will continue to widen. That broadening has not yet happened.
Investors wanting a practical framework for acting on these concentration dynamics will find our dedicated guide to managing AI concentration risk, which covers a five-strategy approach including position-sizing discipline and a quarterly rebalance trigger designed for portfolios exposed to the AI investment stack.
This article is for informational purposes only and should not be considered financial advice. Investors should conduct their own research and consult with financial professionals before making investment decisions. Past performance does not guarantee future results. Financial projections are subject to market conditions and various risk factors.