Two stocks from completely different industries, one building rockets and the other building electric cars, have moved in near-lockstep since SpaceX went public in June 2026. There is no business relationship between them. The reason they track each other is that the same man runs both.
Since SPCX began trading roughly three months ago, a percentage-change comparison of SPCX and TSLA shows something genuinely odd: the two names have tracked each other with unusual fidelity, and the only real divergence came in the first few days after the IPO. For anyone holding both stocks believing they own two separate sector bets, that pattern is a direct challenge to the assumption.
This piece maps the co-movement, explains why it exists, quantifies what it means for portfolio risk, and examines whether the current technical divergence signals a genuine break or a temporary separation. By the time you finish, you should see “Musk risk” for what it is: a single concentrated factor, not two independent ones.
A chart that should not exist: SPCX and TSLA moving as one
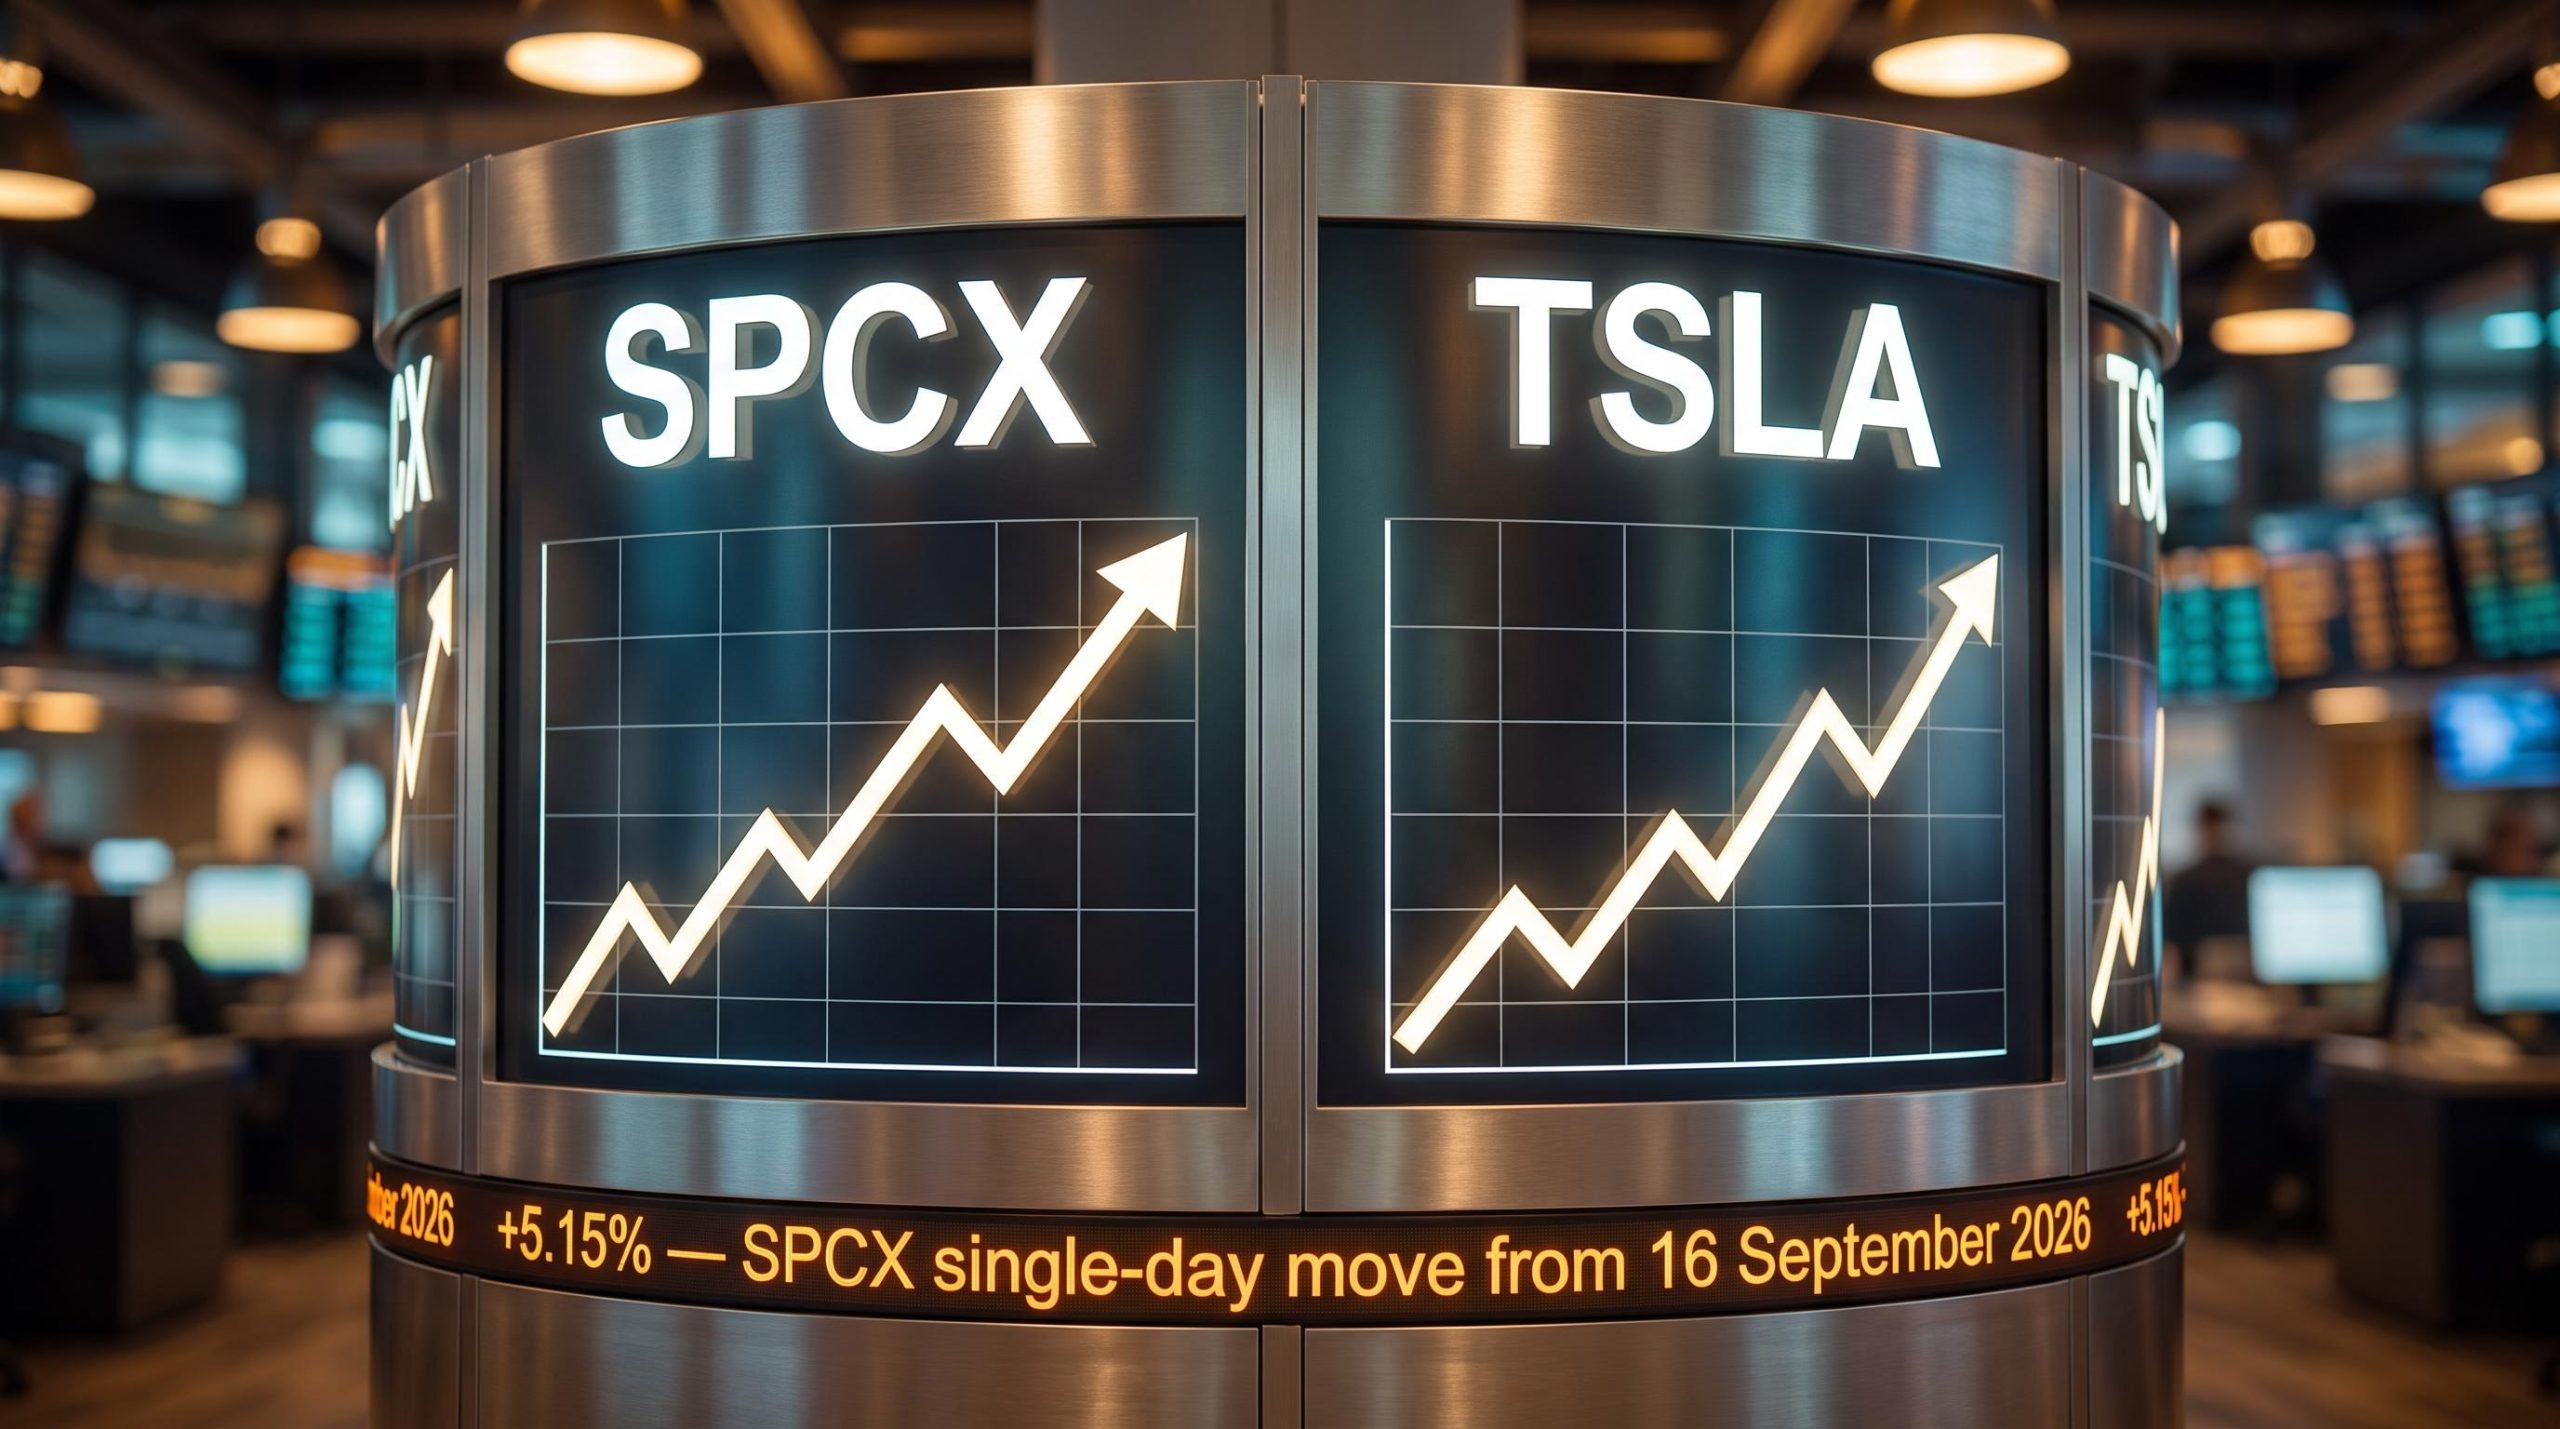
Put a percentage-change chart of SPCX and TSLA side by side and the first reaction is disbelief. Since SpaceX’s IPO in June 2026, the two lines have moved almost as one, according to comparative chart analysis from Tim Knight, with the two names diverging only in the first few days of public trading before falling back into step.
The SpaceX IPO debut itself offers a telling early data point: Tesla shares fell more than 5% on IPO pricing day as investors rotated capital into SPCX, a move that illustrated the Musk founder premium creating direct cross-asset pressure well before the co-movement pattern had time to establish itself.
That should not happen. SpaceX is an aerospace business built on government launch contracts and the economics of putting payloads into orbit. Tesla sells electric vehicles and energy storage into consumer pricing cycles. No shared revenue, no shared customers, no shared competitive market.
The price data from mid-September shows both the volatility of a young listing and the range it has settled into. SPCX clustered between roughly $148 and $155 across 14-17 September 2026.
| Outlet | Date | Price | Change | Notes |
|---|---|---|---|---|
| MarketWatch | 14 Sep 2026 | $148.65 | +0.34% | Quiet session |
| Barron’s | 15 Sep 2026 | $148.15 | -2.02% | Pulled back |
| CNBC | 16 Sep 2026 | $150.88 | +5.15% | After-hours $153.82 |
| Morningstar | 16 Sep 2026 | $154.80 | +2.60% | Prior close $150.88 |
| Robinhood | 17 Sep 2026 | $154.92 | Range $152.63-$156.87 | Intraday spread |
On 16 September 2026, CNBC recorded SPCX at $150.88, up $7.39 or 5.15% on the day, with an after-hours quote of $153.82. Real moves, real money.
Here is the complication. No one has actually confirmed the correlation with numbers. An Investing.com analysis published on 8 September 2026 looked at the parallel moves and stopped short of endorsing them.
“Pairs-trade verdict: not confirmed. The recent move is directionally similar, but the available series does not establish a reliable correlation coefficient or cointegrating relationship.”
No published correlation coefficient exists for SPCX-TSLA. The post-IPO series is only about three months old. So the co-movement is not irrelevant to you as an investor, but it is not yet mathematically provable either. You are watching a pattern that may be structurally real while remaining statistically unconfirmed, and that uncertainty is itself part of the risk. The single fact that resolves the visual puzzle, if not the statistics, is Elon Musk.
When big ASX news breaks, our subscribers know first
Why two unrelated companies move like one: the mechanics of founder-linked trading
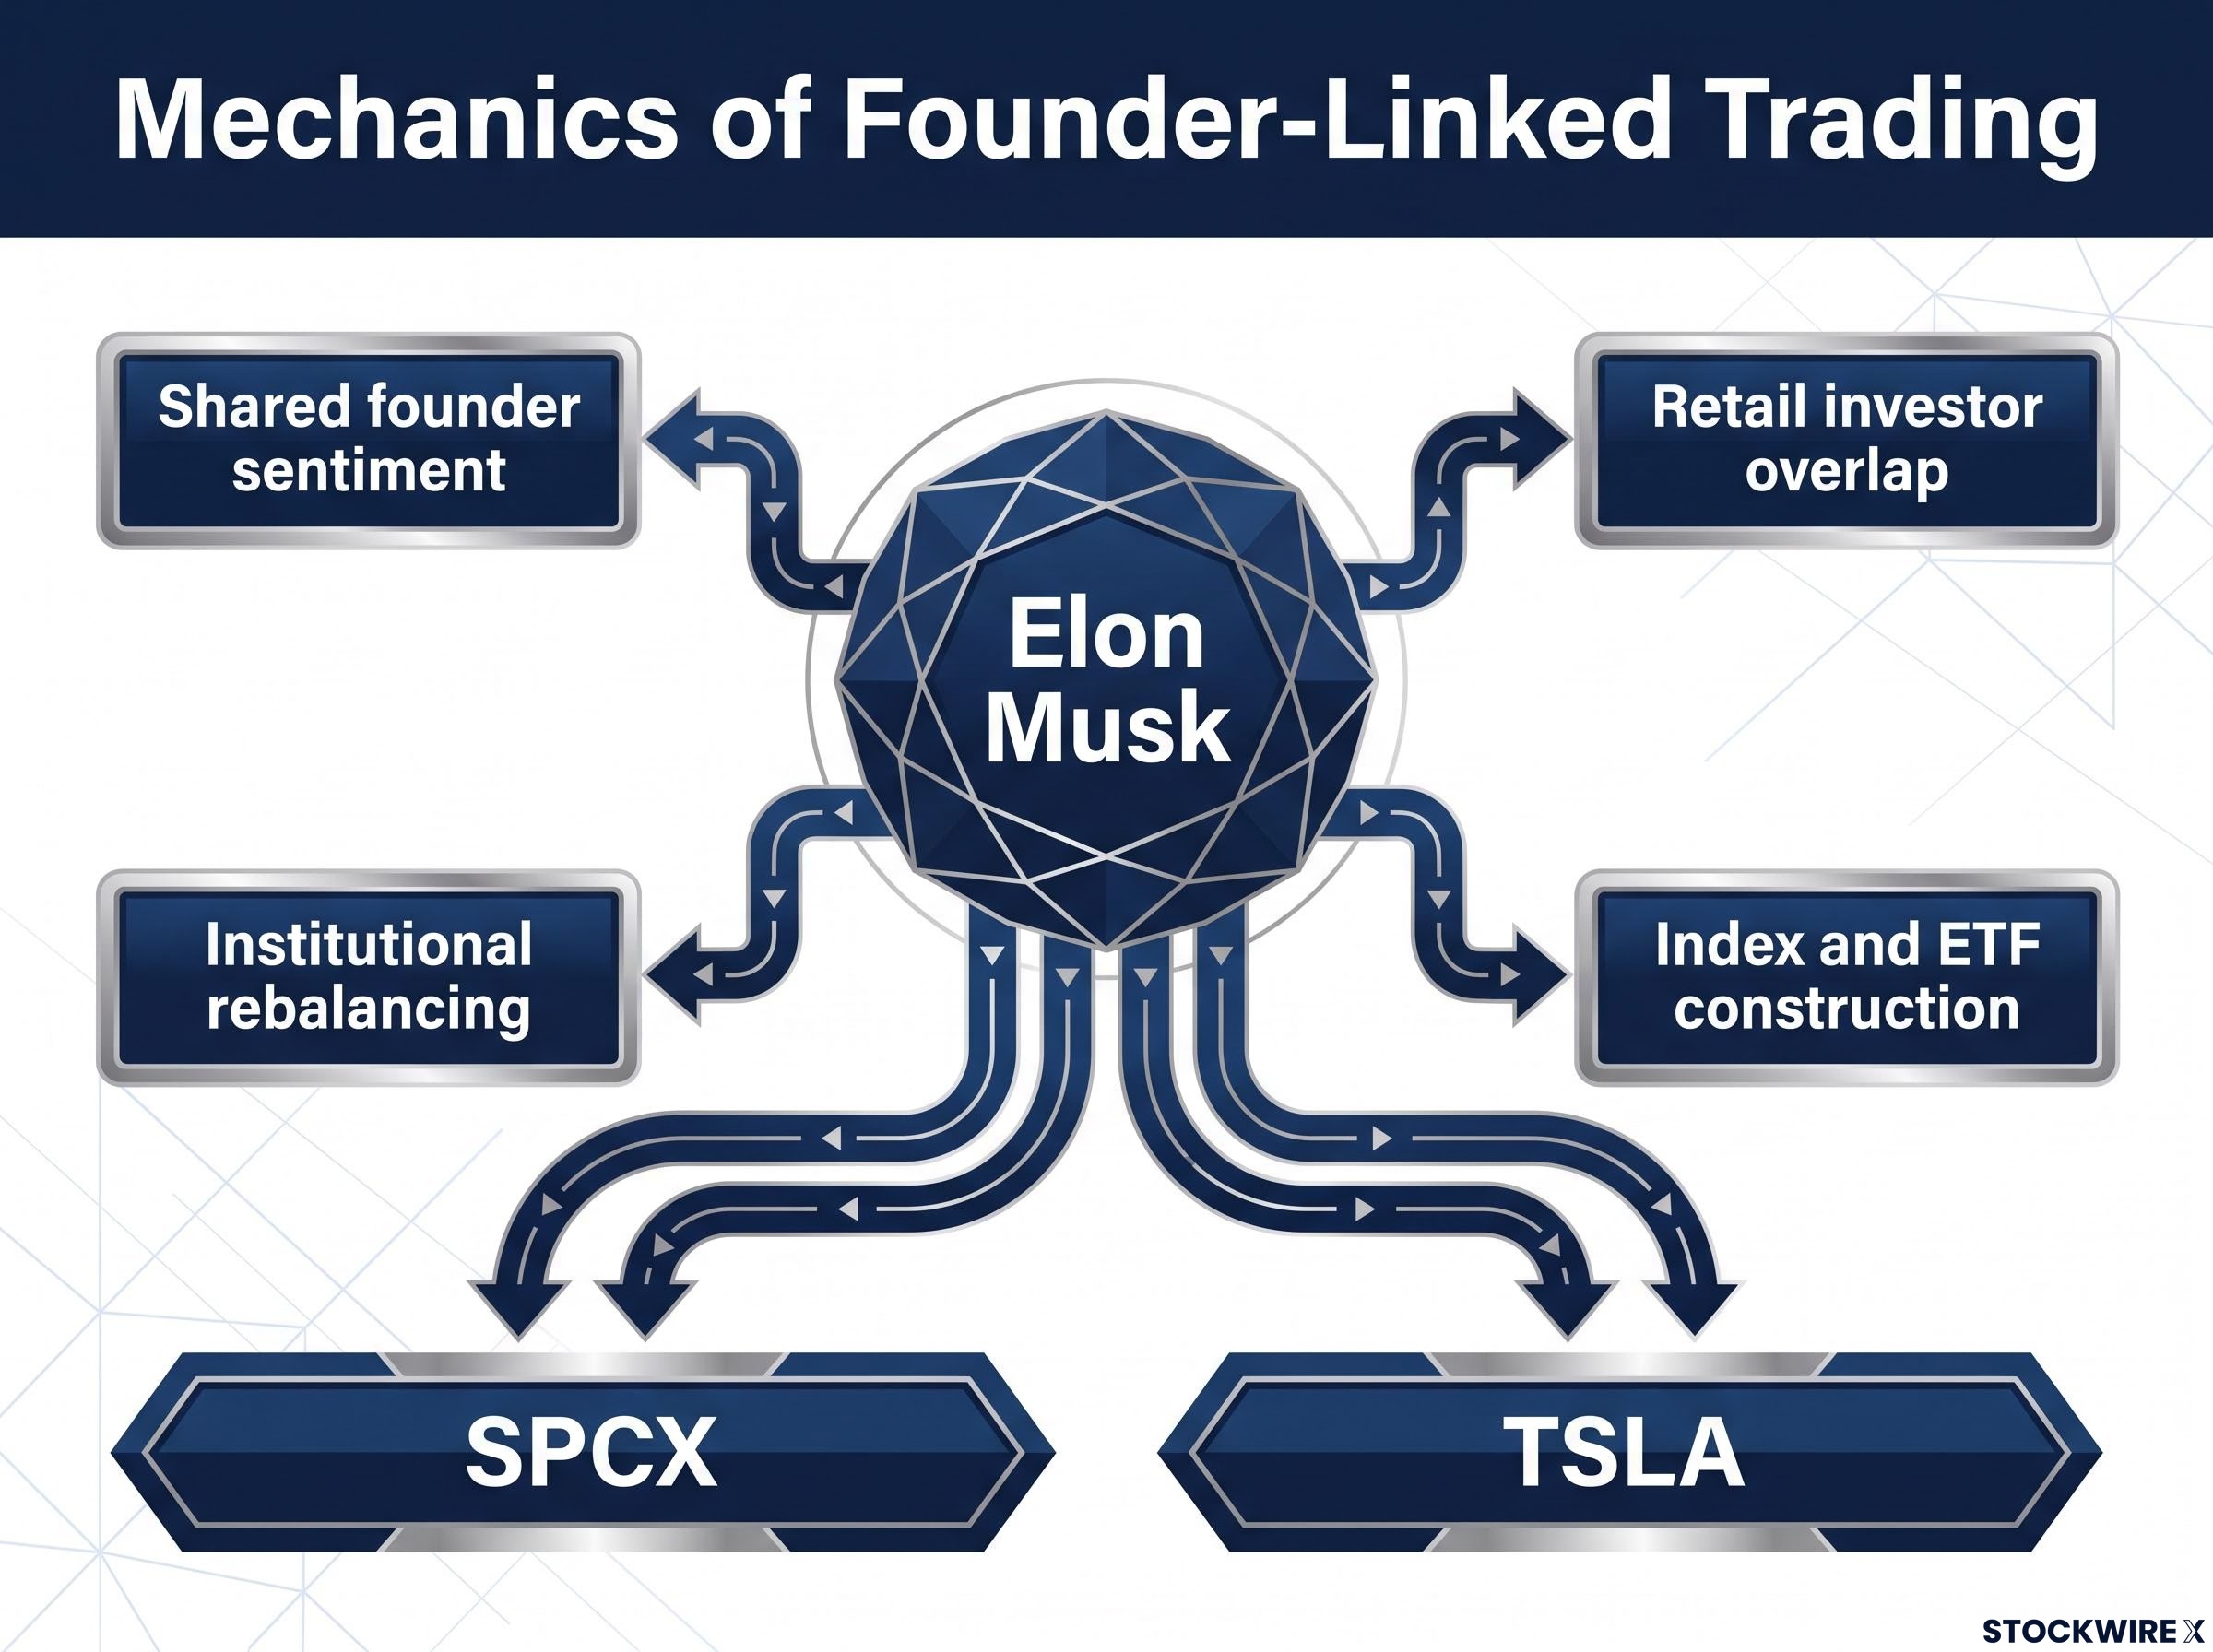
If the businesses share nothing, the co-movement has to come from somewhere else. That somewhere is how markets process information about a single prominent person, and there are at least four channels through which it works.
- Shared founder sentiment: News touching Musk’s reputation, regulatory standing, or personal capacity moves investor appetite for both names at once, generating correlated flows that have nothing to do with company fundamentals.
- Retail investor overlap: Both stocks attract people drawn to Musk’s profile rather than to launch economics or vehicle margins, so retail sentiment swings push both in the same direction.
- Institutional rebalancing: Funds with “disruptive technology” or “innovation” mandates often hold both, and they adjust the positions together in response to thematic signals.
- Index and ETF construction: As SPCX becomes eligible for indices and thematic ETFs that also hold TSLA, mechanical rebalancing flows reinforce the link.
These channels can operate at once and feed one another, even while the two companies’ fundamentals move apart. That is the point often missed: co-movement does not require any business logic. It only requires shared attention.
The Investing.com framing attributes the current linkage to “short-term market excitement.” That actually strengthens the argument rather than weakening it. Sentiment-driven co-movement is real, but it is also fragile, which matters enormously when you decide how much of it to trust.
Sentiment-driven or structurally reinforced?
Not all four channels behave the same way over time. Retail sentiment is transient; it shifts with the news cycle and can reverse in days. Index eligibility and ETF inclusion are the opposite: once SPCX enters those baskets, the mechanical flows compound and the correlation becomes harder to trade around.
For you, the durability question is everything. If retail sentiment around Musk is doing the work, the co-movement can break fast. If institutional construction is quietly reinforcing it, the relationship hardens into a structural feature of owning either name.
The three-month data series is simply too short to say which mechanism dominates. That is precisely why Investing.com withheld statistical confirmation, and why “Musk risk” is best treated as a real investable factor rather than narrative colour.
What this means if you hold both: concentration risk in disguise
Here is the reframe that changes how you should size these positions. If you own both SPCX and TSLA thinking you have diversified across aerospace and electric vehicles, you have not. You are running a single-factor bet on one individual.
Financial analysis calls this founder-linked concentration risk: the condition where a shared key person functions as a common risk factor across otherwise independent assets. Sector diversification does nothing to offset it, because the shared variable is the founder, not the industry.
Three scenarios would likely pull both stocks down together.
- A reputational event. A regulatory sanction or personal controversy involving Musk depresses sentiment across everything tied to him, regardless of how the individual businesses are performing.
- A capacity concern. Markets begin questioning whether one person can run multiple large, complex enterprises at once, and both names re-rate on doubts about bandwidth rather than fundamentals.
- A governance cluster event. A board dispute or disclosure controversy triggers correlated volatility across every security perceived as part of the ecosystem.
None of this is hypothetical in the broad sense. Markets have watched founder-linked clusters behave this way before.
Berkshire Hathaway’s valuation has long tracked Warren Buffett’s reputation, with succession and health concerns affecting the stock and affiliated vehicles together. SoftBank’s equity, its Vision Fund instruments, and portfolio holdings have moved as a group around news about Masayoshi Son’s leverage and governance decisions. Meta Platforms, where Mark Zuckerberg holds outsized control through a dual-class structure, has seen sentiment swing across the stock on his strategic priorities, most visibly metaverse spending.
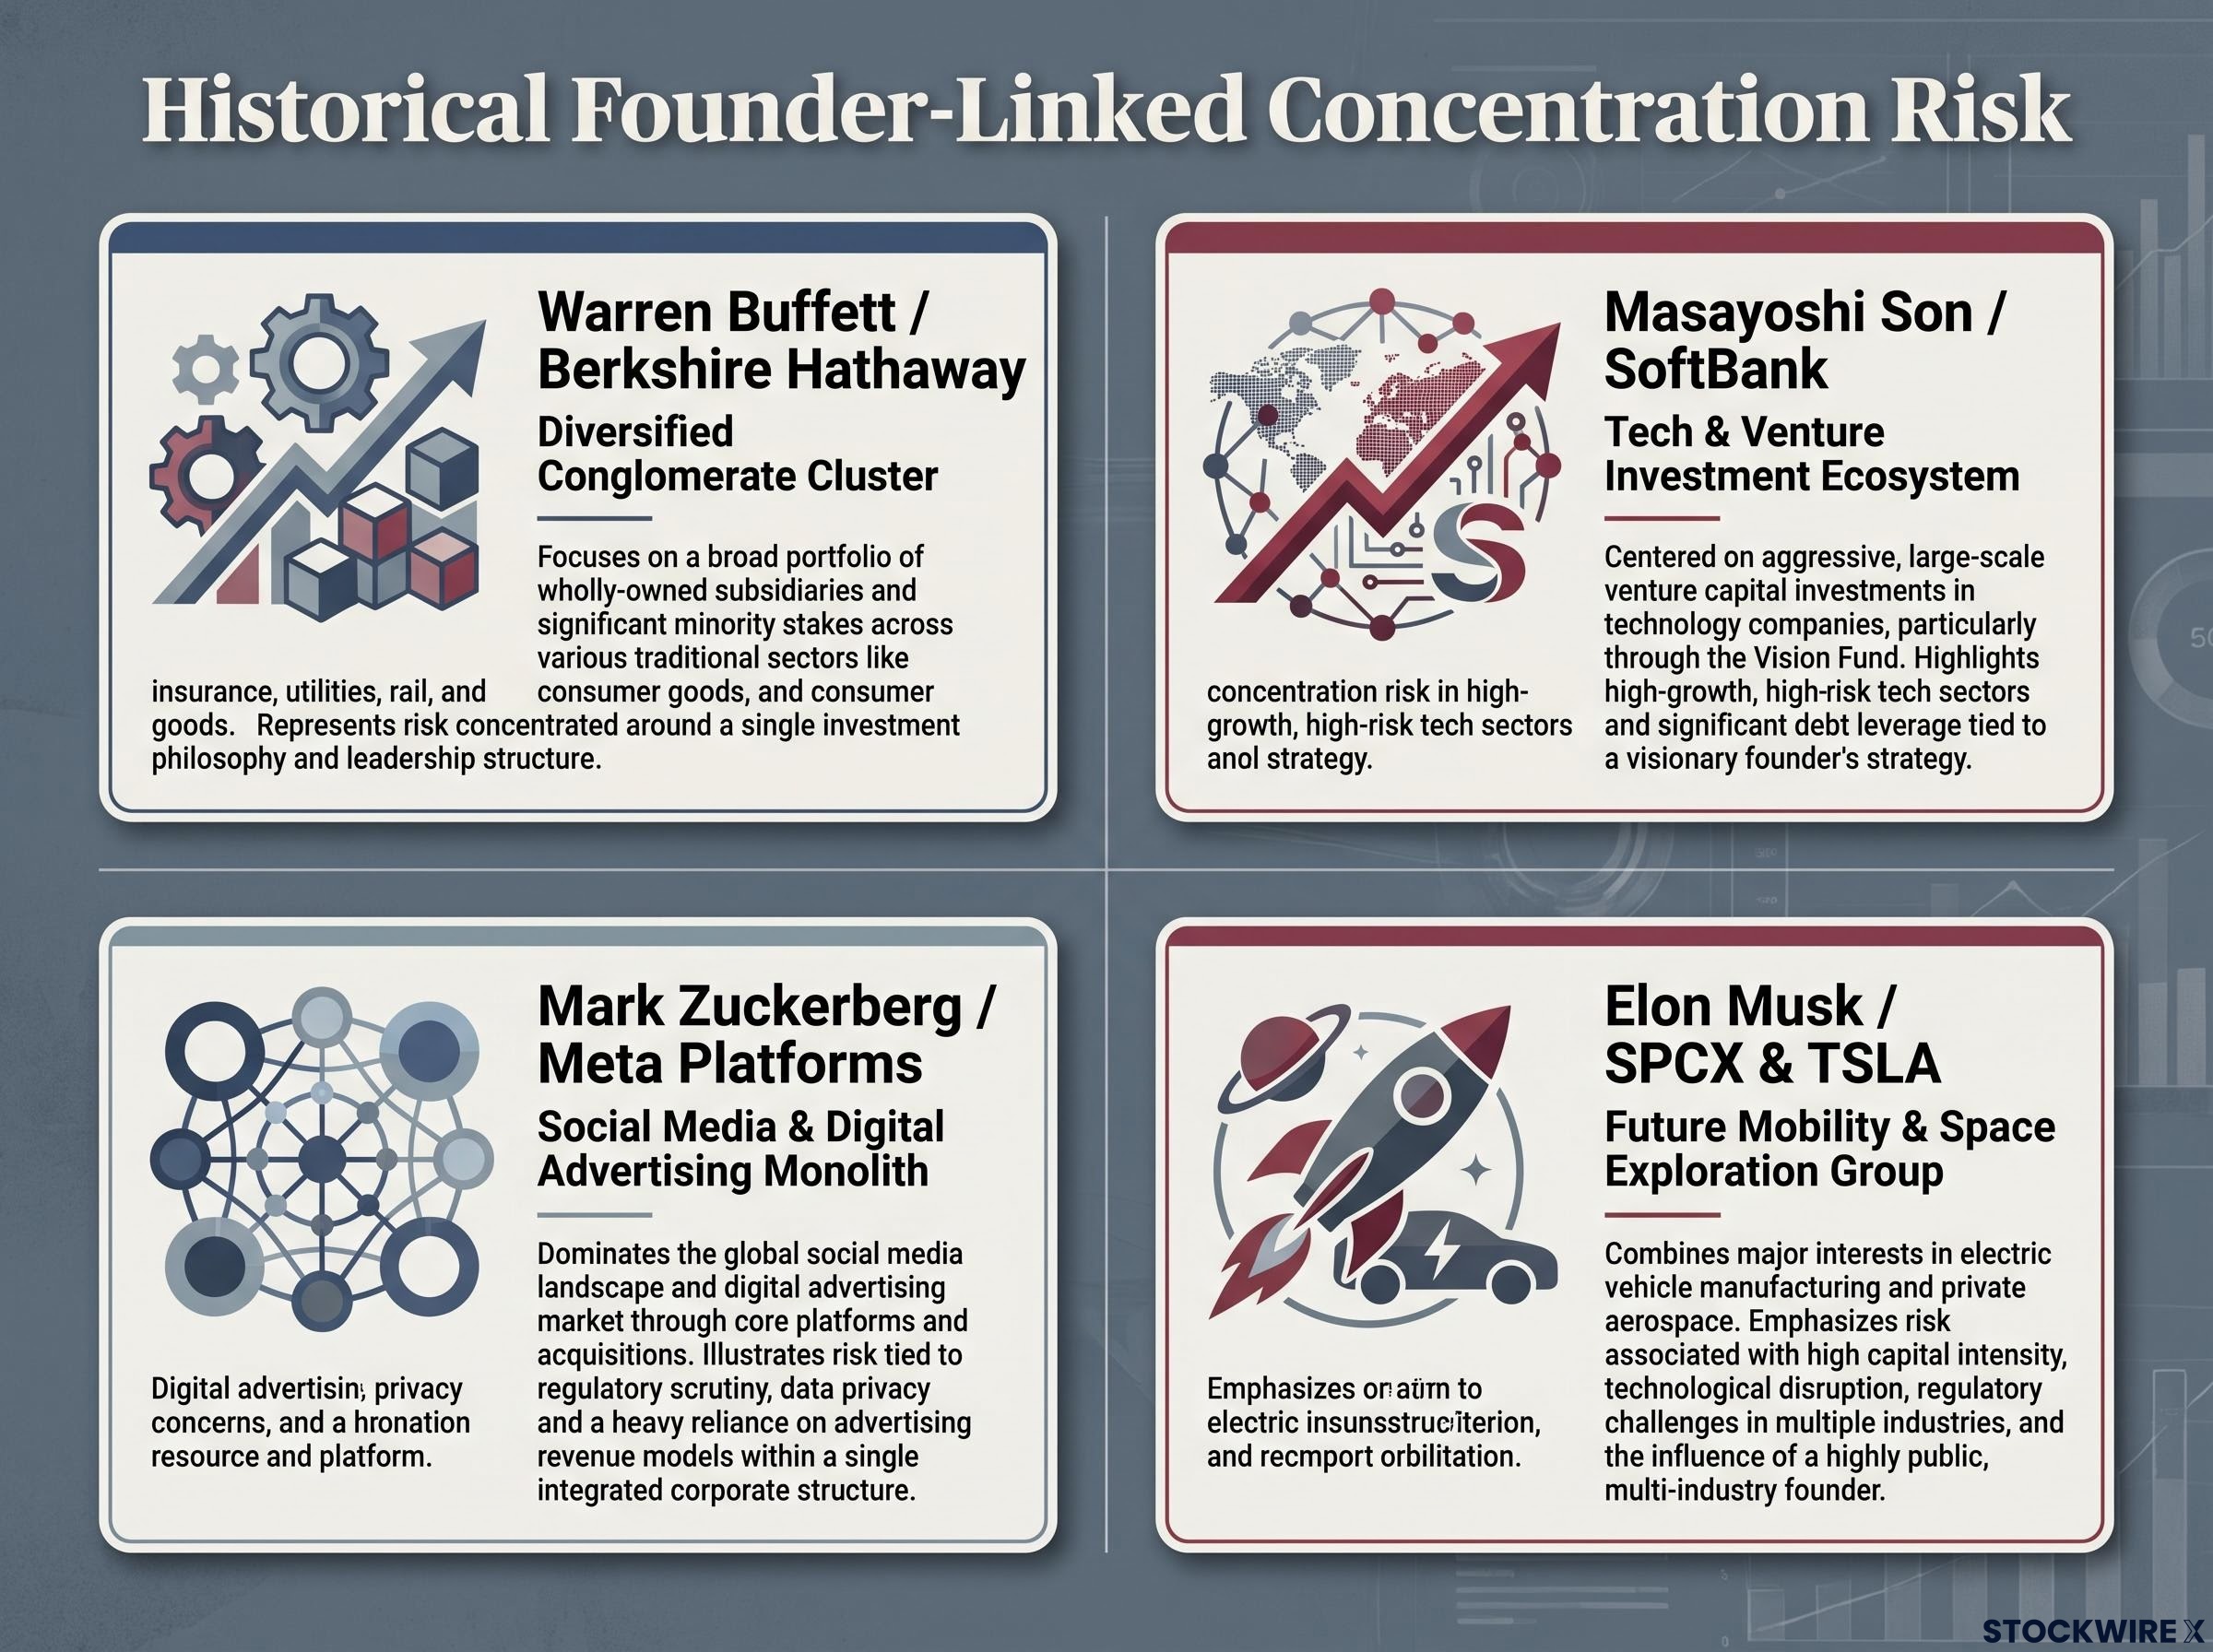
The pattern is consistent. A prominent founder becomes a common risk factor that overrides the diversification you think you have.
Holding both SPCX and TSLA is a single-factor bet on Elon Musk, dressed up as diversification across two sectors.
So what do you do with that? General adviser guidance on founder-linked concentration points in one direction: cap aggregate exposure to any one founder’s ecosystem as a share of your total portfolio, stress-test for scenarios where that founder’s reputation or capacity deteriorates even if the companies still look sound, and size the combined position as one factor rather than two independent variables. No specific percentage cap fits every investor, but the principle is directional and clear. Treat “Musk risk” as one input, not two.
Space economy fundamentals, including government contract duration, launch revenue mix, and backbone versus reach-application exposure, represent the independent business case for SPCX that the correlation story temporarily obscures; those factors are what would justify holding the stock if the Musk premium were stripped away.
SPCX breaking higher while TSLA fades: reading the current divergence
The reason this matters right now is that the two names have, for the moment, stopped moving together. Tim Knight’s technical read describes SPCX as constructive, appearing to break away from the $150 resistance zone, while Tesla is losing upward momentum. Knight has also disclosed a personal bullish stance on SpaceX.
The recent SPCX prints support the constructive framing. Robinhood had it at $154.92 on 17 September 2026, with an intraday range of $152.63-$156.87. Morningstar recorded $154.80 on 16 September 2026, up 2.60%.
That opens a genuine question rather than an answer. Is this the two names fundamentally separating, or is it short-term noise in a relationship that will snap back to co-movement? One caution applies with force here: newly listed stocks are shaped by IPO allocations, stabilisation activity, and early hedging, all of which make technical signals less reliable than in established names. Read the $150 break with appropriate uncertainty. It is worth noting that no TSLA price series for mid-September 2026 was located in available sources, so the divergence rests on Knight’s momentum read rather than a matched price comparison.
Two scenarios investors should be prepared for
- Correlation reasserts. Tesla’s fading momentum drags SPCX back toward approximately $145, roughly the level Knight referenced as a resistance point for Strategy (Michael Saylor’s firm), and the co-movement pattern resumes.
- Genuine decoupling. SPCX finds independent institutional sponsorship as a maturing listing, the link weakens, and the early correlation becomes a historical artifact of the first post-IPO months.
The stakes differ sharply between the two. If the correlation reasserts and TSLA’s weakness pulls SPCX lower, you experience the downside of a correlated pair, not the diversification cushion you might have assumed you held. That is the moment to know in advance whether you want both legs on.
For investors wanting to understand why the SPCX-TSLA divergence is happening now rather than at another point, our deep-dive into September’s low-correlation market examines how COR3M hit a record low in July 2026 and what that environment means for reading individual stock pair movements.
Mapping your actual exposure before the correlation resolves
Pull the three layers together. The co-movement between SPCX and TSLA is real but statistically unconfirmed. The mechanism behind it is structurally plausible across shared sentiment, retail overlap, institutional rebalancing, and index flows. And the risk implication is that sector diversification does not neutralise founder-level concentration.
Survivorship bias in concentration strategies helps explain why the Musk-ecosystem narrative feels compelling: investors who lost money on founder-linked clusters rarely become the public voices promoting them, which systematically inflates the perceived safety of running concentrated exposure to a single prominent individual.
The current divergence is not a reason to relax. It is a moment of optionality. The relationship is in active flux, which makes this the time to audit positions rather than assume the pattern breaks in any particular direction.
The honest constraint is the three-month data series. It is why no firm conclusion can be drawn yet, and why the Investing.com verdict from 8 September 2026, directionally similar moves observed but no confirmed relationship, remains the responsible benchmark.
You now have the tools to size your combined SPCX-TSLA holding as a single Musk-ecosystem position rather than two independent sector bets. That is a materially more accurate picture of the risk you are carrying. One question does the work.
If Musk-related news moved both names 10% tomorrow, how would that affect my total exposure?
This article is for informational purposes only and should not be considered financial advice. Investors should conduct their own research and consult with financial professionals before making investment decisions. Past performance does not guarantee future results, and these statements are speculative and subject to change based on market developments and company performance.