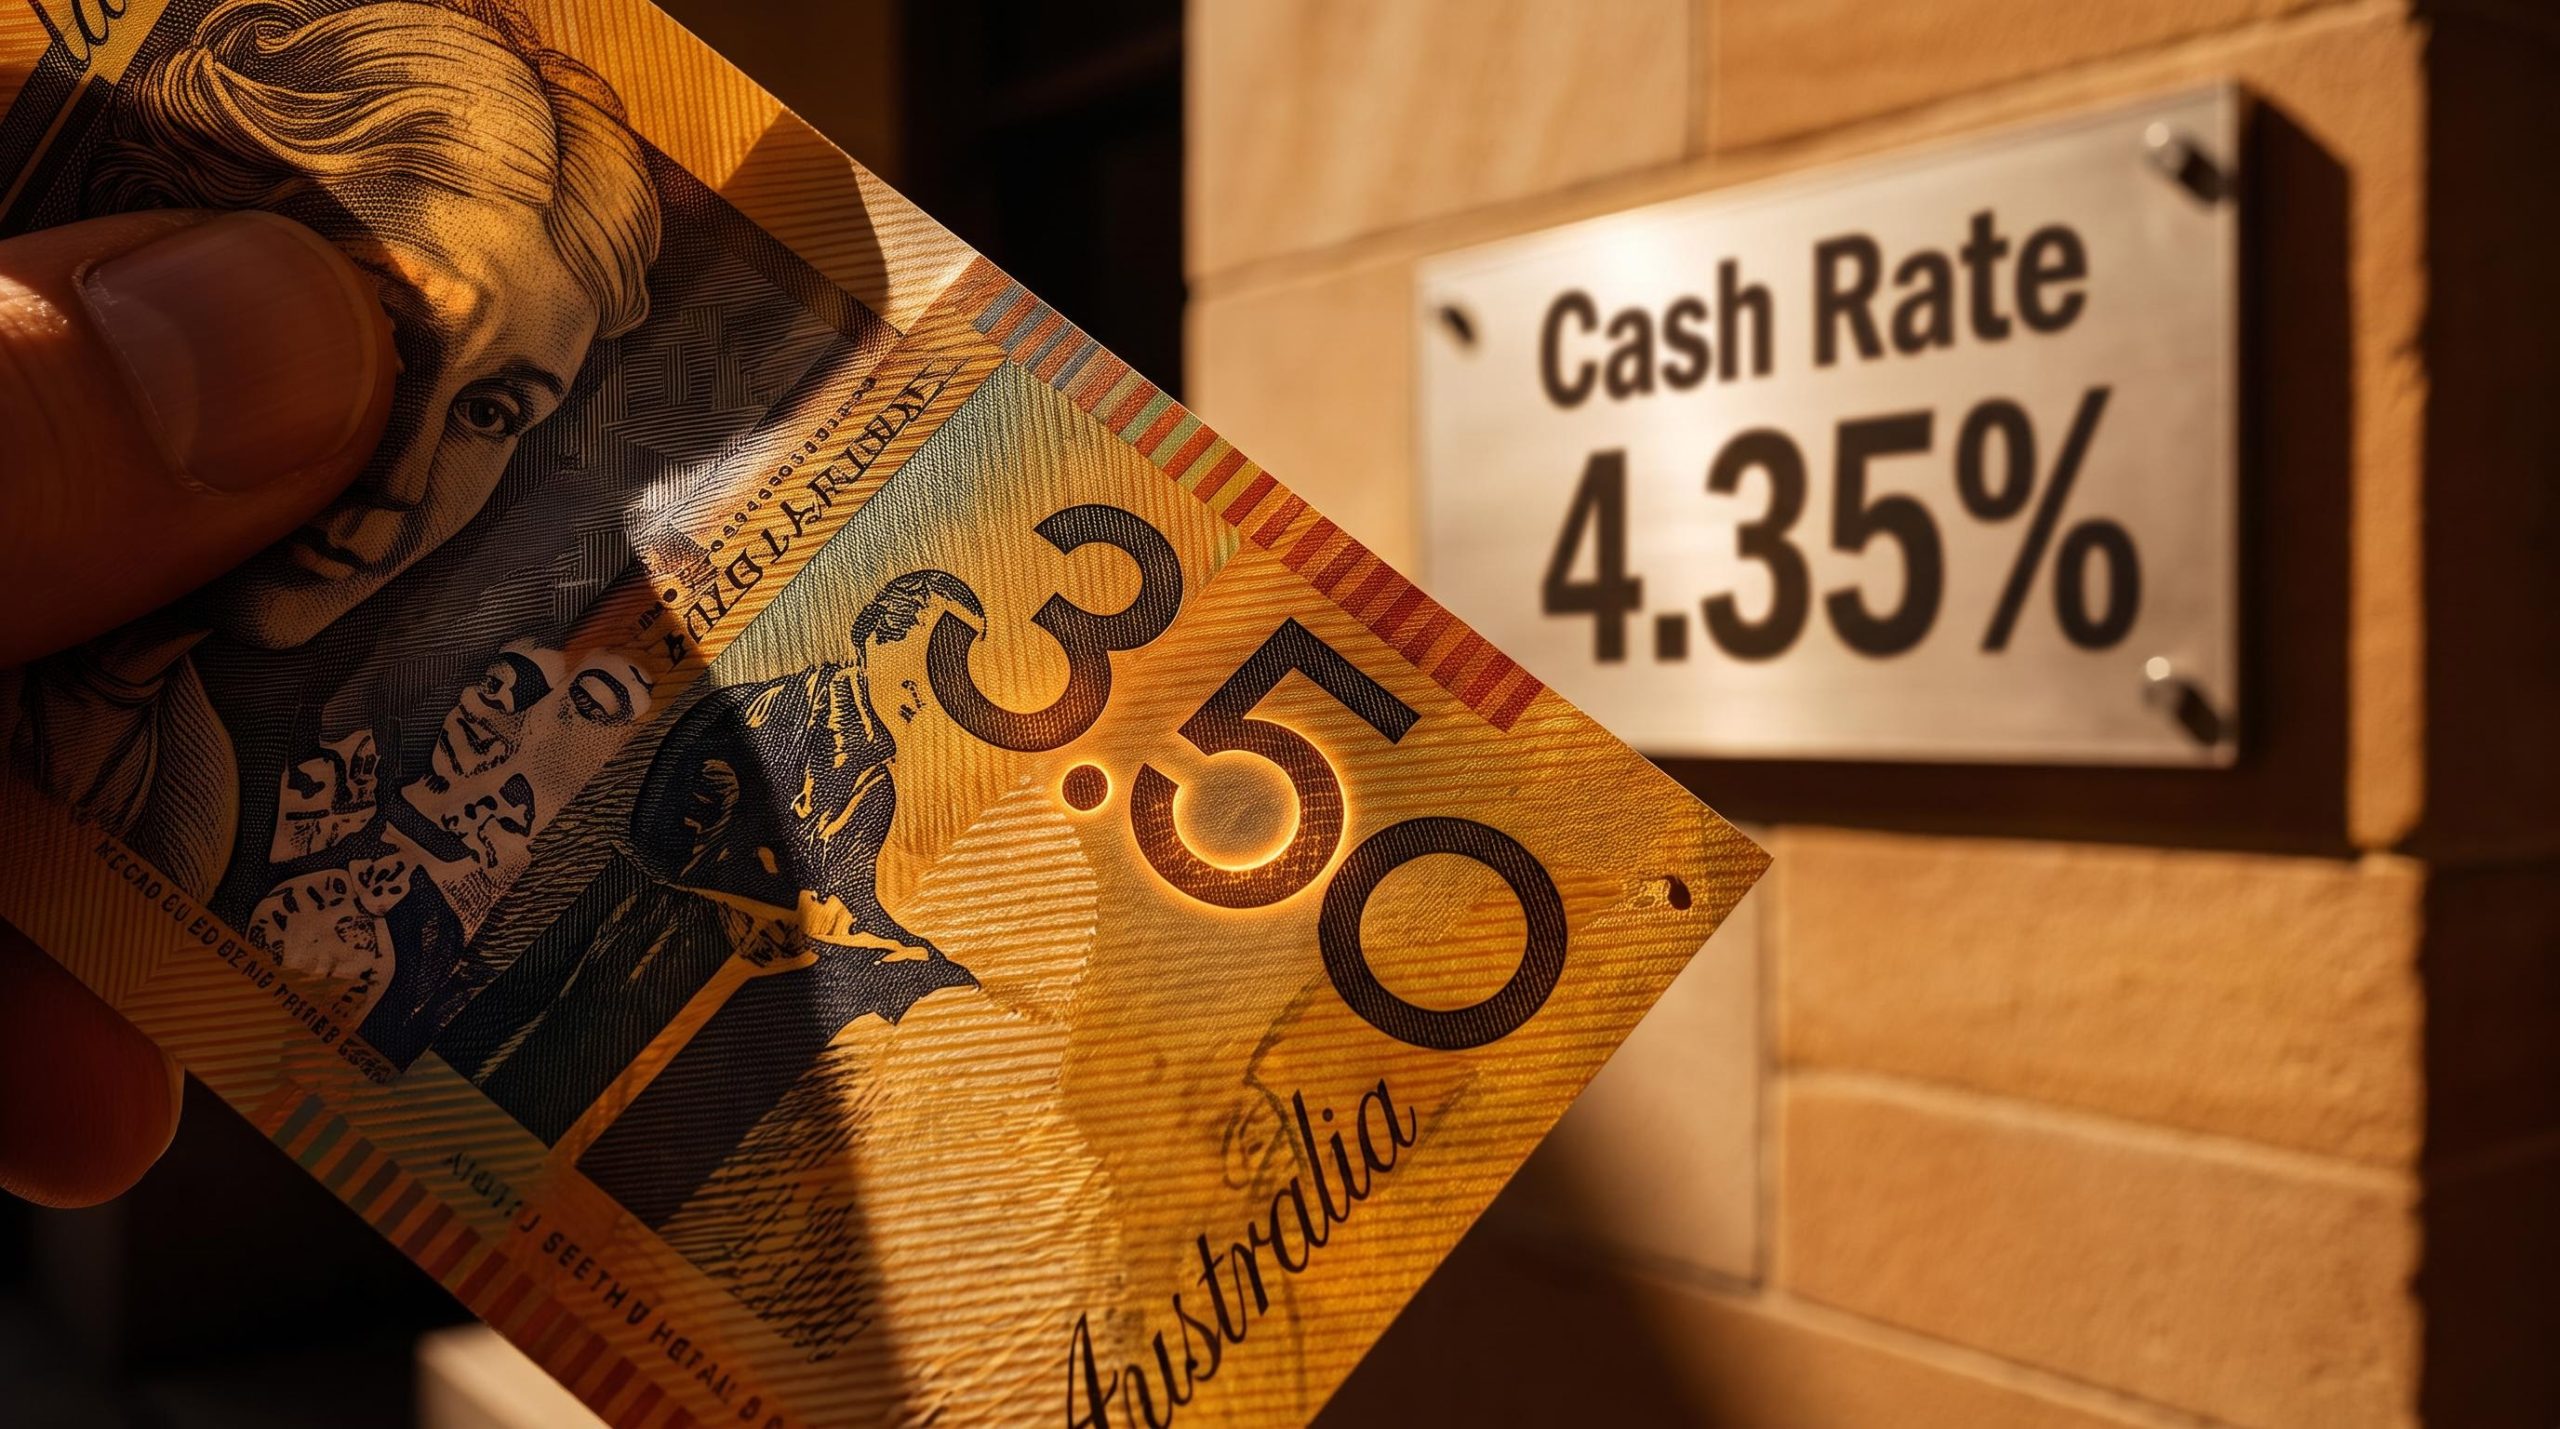
Governor Michele Bullock has acknowledged that the upside inflation risks the Reserve Bank of Australia (RBA) flagged at its August board meeting are now materialising. That is not a reassurance. It is a signal that the RBA’s most uncomfortable forecast scenario is the one that appears to be playing out.
Australia’s economy is running too hot on prices and too cool on growth at the same time. Trimmed mean inflation sat at 3.6% year-on-year as of July 2026, the cash rate has been held at 4.35% since August 2026, and residential property is recording its sharpest broad decline since the pandemic.
The board now has to decide whether the tightening already delivered is enough, or whether more is needed even as growth softens and unemployment climbs.
This piece works through the four variables shaping the RBA inflation outlook and the coming rate call: inflation persistence, labour market signals, housing risks, and what all of it means for the Australian Dollar. For anyone tracking RBA policy direction into the 29 September 2026 board meeting, here is a clear-eyed read on where the data actually sits and what the competing pressures imply.
Why inflation is still not cooperating
Growth is slowing, yet prices are not falling into line. That looks like a contradiction. It is closer to an explanation.
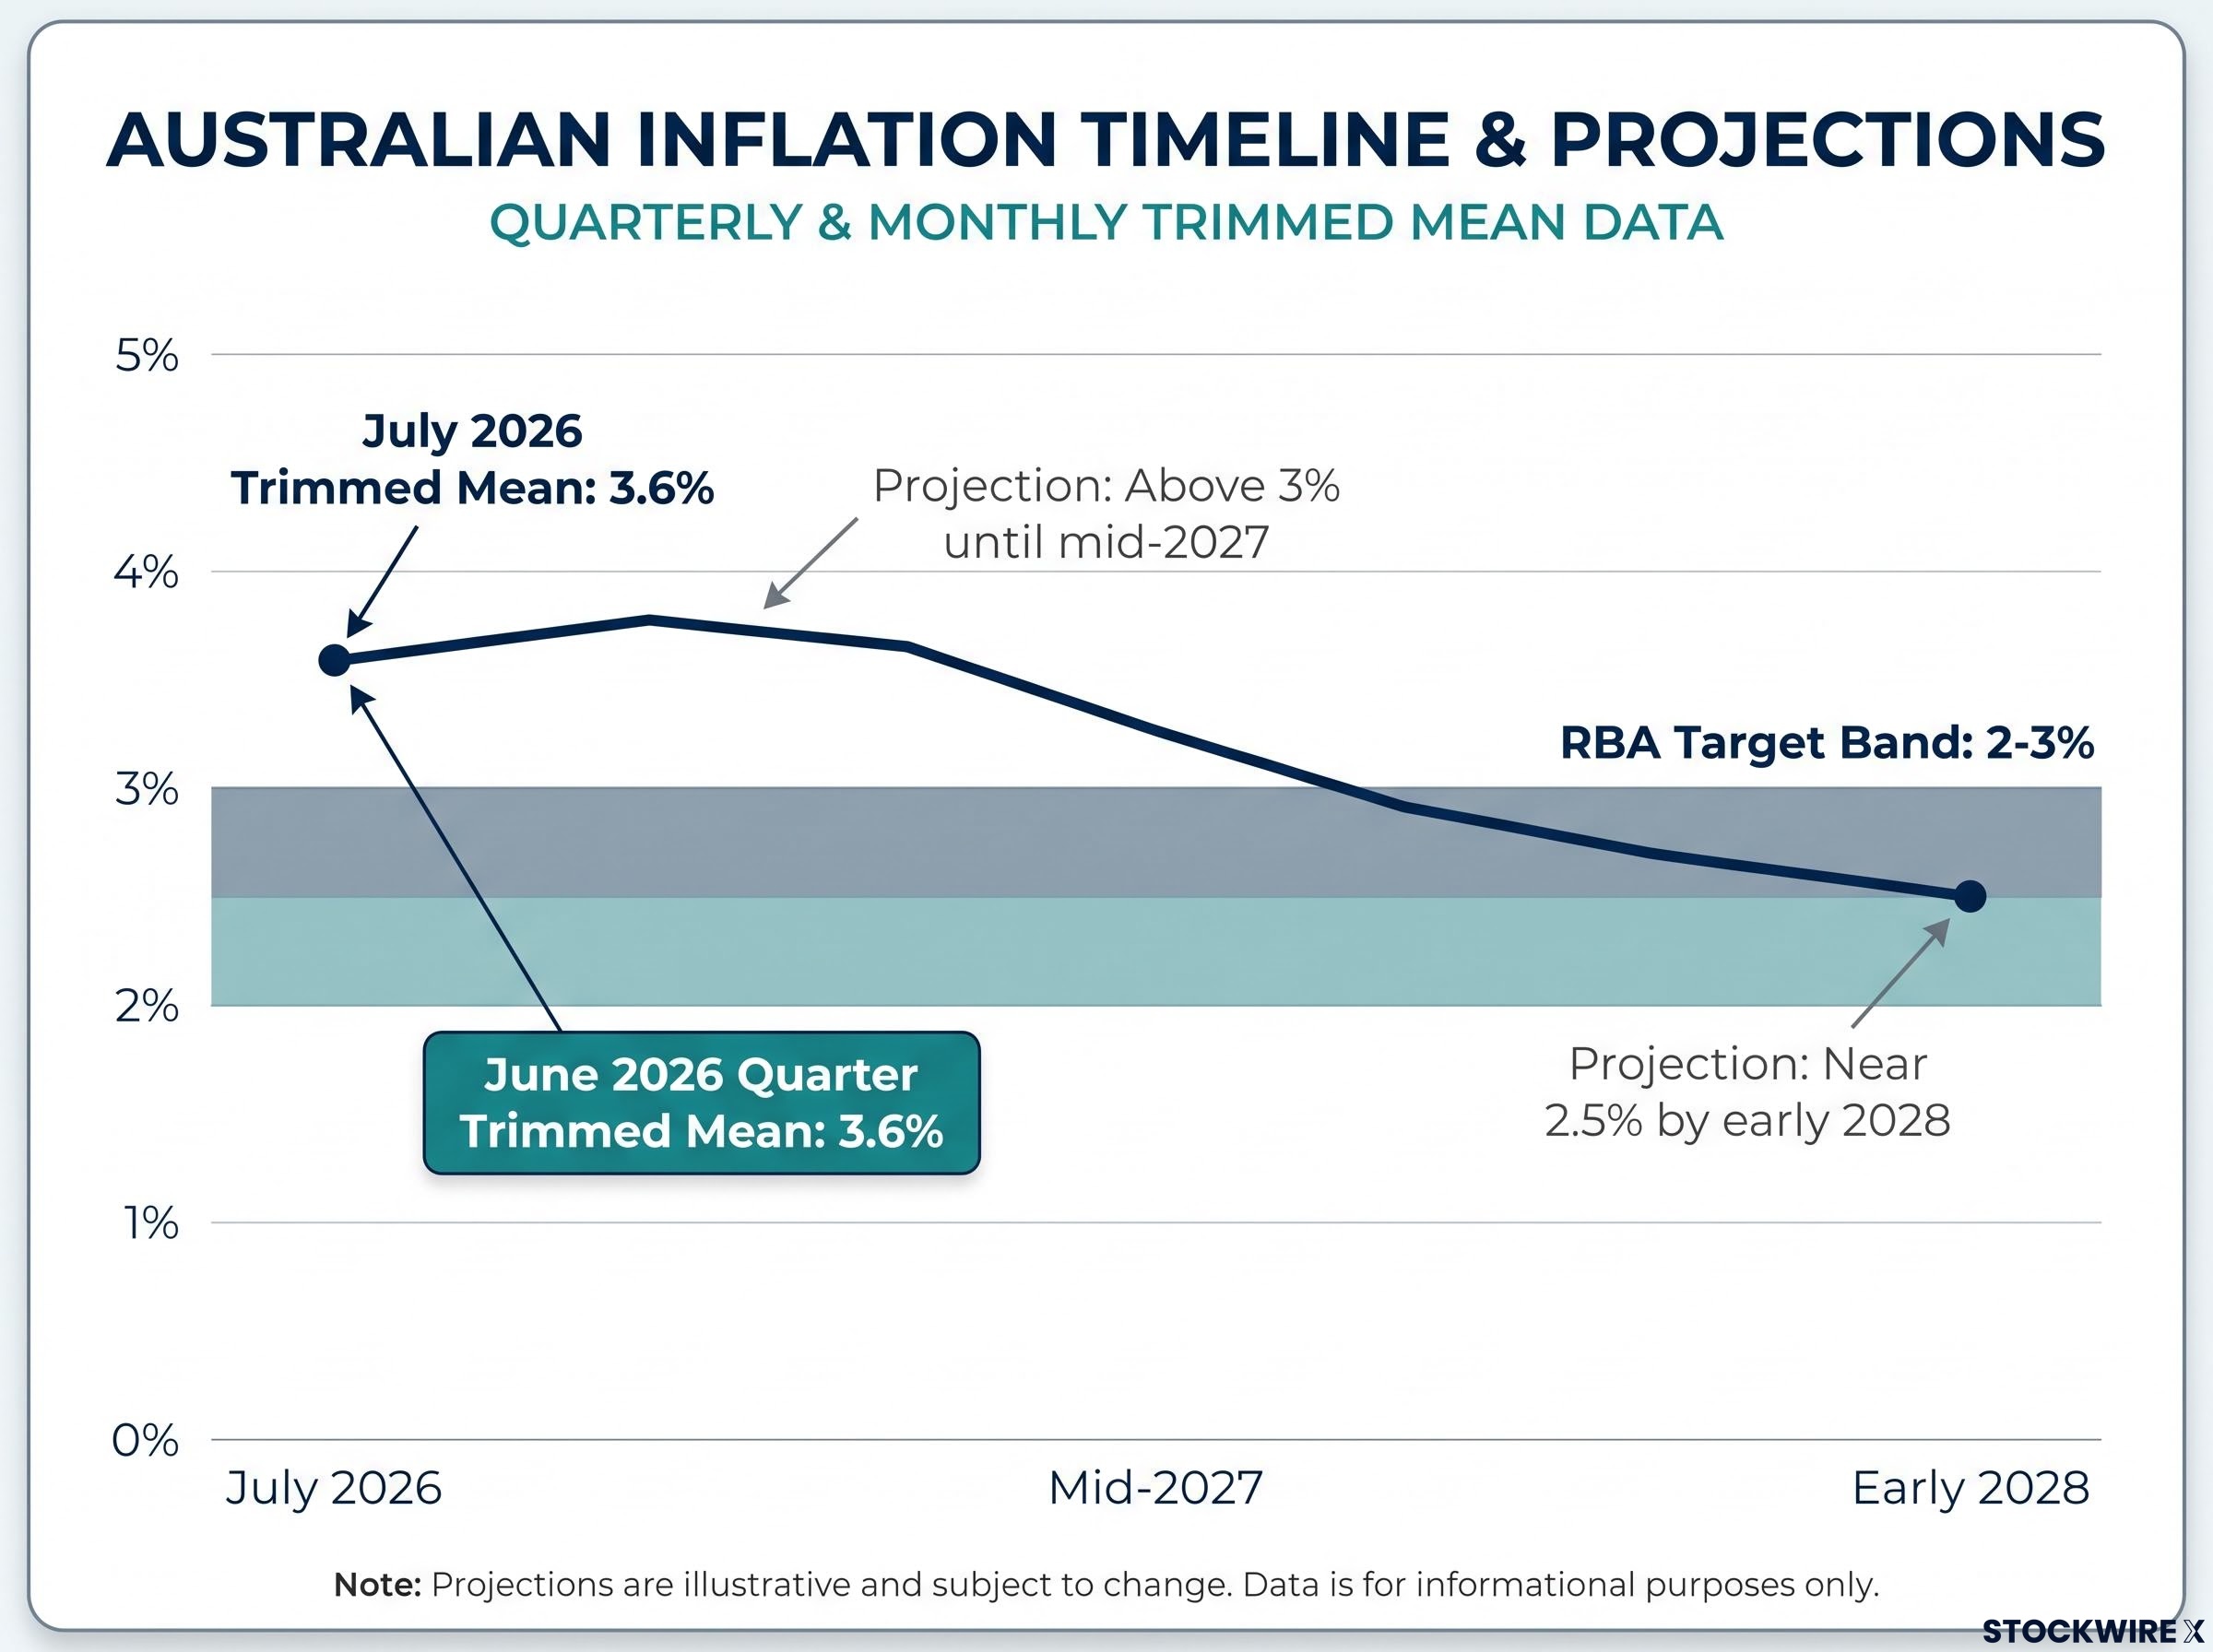
The most recent official reading, the ABS Consumer Price Index for July 2026 (released 26 August 2026), put headline inflation at 3.6% year-on-year and the RBA-preferred trimmed mean at 3.6% year-on-year. The June 2026 quarter told the same story: annual headline CPI at 3.8% and trimmed mean at 3.6%. Both sit above the RBA’s 2-3% target band.
The trimmed mean strips out the most volatile price movements to show the underlying trend, and that is the number the RBA watches most closely. It is not budging quickly.
The June 2026 CPI reading that immediately preceded August’s board meeting showed trimmed mean inflation at 3.6%, beating the RBA’s own May forecast of 3.8%, yet the board still retained its tightening bias, which tells you how high the bar for a dovish pivot actually sits.
The RBA’s August 2026 Statement on Monetary Policy projects trimmed mean inflation to stay above 3% until mid-2027, easing only gradually to around 2.5% by early 2028.
Here are the readings that anchor the outlook:
- July 2026 CPI: headline 3.6% and trimmed mean 3.6% year-on-year
- June 2026 quarter: headline 3.8%, trimmed mean 3.6%
- RBA projection: trimmed mean above 3% until mid-2027, near 2.5% by early 2028
For investors treating the current readings as a passing overshoot, that timeline is the point to sit with. If underlying inflation is not back to target until 2028, anyone pricing a near-term policy easing is working from the wrong horizon.
The cost-shock overlay
Part of the stickiness is coming from outside Australia. The RBA links persistent inflation to the pass-through of higher costs from the Middle East conflict into fuel, transport, and broader input prices. NAB research on 9 September 2026 flagged the same renewed cost shock, which it said has temporarily arrested the improving trend in underlying inflation.
The RBA’s business liaison work shows many firms actively passing those higher input costs through to end consumers rather than absorbing them.
That matters because a supply-side cost shock does not respond neatly to interest rate settings. Rates cool demand. They do not lower the price of imported fuel.
The productivity problem underneath
There is a second, more structural driver. Economist Saul Eslake, in ABC analysis on 4 September 2026, tied Australia’s lingering inflation near 3.5% to weak productivity growth, which forces firms to keep prices elevated as their unit costs rise.
The mechanism is simple. When output per worker stalls but wages and costs keep climbing, the cost of producing each unit goes up, and businesses pass that on.
The takeaway is uncomfortable for anyone hoping softer growth will do the job. The RBA faces both a timeline problem, inflation falling too slowly, and a mechanism problem, inflation that rate settings alone cannot fully resolve.
When big ASX news breaks, our subscribers know first
What the labour market and housing data are telling the RBA
The softer economic data is not the comfort it might look like. Both the labour market and housing arguments cut against a hike. Neither is soft enough to build a convincing case for a cut. That leaves the RBA in a tighter spot than either camp tends to admit.
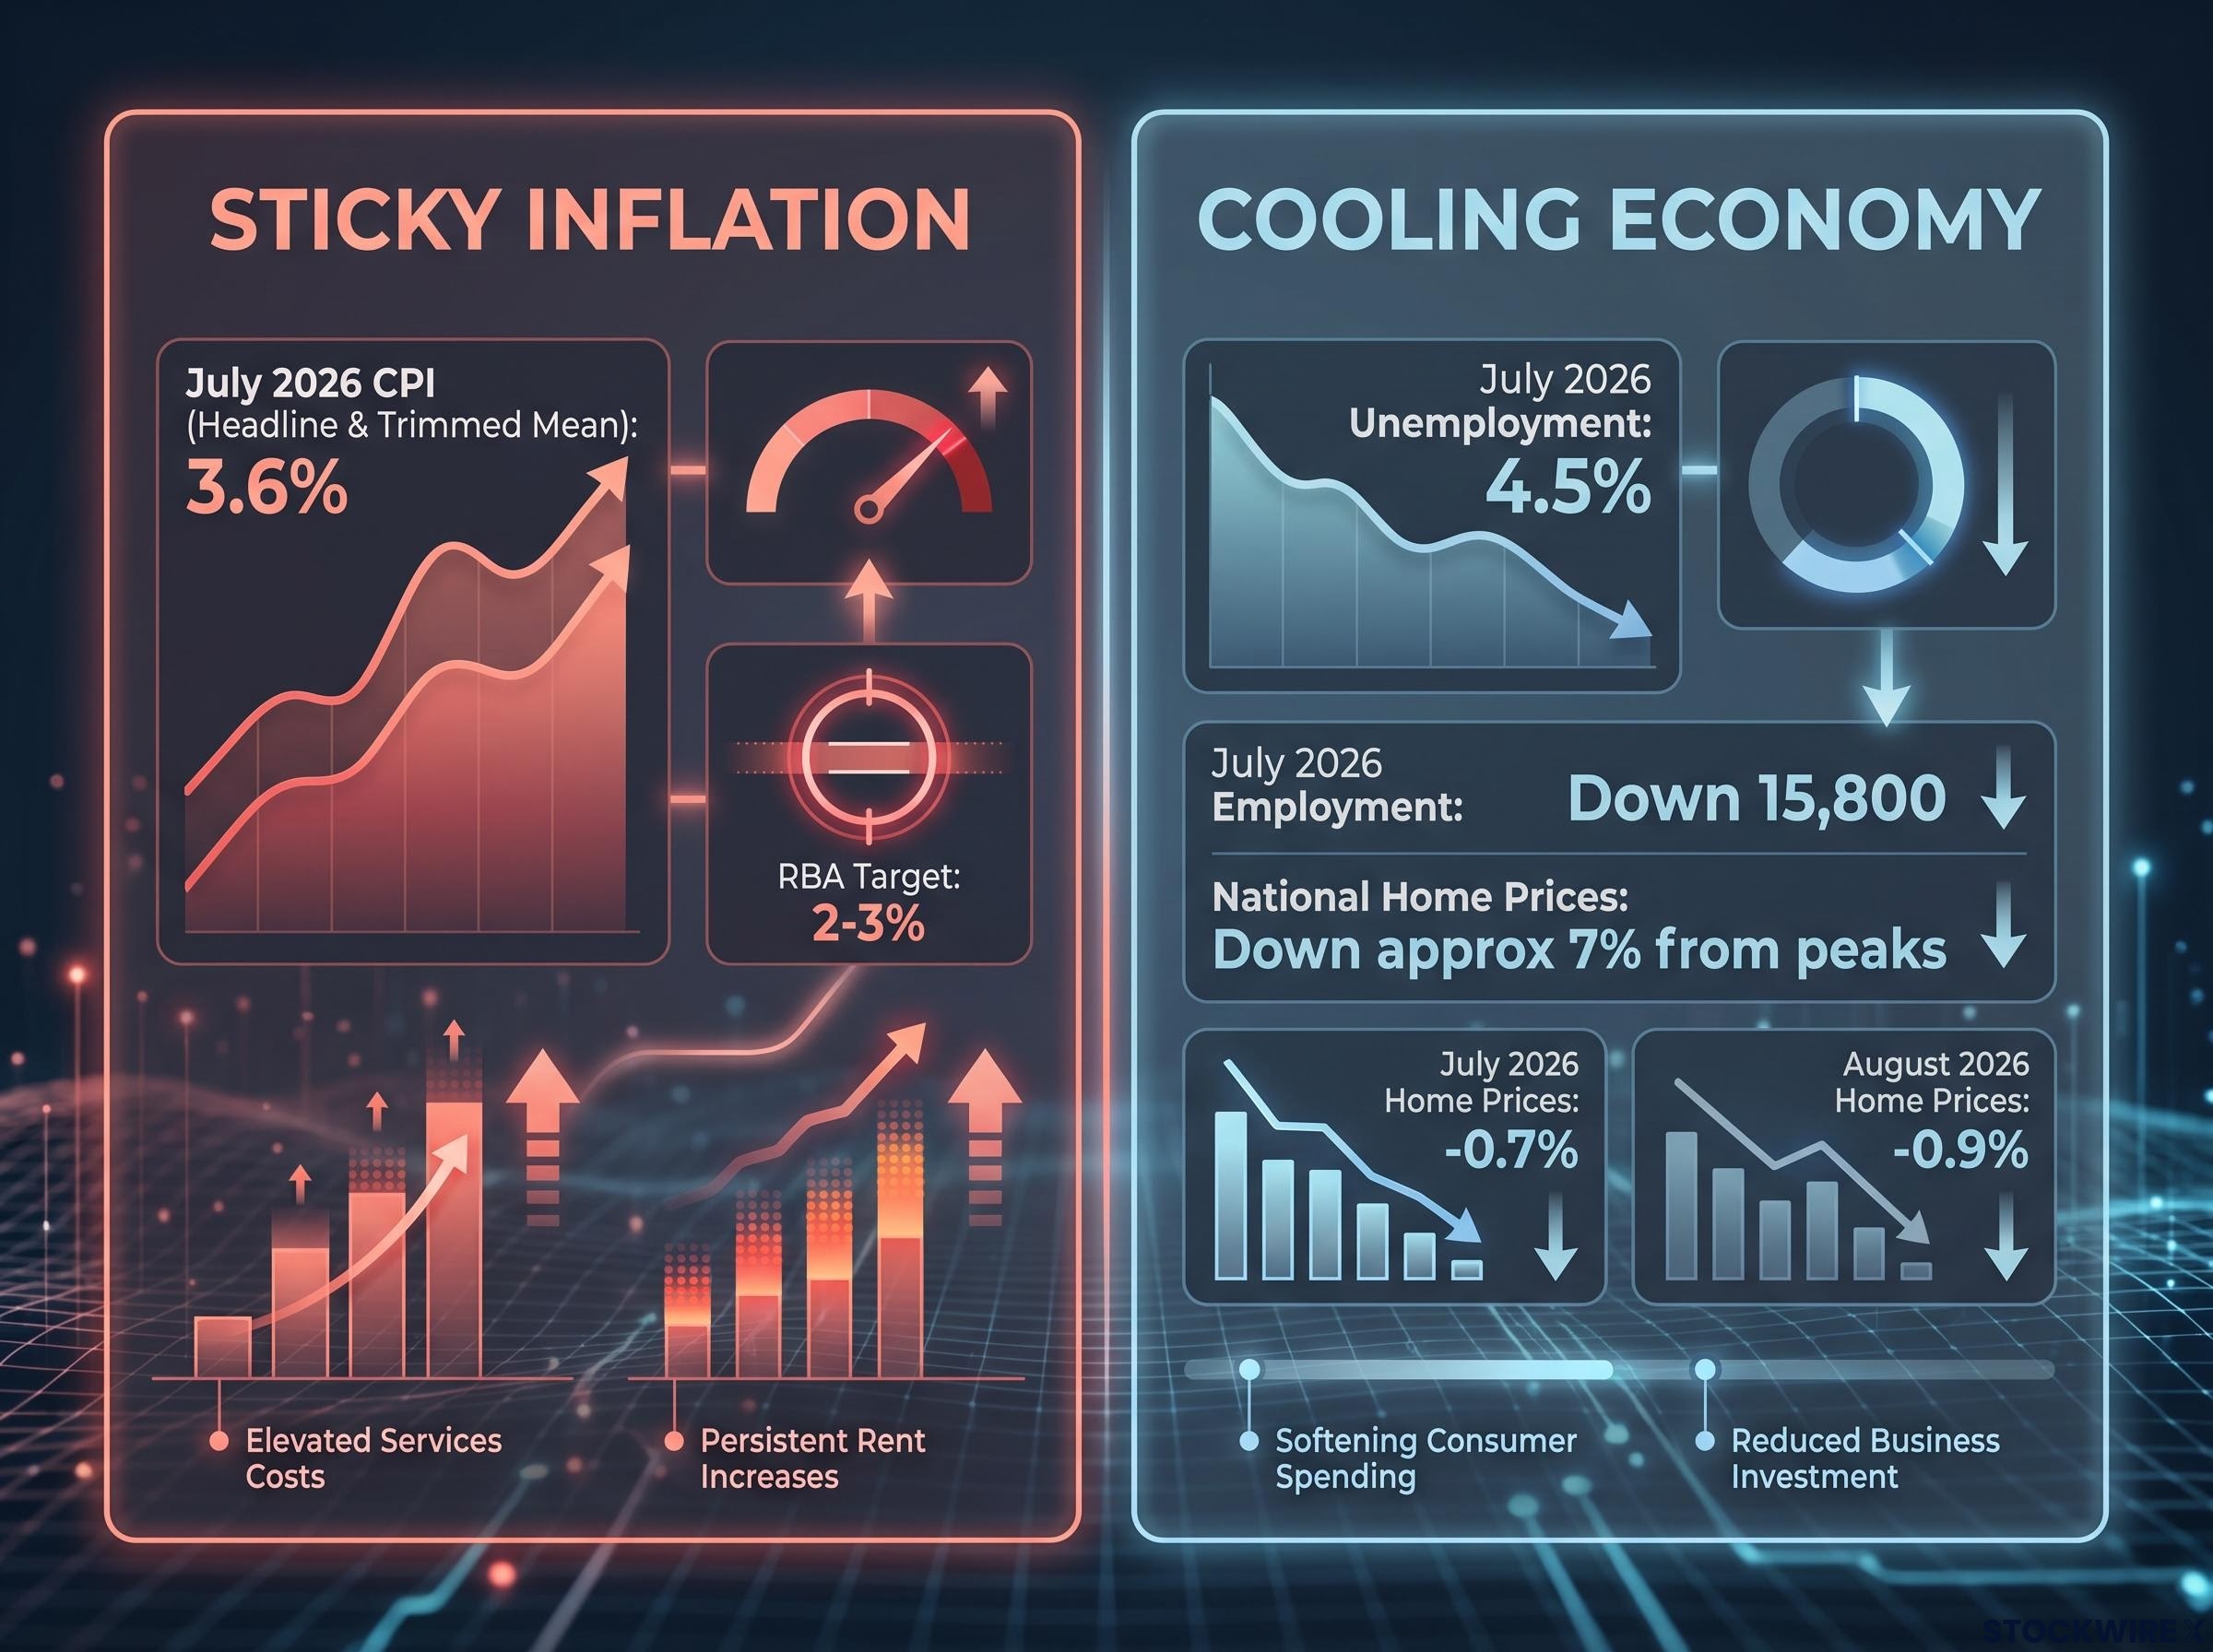
Start with jobs. The ABS Labour Force release for July 2026 (published 20 August 2026) showed the seasonally adjusted unemployment rate rising to 4.5%. Employment fell by 15,800 and the number of unemployed rose by 4,200 to 691,500. That is a directional shift away from Governor Bullock’s earlier read of conditions as marginally tighter than full employment.
Commonwealth Bank noted that the move to 4.5% unemployment strengthens the case for the RBA to hold off on further hikes.
The July labour force miss landed nearly 28,000 below consensus forecasts, and the part-time sector absorbed all of the weakness while full-time employment actually rose, a composition detail that complicates the RBA’s read on whether the headline deterioration signals genuine demand weakness or statistical noise.
Housing is the second signal, and it is deteriorating faster. Cotality’s Home Value Index recorded national prices falling 0.7% in July 2026 and 0.9% in August 2026, down roughly 7% from their peaks. By late July 2026, Sydney and Melbourne were down about 5% year-to-date. Department store Myer issued a profit warning citing the housing squeeze on consumer spending.
| Indicator | Latest reading / signal |
|---|---|
| Unemployment rate (July 2026) | 4.5%, seasonally adjusted |
| Employment change (July 2026) | Fell 15,800 |
| National home prices (July 2026) | Down 0.7% month-on-month |
| National home prices (August 2026) | Down 0.9% month-on-month |
| Peak-to-current price decline | Approximately 7% |
| Estimated consumption impact of a 10% price fall | Around 1 percentage point off consumption growth over a couple of years (NAB) |
The wealth effect is the link between falling prices and slower spending. When households feel less wealthy on paper, they spend less.
NAB’s August 2026 “Housing channels” research estimates that a 10% fall in dwelling prices subtracts around 1 percentage point from consumption growth over a couple of years.
For the reader, this is the crux of the dilemma. Falling employment and the broadest housing decline since the pandemic are already applying contractionary pressure. Additional hikes would layer more of the same onto a consumer sector that is already being squeezed. The data arguing against a hike is accumulating faster than the data arguing inflation is under control, and how the board weighs those two piles will set the cash rate’s path into 2027.
How the RBA’s policy options actually break down
The board sits at a three-way fork: hike, hold, or begin signalling a cut. Each position draws directly on the evidence already laid out.
The current cash rate target is 4.35%, effective 12 August 2026, with the next update scheduled for 29 September 2026. The August 2026 Monetary Policy Board minutes confirm the board actively considered a 25-basis-point hike before choosing to hold.
The August 2026 board minutes show a 25-basis-point hike was genuinely on the table before the board unanimously held.
That detail is telling. It says the bar for acting sits higher than the inflation numbers alone would suggest, which means the next move, whenever it lands, will reflect a balance of evidence rather than a single trigger.
The RBA’s August tightening bias was the real market event at that meeting, not the widely anticipated hold itself, because the language preserving residual hike optionality directly shapes how bond markets, equities, and the AUD price the September decision.
The case for another hike
The hawkish argument leans on the inflation trajectory. With trimmed mean inflation projected above 3% until mid-2027, some see holding as too passive.
- NAB revised its call on 17 September 2026 to a 25bp increase, taking the rate to 4.60%
- An IMF-linked comment reported by Reuters on 17 September 2026 suggested the RBA may need to raise rates further
- A Reuters poll in June 2026 found 18 of 44 respondents expecting the cash rate at 4.60% or higher by the end of September
- Three of the big four banks, CBA, NAB and ANZ, have been reported as forecasting a move to 4.60%
The case for holding (and watching)
The dovish argument leans on everything softening at once. The labour market is loosening, the housing wealth effect is dragging on consumption, and the RBA’s own August 2026 outlook expects GDP growth to stay subdued in 2026 and below potential in coming years.
- Softening labour market, with unemployment at 4.5%
- Housing wealth-effect drag on consumer spending
- RBA’s below-potential growth outlook
NAB’s earlier view, held in August and reiterated on 3 September 2026, anchors the dovish end: on hold through 2026, with the next move a cut around mid-2027.
For investors, reducing 29 September 2026 to a binary hike-or-hold bet misses the point. The decision turns on how accumulated labour and housing evidence is weighed against a sticky inflation path, and the RBA’s signalling is conditional, not fixed.
What the RBA’s dilemma means for the Australian Dollar
The Australian Dollar is not just waiting to receive the RBA’s verdict. It is a live gauge of how investors are pricing the competing scenarios right now.
As of 17 September 2026, AUD/USD was trading around 0.7113, roughly 0.37% above the prior day’s level, with Bloomberg, TradingEconomics and MTFX all clustered near 0.71. In early September 2026 the pair traded in a broader band around 0.7160-0.7230. The 4.35% cash rate gives the currency carry appeal against lower-yielding peers, which is part of what has kept it supported.
The two RBA scenarios point the AUD in opposite directions. A hike widens the interest-rate differential and supports the currency. A hold paired with dovish signalling opens downside risk, particularly if global risk appetite sours.
NAB’s Cross-Asset note and June 2026 Forward View forecast AUD/USD at 0.72 by mid-year and 0.73 by the end of 2026, against a current level near 0.7113.
There is a structural floor under the currency too. The RBA projects inflation will not reach the target midpoint until early 2028, which implies policy stays restrictive for an extended period. That keeps rate differentials in the AUD’s favour against currencies where central banks are already cutting.
For anyone holding AUD exposure, the read is straightforward. The current range reflects real uncertainty about whether the next move is up or down. When that uncertainty resolves, in either direction, the move is likely to be sharper than the recent range-bound trading suggests. The currency is trading on a policy narrative, not just a rate level.
What to actually watch before 29 September
The decision will not turn on one headline number, so watching for a single print is the wrong approach. A short list of signals carries most of the information content between now and the board meeting.
- Labour force data: Any fresh employment reading before the meeting is the key test of whether July’s softening was a wobble or a trend. A further rise in unemployment strengthens the hold case; a sharp reversal revives the hike argument.
- Inflation and activity data: Any CPI or activity release scheduled before 29 September 2026 matters most for the trimmed mean. A reading that keeps underlying inflation stuck above 3% tilts the balance toward tightening.
- RBA communication: Governor Bullock has framed the central question as whether the tightening already implemented is sufficient. Shifts in that language are a signal in their own right.
The RBA’s dual mandate covers price stability and maximum employment, with price stability treated as the primary objective.
That framing tells you where the tie-breaker sits. If the data leaves the board genuinely split, the inflation side of the mandate is likely to carry more weight. The reader who tracks the combination of these signals, rather than one figure, is far better placed to anticipate the outcome than one forming a firm directional view today.
The balance of evidence, and what comes after 29 September
Pull the four threads together and the honest read is one of conditionality, not certainty.
The most likely path, on current evidence, is a hold with a cautious tone, given how quickly the labour and housing data are softening. NAB’s mid-2027 cut scenario sits as the baseline dovish path. But the tail risk is real: if inflation proves stickier than projected, the RBA could be pushed to hike, as NAB’s revised call and the IMF-linked commentary suggest.
A further hike would deepen the housing decline already running near 7% from peak, add pressure to consumption, and likely lift the AUD through wider rate differentials. A hold-then-cut path does the opposite, cushioning housing while leaving the currency more exposed to global sentiment.
Governor Bullock has framed the central question as whether the degree of monetary tightening already implemented will be sufficient to return inflation to target within an acceptable period.
The two scenarios come down to this:
- Hawkish tail risk: sticky inflation forces a hike toward 4.60%, pressuring housing and consumption while supporting the AUD
- Baseline path: a hold through 2026 with a cut around mid-2027, easing housing pressure but leaving the AUD more sentiment-driven
The most important takeaway is not the 29 September 2026 outcome itself. With the RBA’s own projections keeping inflation above target until mid-2027 and at the midpoint only by early 2028, the restrictive environment persists well into 2027 regardless of what the board decides next. The timeline is longer than current market pricing may reflect, and planning around a quick pivot looks premature.
For investors wanting to understand the structural growth backdrop the RBA is navigating, our full explainer on Australia’s per capita recession documents how per capita output fell roughly 0.7% across 2025 even as headline GDP remained positive, a divergence that helps explain why rate settings alone are struggling to resolve the inflation-growth trade-off.
This article is for informational purposes only and should not be considered financial advice. Investors should conduct their own research and consult with financial professionals before making investment decisions. Past performance does not guarantee future results. Financial projections are subject to market conditions and various risk factors, and forward-looking statements are speculative and subject to change based on market and economic developments.