ASX’s 63-Point Spread: Winners and Losers in the Oil Shock
10 mins ago

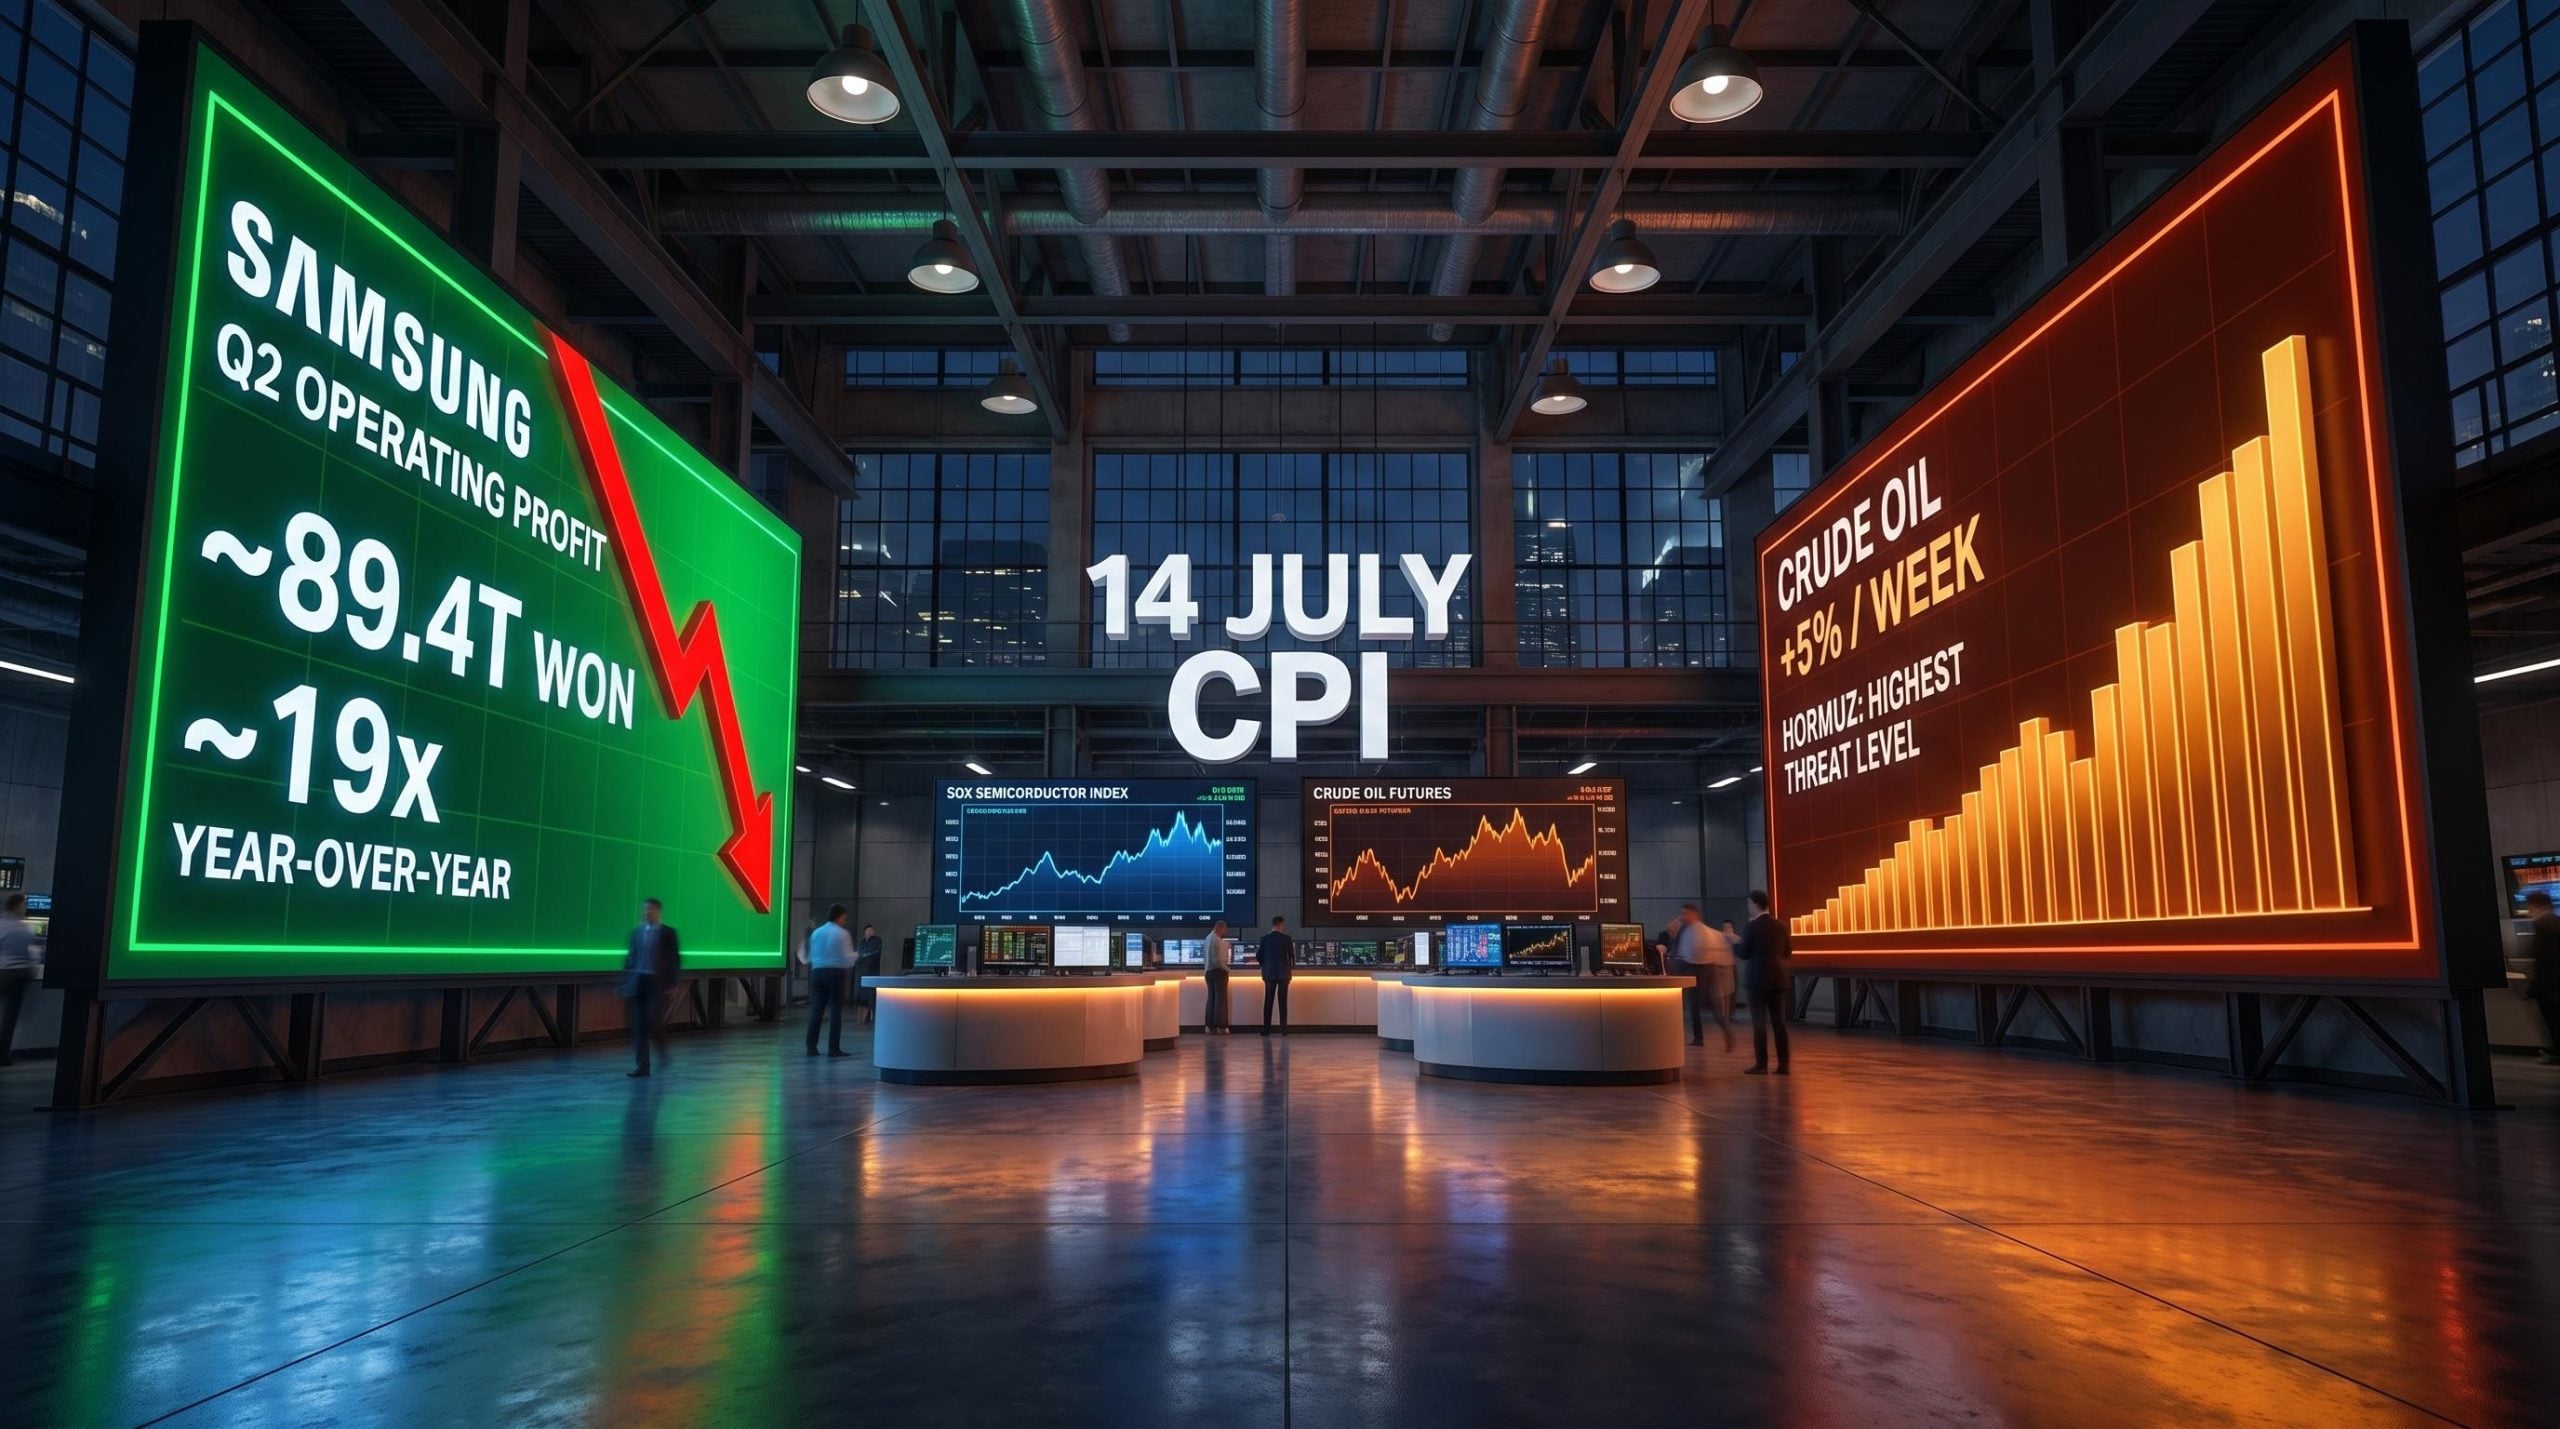
Samsung just reported a roughly 19-fold year-over-year jump in operating profit, one of the most dramatic earnings results in the semiconductor sector’s recent history, and chip stocks fell anyway. At the same time, crude oil climbed approximately 5% across a single week after Washington moved against Iranian exports and a naval coalition flagged serious risks to a critical shipping route that most equity investors had not been watching.
These two events unfolded simultaneously in the first week of July 2026, and together they expose something that strong markets tend to obscure: the assumptions holding your portfolio together.
The dominant assumption embedded in many US portfolios entering mid-2026 was that AI and semiconductor names would keep carrying performance while low energy prices kept inflation calm and the Federal Reserve dovish. Both of those assumptions are now under simultaneous pressure. The 14 July CPI release and the start of earnings season are about to force a reckoning with how sound those positions actually are.
Here is the framework for understanding each force, how they interact at the portfolio level, and which specific data points arriving in the next few weeks will determine whether this is a routine consolidation or something that demands a harder look at how risk is distributed across your holdings.
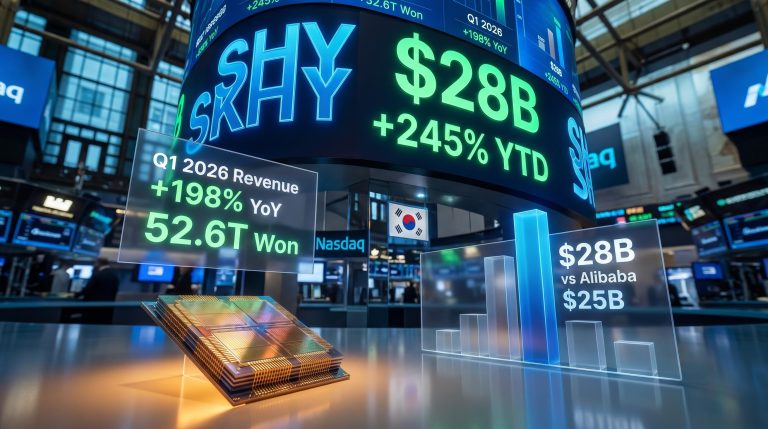
Samsung Electronics reported preliminary Q2 2026 operating profit of approximately 89.4 trillion won (around $58.4 billion), a figure that would ordinarily dominate headlines for days. The result represents a roughly 19-fold increase from the same period a year ago. And shares still declined.
Samsung’s Q2 2026 operating profit: approximately 89.4 trillion won (~$58.4 billion), roughly 19x year-over-year. The stock fell on the result.
The logic of the sell-off only makes sense when you consider what the market had already priced in. After months of extraordinary gains across the semiconductor sector, even genuine outperformance lands as a non-event. The marginal buyer has less incentive to step in. The marginal seller has a clean exit.
Samsung was not alone. During the week of 8 July, a string of major chip names declined even as broader indices advanced:
The Nasdaq lagged broader market indices during this period, weighed down by its technology concentration. The Philadelphia Semiconductor Index (SOX) had already shown its vulnerability in June, with a 7.9% single-session decline on 23 June and multiple weekly swings exceeding 5%.
When a sector falls on record earnings, the market is telling you the price already reflected those results, and possibly better. That means the marginal buyer has less reason to step in, and the marginal seller has a clean window to take profit.
The instinct when chip stocks fall is to ask whether the thesis is broken. The more precise question is whether the market is rotating within equities or exiting them entirely. That distinction shapes every decision that follows.
Rotation means investors are moving capital from winners to laggards, locking in gains from the best-performing names and reallocating to sectors that have underperformed. A structural breakdown means investors are leaving equities altogether because fundamentals have deteriorated. The two produce similar short-term price action in the affected sector but demand completely different responses.
The evidence points to rotation. Broader equity markets continued advancing during the same week chip stocks retreated. Semiconductor stocks remain substantially higher year-to-date overall, confirming this is a pullback from elevated levels rather than a reversal. Market commentary through mid-2026 has increasingly highlighted a shift toward more reasonably valued, underperforming sectors, even as AI fundamentals remain strong.
The underlying AI infrastructure thesis, covering hyperscaler capital expenditure, GPU demand, and data-centre build-outs, remains largely intact. But the market is now more sensitive to valuation and evidence of durable earnings power. High dispersion inside the tech sector means not all semiconductor names face the same pressure: AI hardware plays with strong cash flows are in a different position than more speculative or late-cycle names.
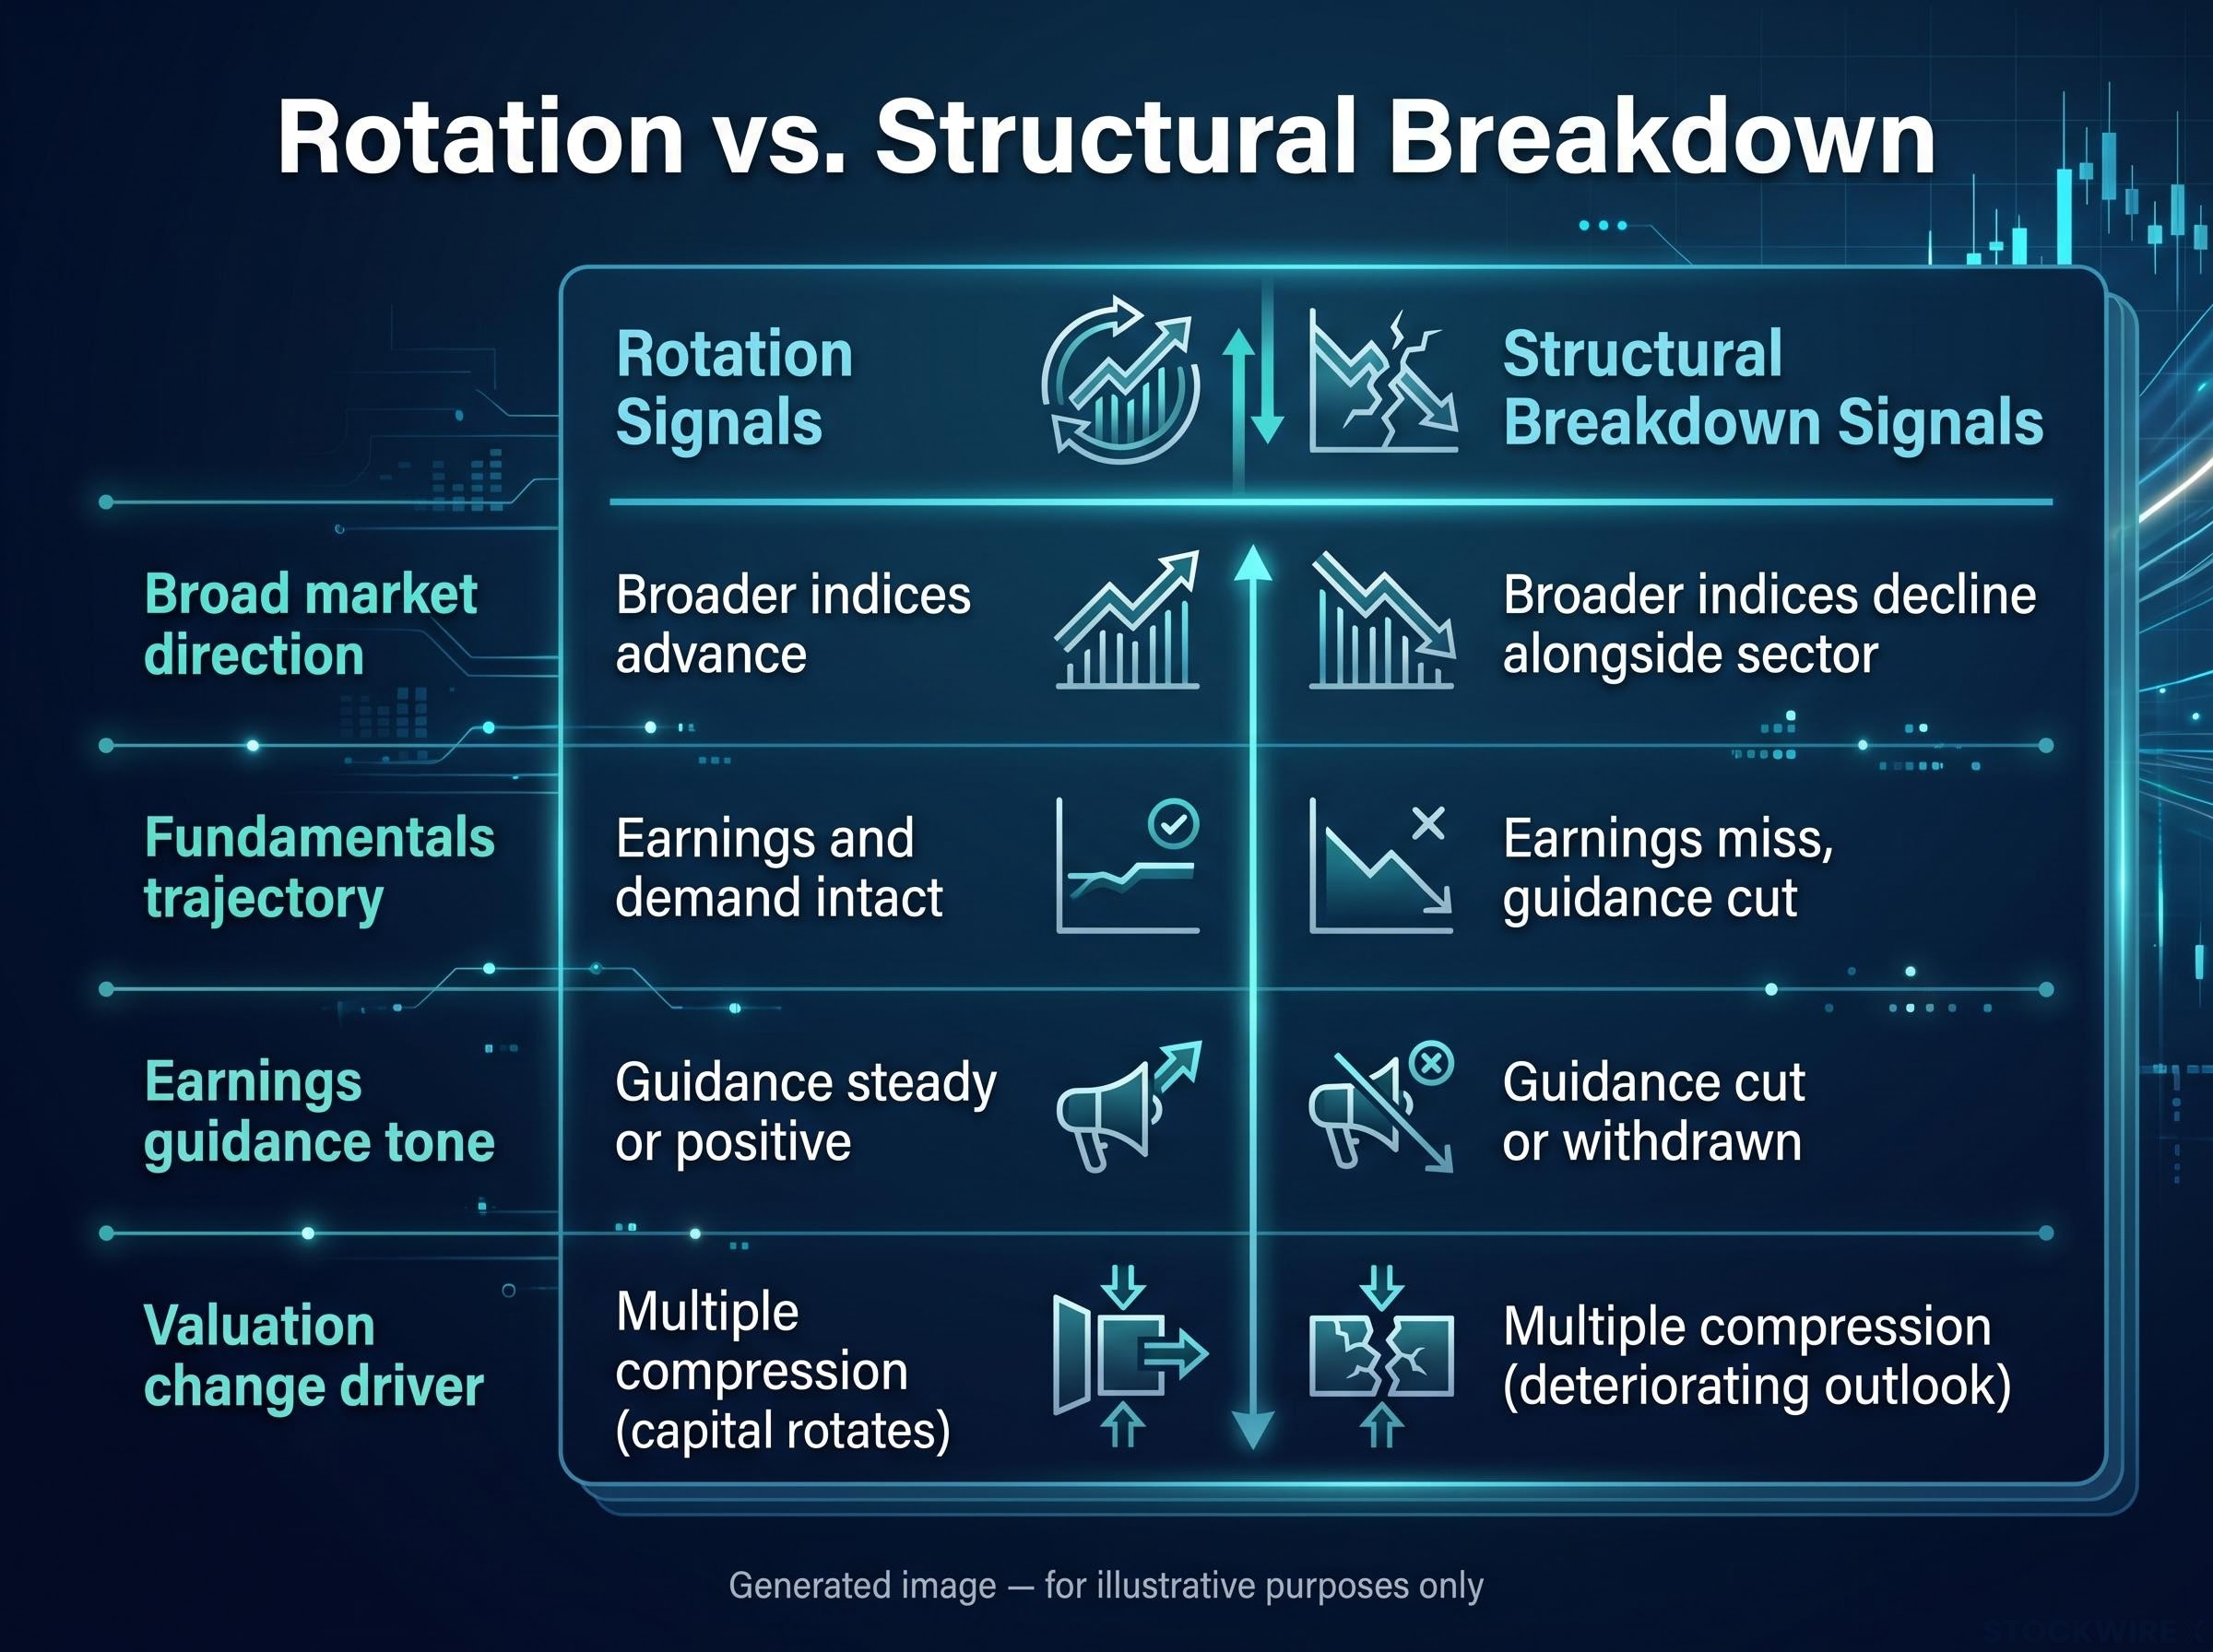
| Characteristic | Rotation signals | Structural breakdown signals |
|---|---|---|
| Broad market direction | Broader indices advance while affected sector retreats | Broader indices decline alongside the sector |
| Fundamentals trajectory | Earnings and demand data remain intact or improving | Earnings miss, guidance cut, demand deteriorating |
| Earnings guidance tone | Forward guidance steady or positive; market re-rates on valuation | Forward guidance cut or withdrawn; market re-rates on fundamentals |
| Valuation change driver | Multiple compression as capital rotates elsewhere | Multiple compression driven by deteriorating earnings outlook |
The rotation frame matters for how you act. If this is a crowded trade consolidating, trimming into weakness is a different decision than selling out of a structural breakdown. Confusing the two is how investors exit good positions at the wrong moment.
Two specific geopolitical triggers drove the oil move in early July, and naming them matters because each one carries a different kind of persistence:
The Strait of Hormuz accounts for approximately 20% of global petroleum liquids consumption, according to the U.S. Energy Information Administration. A “severe” threat rating on that corridor is not a theoretical risk.
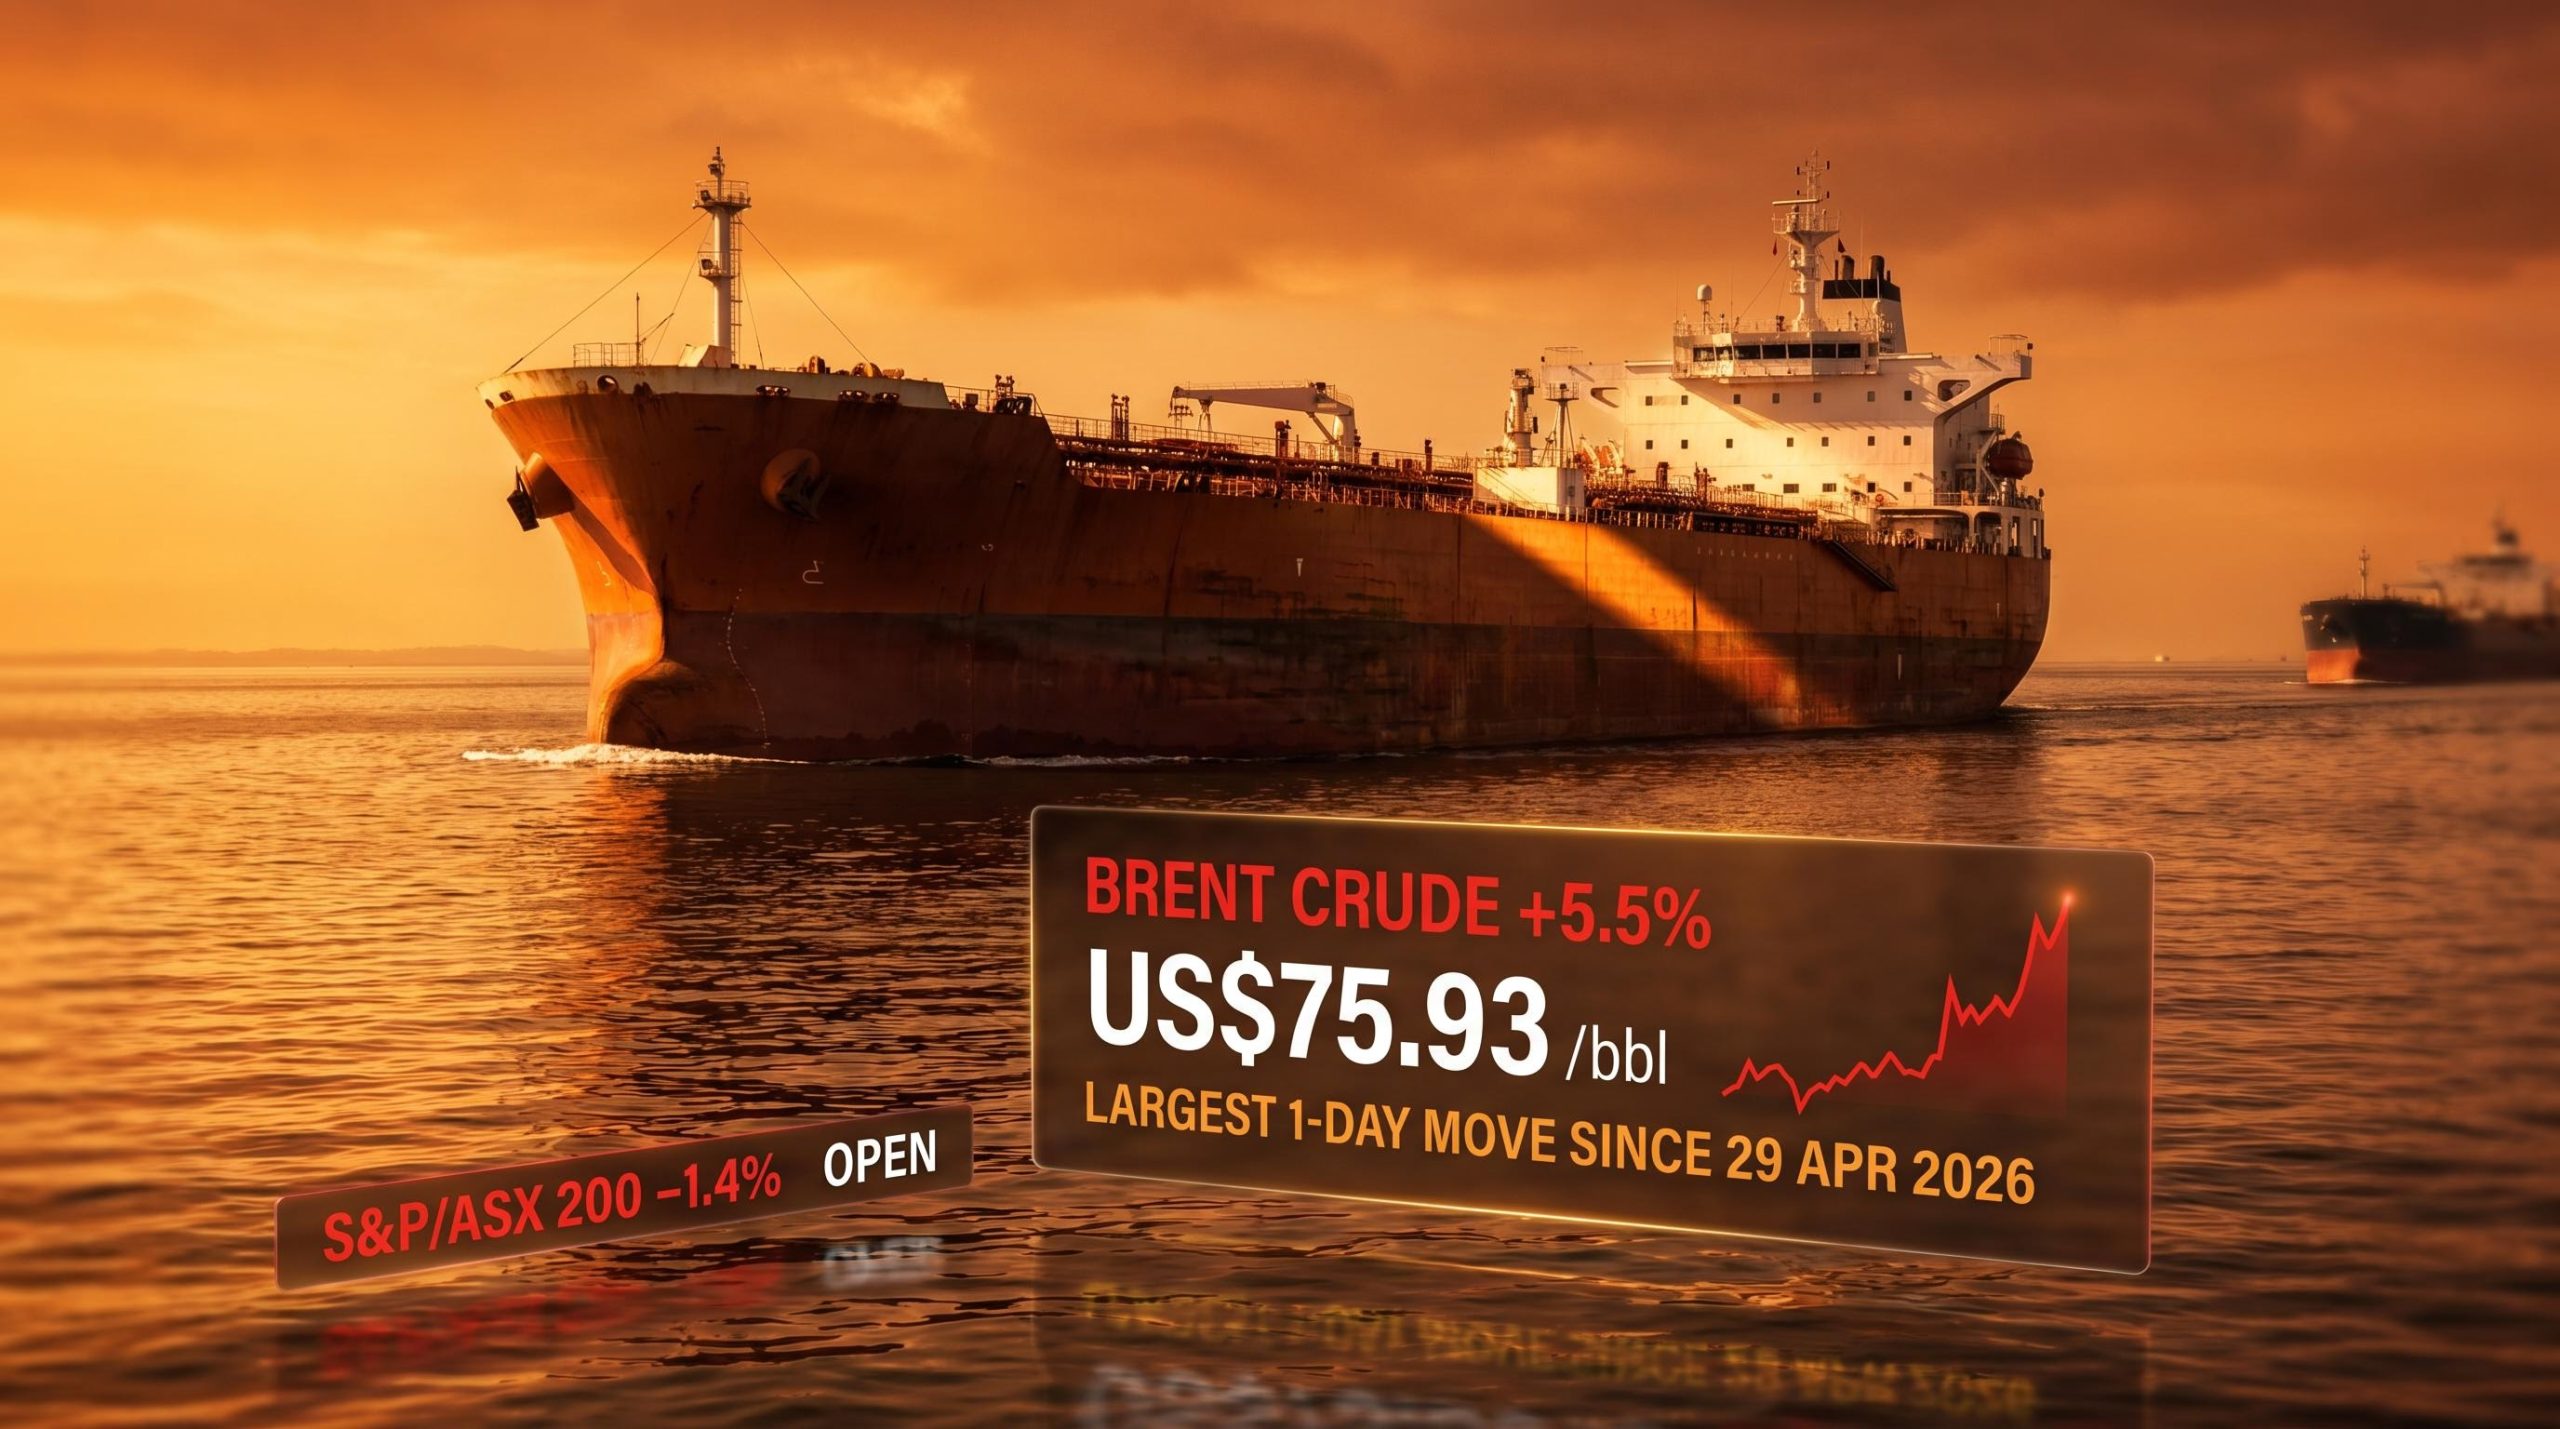
Crude, which had been sitting under $70 per barrel in the weeks prior, posted a gain of roughly 5% across the first days of July as these developments landed. Recent crude has traded in the $68-$74 per barrel range amid ongoing volatility.
What makes this move significant is not the dollar amount. It is what the move tells you about the prior assumption. Markets had spent months pricing in stable, low energy costs. That assumption supported the disinflation narrative, kept the Federal Reserve’s rate-cut path looking credible, and underpinned the high multiples on growth stocks. A 5% single-week oil move on a sanctions decision and a threat rating change tells you that assumption was fragile, and the market has now visibly priced that fragility in.
Markets are pricing in probabilities of disruption, not actual disruptions. The risk premium can stay elevated or expand further even without a physical supply event.
The distance from the Strait of Hormuz to your rate-sensitive holdings is shorter than it appears. The transmission chain works in a specific sequence, and understanding it helps you anticipate the impact rather than react after the damage is done:
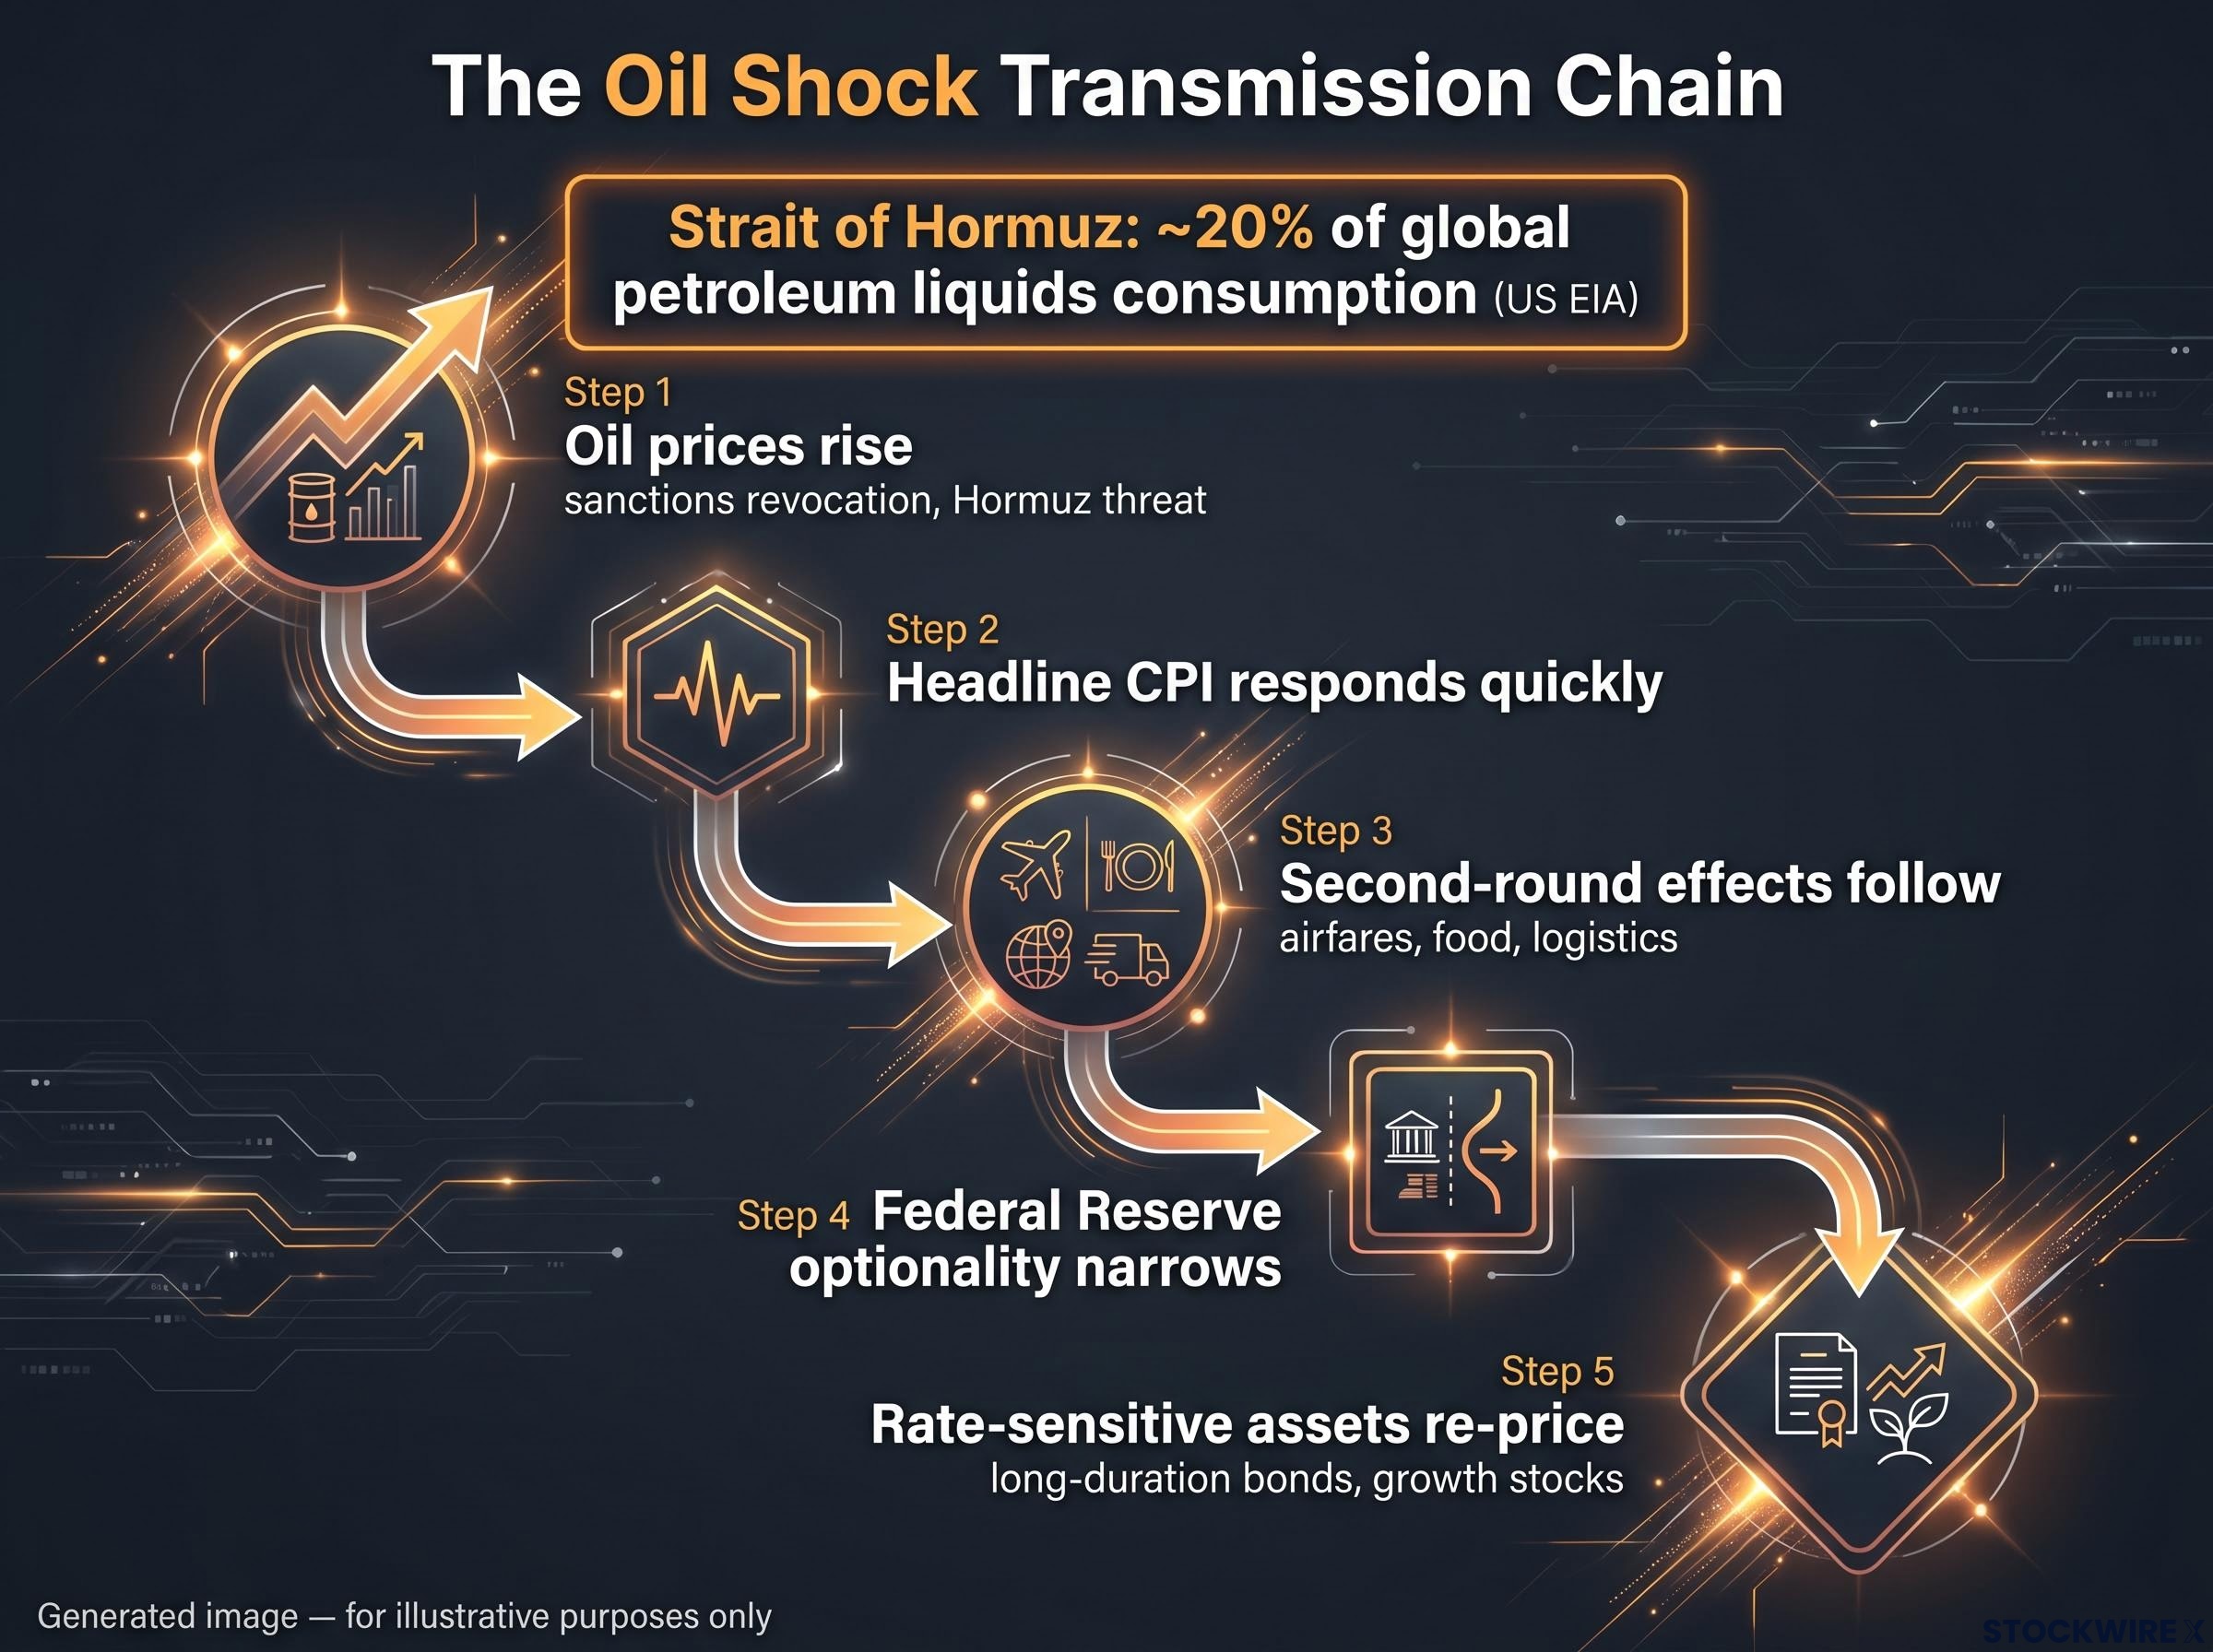
Academic and policy research on oil supply shocks consistently finds this pattern: geopolitically driven disruptions push prices higher, weigh on real economic activity, and tighten financial conditions via higher inflation and risk premia. The chain is well established. The question is always whether the current shock is large enough and persistent enough to activate it fully.
The 14 July CPI release, confirmed by the US Bureau of Labor Statistics release schedule, covers June data. It will be the first reading that reflects whether energy cost pressures are already feeding into the broader price level.
A hotter-than-expected result, layered on top of the oil move, could force rapid re-pricing of rate expectations. That re-pricing would hit rate-sensitive assets quickly, from long-duration bonds to the high-multiple growth stocks that have led the market for months. The transmission chain from Hormuz to your portfolio could show up in this single data print.
Neither the chip pullback nor the oil surge is a crisis on its own. Semis remain materially higher year-to-date. One week of oil gains does not make a trend. Viewed in isolation, each event is manageable.
The signal is in the simultaneity. These two developments are testing two separate assumptions that had been working in investors’ favour through mid-2026: that AI winners would keep carrying performance, and that low, stable energy prices would keep inflation and rates supportive.
This is a stress test of two assumptions simultaneously, not two separate stories. The portfolio’s resilience is being tested in a way that single-factor analysis would never reveal.
When both assumptions come under pressure at the same time, the portfolio’s hidden vulnerabilities become visible. The concentrated growth theme that powered returns now represents concentrated risk. The benign macro backdrop that supported high multiples now faces a direct challenge from energy-driven inflation.
The current environment demands three specific risk management disciplines:
The simultaneity is the signal. It tells you the portfolio’s foundations deserve examination, not that the house is falling down.
Three specific catalysts arriving in July and August will test the two assumptions this analysis has identified. Each one is a decision input, not background noise:
These are not events to watch passively. Each one is a direct test of a specific assumption in your portfolio. Knowing in advance what you are looking for, and what a hot versus cool outcome means for your holdings, is the difference between disciplined updating and reactive repositioning.
This article is for informational purposes only and should not be considered financial advice. Investors should conduct their own research and consult with financial professionals before making investment decisions. Past performance does not guarantee future results. Forward-looking statements about inflation, interest rates, and earnings trajectories are subject to change based on market developments and economic conditions.
Two assumptions that were invisible when markets were calm, that AI dominance would continue carrying portfolios and that energy costs would stay benign, are now visible precisely because they are under pressure at the same time. That visibility is the analytical value of this moment.
The investors who benefit from periods like this are the ones who use the stress test as a diagnostic tool. Not to predict what happens next, but to understand what their portfolio was actually built on and whether those foundations still hold.
Review concentration. Revisit macro assumptions. Treat the 14 July CPI and earnings season as structured decision inputs rather than noise to react to. The data arriving over the next four weeks will not tell you the future, but it will tell you whether the assumptions embedded in your portfolio are still earning their place.
—
It means the market had already priced in those results, and possibly better outcomes. When Samsung reported a roughly 19-fold year-over-year profit jump and shares still declined, it signalled that the marginal buyer had less incentive to step in and the marginal seller had a clean exit at elevated prices.
A rotation means capital is moving from winning sectors to laggards while broader markets continue advancing; a structural breakdown means investors are leaving equities altogether because fundamentals have deteriorated. The two look similar in the affected sector short-term but demand completely different portfolio responses.
Higher oil prices feed directly into headline CPI through petrol and transportation costs, then ripple into airfares, food, and logistics through second-round effects. If inflation is already running above target, an energy shock narrows the Fed's room to cut rates, causing markets to re-price rate expectations more hawkishly and pressuring long-duration bonds and high-multiple growth stocks.
The Strait of Hormuz accounts for approximately 20% of global petroleum liquids consumption according to the U.S. Energy Information Administration, making it the single most critical oil transit corridor in the world. A severe threat rating on that route introduces a risk premium into crude prices even before any physical supply disruption occurs.
The 14 July CPI release covering June data is the most immediate test: a hotter-than-expected result would signal energy-driven inflation is already broadening, forcing rapid re-pricing of rate expectations. Semiconductor and AI-linked earnings reports through July and August will then determine whether elevated sector valuations are justified or need to re-rate lower.