
Major equity benchmarks continue to hold near unprecedented valuations, projecting an image of unshakeable market confidence. Yet beneath the surface of this resilience, traditional market frameworks are signalling underlying fragility. The Dow Theory framework, an approach focusing on the relationship between manufacturing and shipping, highlights a glaring divergence in current trading patterns.
Following a record peak in transportation stocks on April 21, the industrial average failed to follow suit and instead left a highly visible unresolved gap. This analysis decodes how traditional technical analysis interprets these bizarre equity moves and what they reveal about structural index mechanics. The stakes are particularly high given the backdrop of broader macroeconomic uncertainty, with ongoing Middle Eastern conflicts threatening global supply chains. Understanding this technical divergence offers vital context for investors evaluating whether the ongoing rally rests on solid economic foundations or mere speculative momentum.
The Core Mechanics of Industrial and Transportation Confirmation
The foundational logic of this technical framework rests on a tangible economic reality: manufacturing goods is only profitable if those products actually reach their final markets. By looking past abstract financial jargon, the concept grounds market speculation in the physical movement of freight across rail, air, and sea. According to traditional technical analysis, a genuine economic expansion requires synchronicity between the industrial sectors producing goods and the transportation networks delivering them.
If factories are operating at capacity but shipping networks sit idle, the economic growth narrative lacks physical validation. This relationship forms the core of the market’s oldest confirmation signal. The framework serves as a vital diagnostic tool for validating whether an upward market trajectory is structurally sound or merely a temporary, speculative rally. Analysts look for simultaneous peak achievements across both sectors to confirm that broad economic demand is genuinely driving equity valuations higher.
To formally validate a broader upward market movement, technical analysts require the following sequential criteria:
One major benchmark, typically the industrial average, establishes a new closing high. The complementary benchmark, usually the transportation average, subsequently reaches its own corresponding high within a reasonable timeframe. Both indices must hold these elevated levels during subsequent market pullbacks, establishing new support levels. The joint breakout confirms the underlying primary trend, signalling that physical economic activity supports current equity valuations.
When these benchmarks move in opposite directions, the resulting divergence flashes an immediate warning sign to market participants. A failure to achieve joint confirmation suggests that the broader economic engine is misfiring, leaving equity markets highly vulnerable to sharp corrections.
For readers wanting to examine how other leading indicators are currently misfiring, our detailed coverage of S&P 500 warning signals explores the fragile underpinnings of the broader equity rally.
When big ASX news breaks, our subscribers know first
The January Breakout and the Spring Fracture
Market sentiment at the start of 2026 painted a picture of unified optimism. A formal buy signal was triggered in early January 2026 when both the industrial and transportation indices broke out together for the first time since 2021. The industrial benchmark had maintained a sustained uptrend since the previous August, while transportation stocks surged approximately 7% to reach their first record high in over a year.
This early synchronicity fractured completely by mid-Spring.
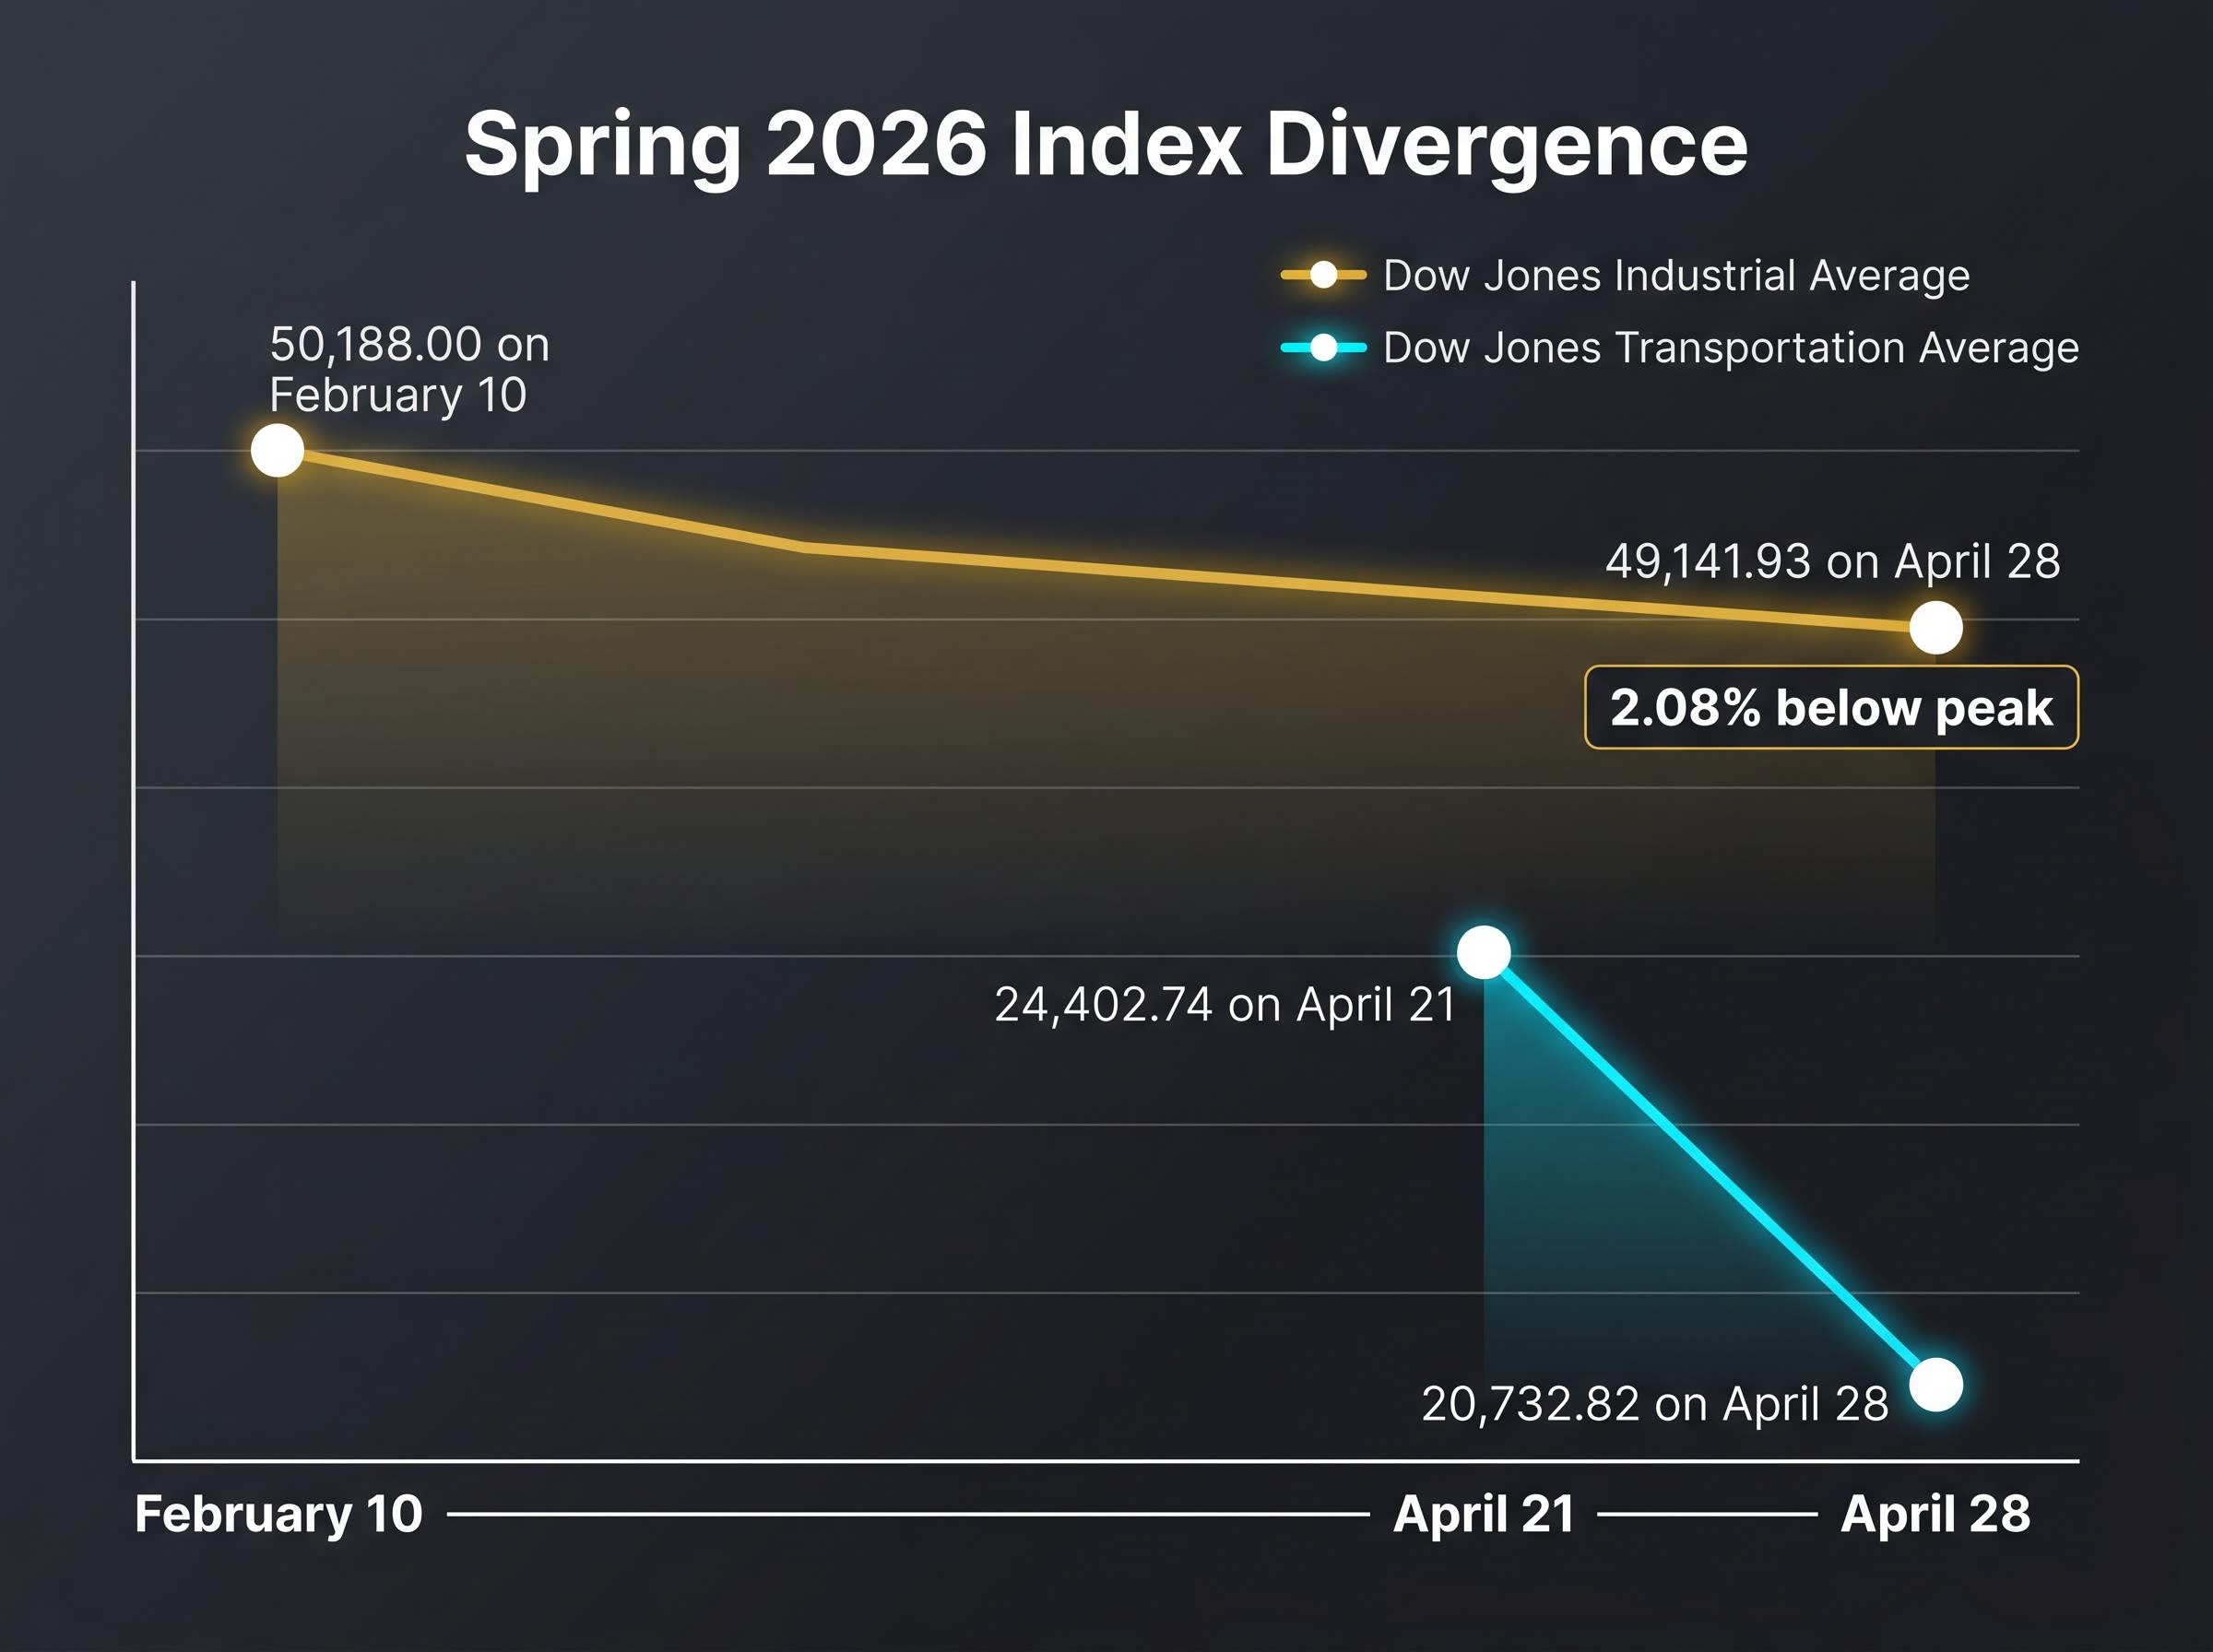
The industrial benchmark reached a recent peak closure on February 10 at approximately 50,188. However, it subsequently stalled and failed to push higher as the quarter progressed. Meanwhile, the transportation index went on a historic tear, reaching an unprecedented peak on April 21. This created a stark divergence, as the industrial index failed to confirm the transport sector’s record-breaking momentum. By late April, the structural fracture in the market became undeniable as transport valuations collapsed violently.
| Index | 2026 Peak Date | Peak Valuation | April 28 Valuation |
|---|---|---|---|
| Dow Jones Industrial Average | February 10 | 50,188.00 | 49,141.93 |
| Dow Jones Transportation Average | April 21 | 24,402.74 | 20,732.82 |
As of the April 28 market close, the industrial index sits roughly 2.08% below its February high. The rapid deterioration of the transportation benchmark from its April peak demonstrates exactly how quickly a confirmed bull market signal can dissolve into uncertainty.
The Avis Anomaly and Index Distortion
While macroeconomic trends initially appeared to drive the divergence, a closer examination reveals mechanical vulnerabilities within the index itself. The transportation average operates as a price-weighted index, meaning stocks with higher share prices exert disproportionate influence over the benchmark’s movement. This structural quirk makes the index highly susceptible to massive individual stock fluctuations that have nothing to do with global shipping health.
The CFA Institute framework for price-weighted index mechanics illustrates how a single inflated security can completely distort the perceived performance of a benchmark, tricking investors who rely solely on headline figures.
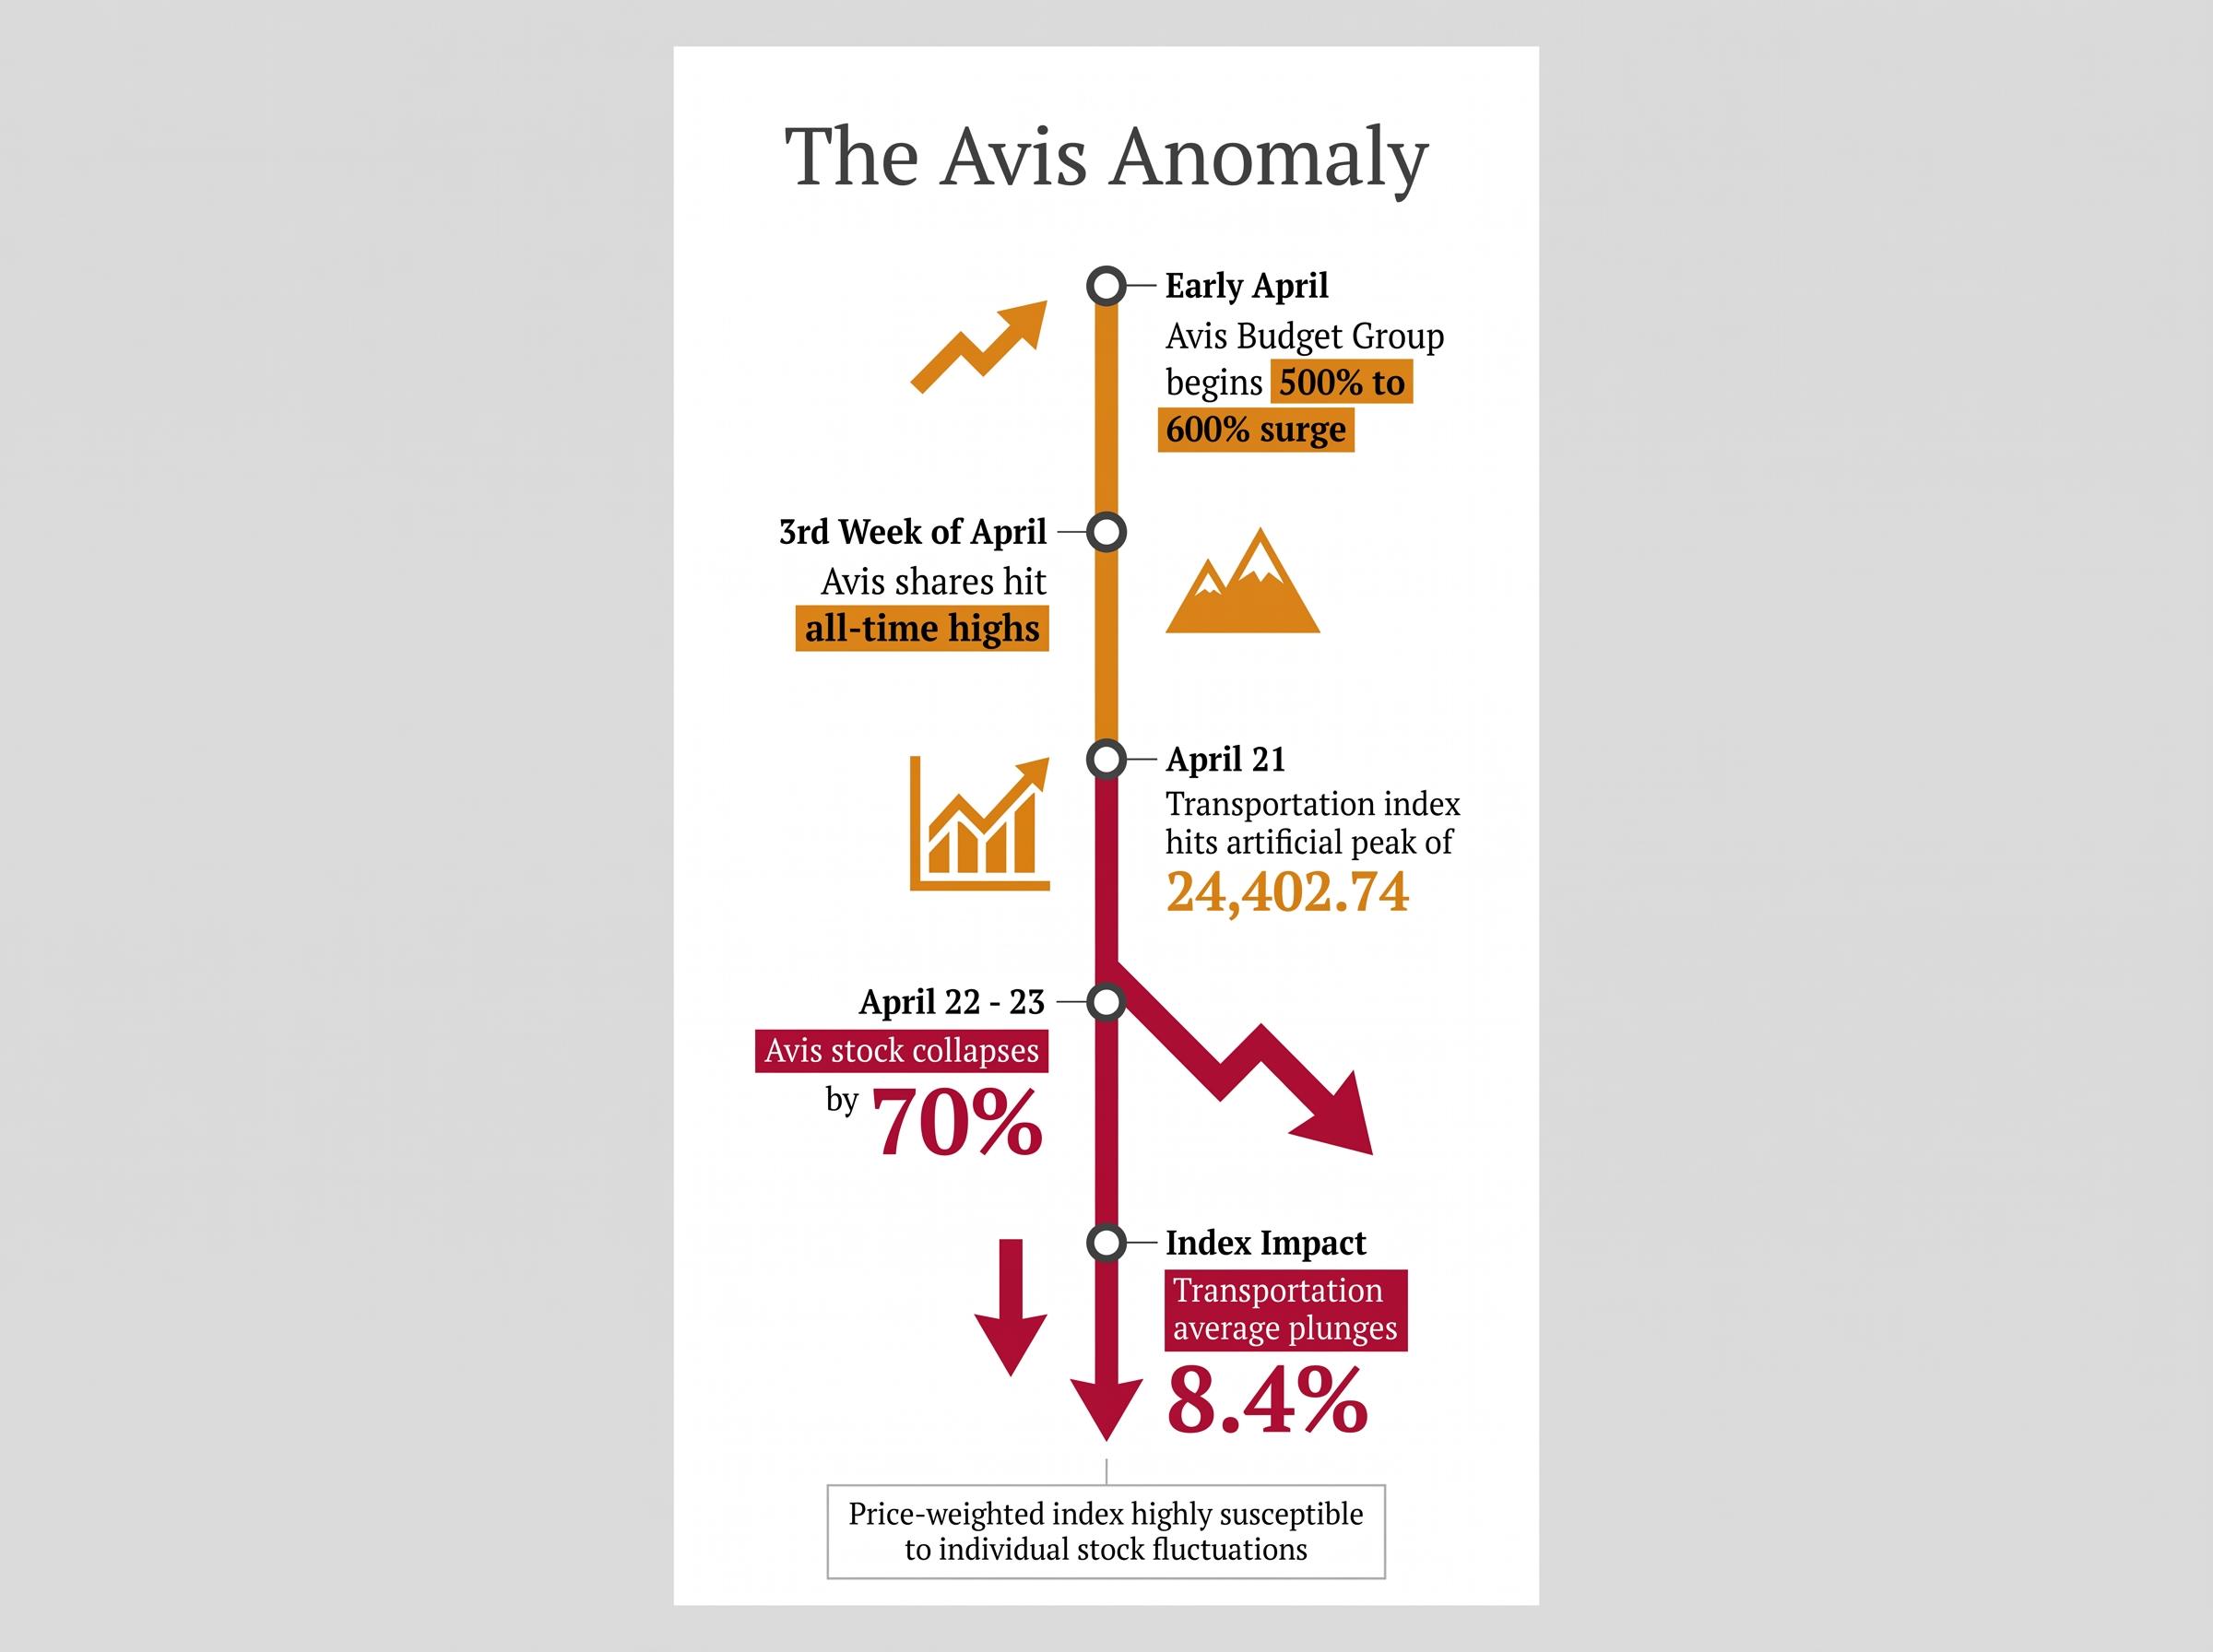
The primary catalyst for the late April index distortion was an extreme speculative event surrounding Avis Budget Group. The rental car company experienced a massive short squeeze, driving a 500% to 600% surge in its share price from early April to its peak. This single speculative anomaly pulled the entire transportation benchmark to artificial record highs.
The sequence of the short squeeze and subsequent market crash unfolded with unprecedented speed:
- Retail speculation and short covering drove Avis shares to all-time highs by the third week of April.
- The transportation index reached its historic 24,402.74 peak on April 21, artificially inflated by the Avis share price surge.
- Avis stock collapsed by 70% over a brutal two-day period between April 22 and April 23.
- The broader transportation average plunged 8.4% in direct response to the Avis unwinding.
This dramatic collapse was completely disconnected from fundamental shipping or transportation health.
Avis was actively dealing with significant revenue misses and a high debt burden at the time of the squeeze. Investors who took the headline index drop at face value risked misinterpreting a mechanical flaw as a macroeconomic crisis. Because the transport average calculates its value based on absolute share price rather than market capitalisation, the Avis volatility overpowered the steady performance of massive freight and rail operators. This distortion highlights the danger of relying solely on raw index numbers during periods of intense speculative trading.
Debating the Signal in a Complex Macro Environment
The drastic unwinding of the transportation index has generated fierce debate among financial strategists regarding the true state of the market. Strict technical analysts view the 8.4% plunge as a severe danger signal that validates the industrial average’s failure to break out. From this perspective, the inability of the two indices to confirm one another is a historical precursor to a broader market correction.
Conversely, fundamental analysts argue that the recent transportation plunge is merely a speculative outlier. Because the steep decline was artificially driven by a single stock rather than systemic shipping weakness, many experts believe it does not reflect true underlying economic deterioration. Broader market gauges like the S&P 500 and the Nasdaq have remained resilient, supporting the thesis that the transportation volatility is an isolated mechanical glitch.
Macro Risks Overshadowing Technicals
Domestic technical indicators do not exist in a vacuum, and external macroeconomic factors are heavily complicating the current analysis. Market strategists note that broader uncertainty remains elevated due to escalating geopolitical tensions related to the Iran war.
Bloomberg Intelligence tracking of global freight route disruptions shows how sudden shipping lane and airspace closures create tangible bottlenecks for transport operators, introducing severe real-world headwinds that complicate technical chart readings.
“The transportation index distortion forces market participants to look past the charts and focus on physical supply chains. The real threat to the market is not a rental car short squeeze, but the potential for rising oil prices and geopolitical conflict to structurally impair global freight routes.”
This complex environment requires investors to evaluate competing financial news narratives with a highly critical eye. Blending chart-based theory with real-world geopolitical realities is required when traditional benchmarks produce conflicting signals. The true test of market health will depend on how industrial sectors absorb these external shocks in the coming weeks.
Why the Next Move in Industrials Matters Most
The immediate focus for technical analysts now rests entirely on whether the industrial index can close its 2.08% gap. For the broader upward market trajectory to be validated, industrial stocks must push past their February highs to confirm the physical economic demand required for a sustained rally. A continued failure to breach this level would lend credibility to the recent transportation weakness, suggesting the structural fracture is real.
Technical indicators must always be interpreted alongside structural index mechanics and global macroeconomic events. Investors should monitor industrial performance in the coming weeks, paying close attention to how manufacturing sectors respond to ongoing Middle Eastern volatility.
Historically, the impact of elevated fuel costs tends to manifest over a six-month lag, suggesting the true economic damage of current shipping disruptions may not yet be priced into manufacturing stocks.
This article is for informational purposes only and should not be considered financial advice. Investors should conduct their own research and consult with financial professionals before making investment decisions.