
The old playbook for buying Singapore bank stocks was simple: wait for rates to rise, watch margins fatten, collect the earnings. That playbook is now closed.
Yet something unusual is happening. Sector earnings are still climbing, and they are doing it without any help from expanding margins.
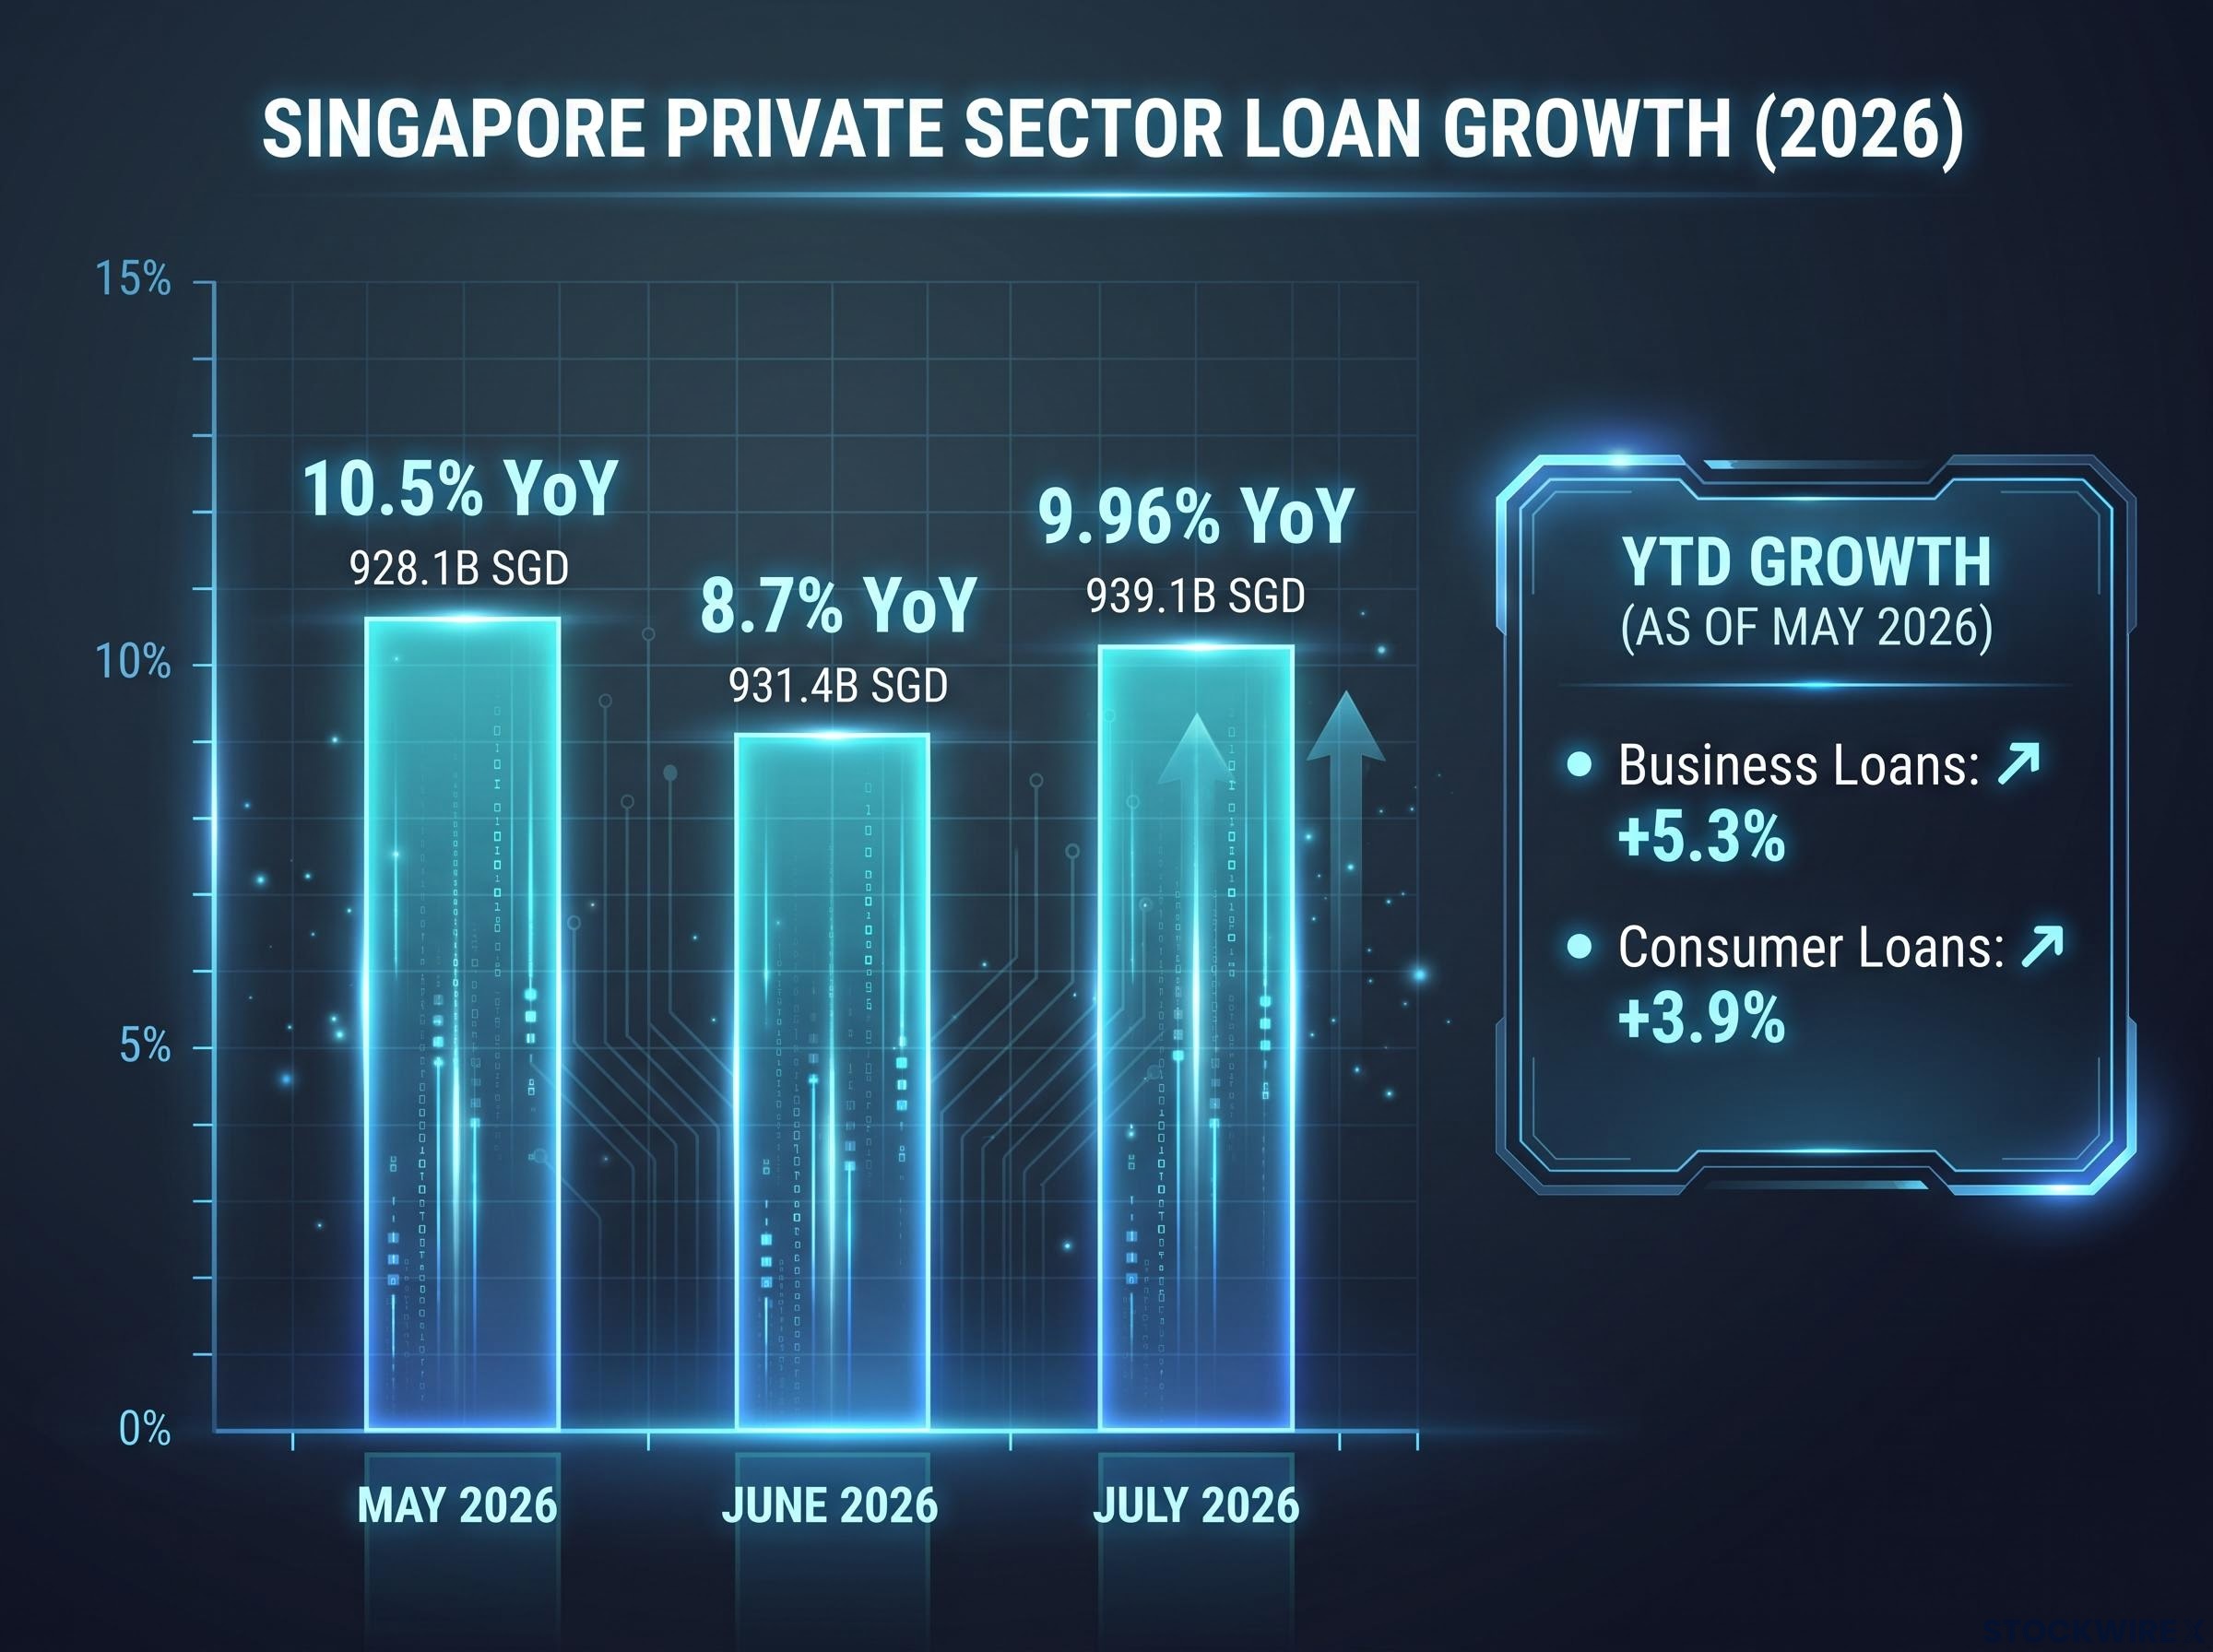
The reason sits in the credit data. In July 2026, Singapore system loan growth reached 9.96% year-on-year, the first time it has touched double digits since the COVID era, pushing nominal private sector loans past 939 billion SGD and rewriting the earnings story for every bank on the exchange.
This shift, from rate-driven margins to volume-driven lending, changes how you should read the sector entirely. Understanding it is the difference between modelling realistic returns and chasing a number that will not hold.
This analysis gives you a framework for judging how the volume-over-margin pivot affects your bank holdings, and helps you work out whether DBS or OCBC offers the better total-return profile for the way you actually invest.
Breaking down the double-digit credit expansion
Start with the scale of what has happened, because the numbers are genuinely striking. According to Phillip Securities Research, July’s 9.96% year-on-year print marked the first breach of the 10% threshold since the pandemic, taking nominal private sector loans to a record 939.1 billion SGD, up from 931.4 billion SGD in June.
The path there was rapid. May 2026 ran at 10.5% year-on-year, June cooled to 8.7%, and July surged back through the ceiling. Underneath the headline, business loans were up 5.3% year-to-date and consumer loans up 3.9% year-to-date as of May, per DBS research.
“Volume is now doing what interest margin cannot.” Phillip Securities Research, 6 September 2026 sector note
Here is the part that matters for your positioning. DBS research explicitly ties this surge to an upgraded Singapore economic growth outlook, which means the lending boom is cyclical, a response to stronger domestic business activity, rather than a permanent change in how banks operate.
The Singapore economic growth outlook underpinning that loan surge has strengthened further since mid-year, with August 2026 NODX printing at 46.2% year-on-year, the fastest pace since October 1988, providing external trade confirmation that the domestic lending cycle has genuine macro support behind it.
| Month (2026) | YoY Growth | Key Driver |
|---|---|---|
| May | 10.5% | Strong business loan demand |
| June | 8.7% | Broad-based credit uptake |
| July | 9.96% | Record nominal loan levels |
Management teams themselves treat this pace as exceptional. Phillip’s July note flagged that even as actual growth prints arrived near double digits, banks were still framing guidance in low- to mid-single-digit territory.
You should read this loan surge as a temporary cyclical buffer protecting your dividend yields, not a foundation. Modelling double-digit credit expansion into your long-term earnings projections is how you end up disappointed when the cycle normalises.
When big ASX news breaks, our subscribers know first
The mechanics of margin compression in a flat rate environment
To understand why volume had to step up, you need to understand what stepped down. The answer is the Singapore Overnight Rate Average (SORA), the benchmark that anchors how much banks earn on their lending.
When SORA rises, banks charge more on loans while deposit costs lag behind, and the gap between the two widens. That gap is the Net Interest Margin (NIM), the profitability the bank earns on every dollar it lends. Multiply that margin across the whole loan book and you get Net Interest Income (NII), the core earnings engine.
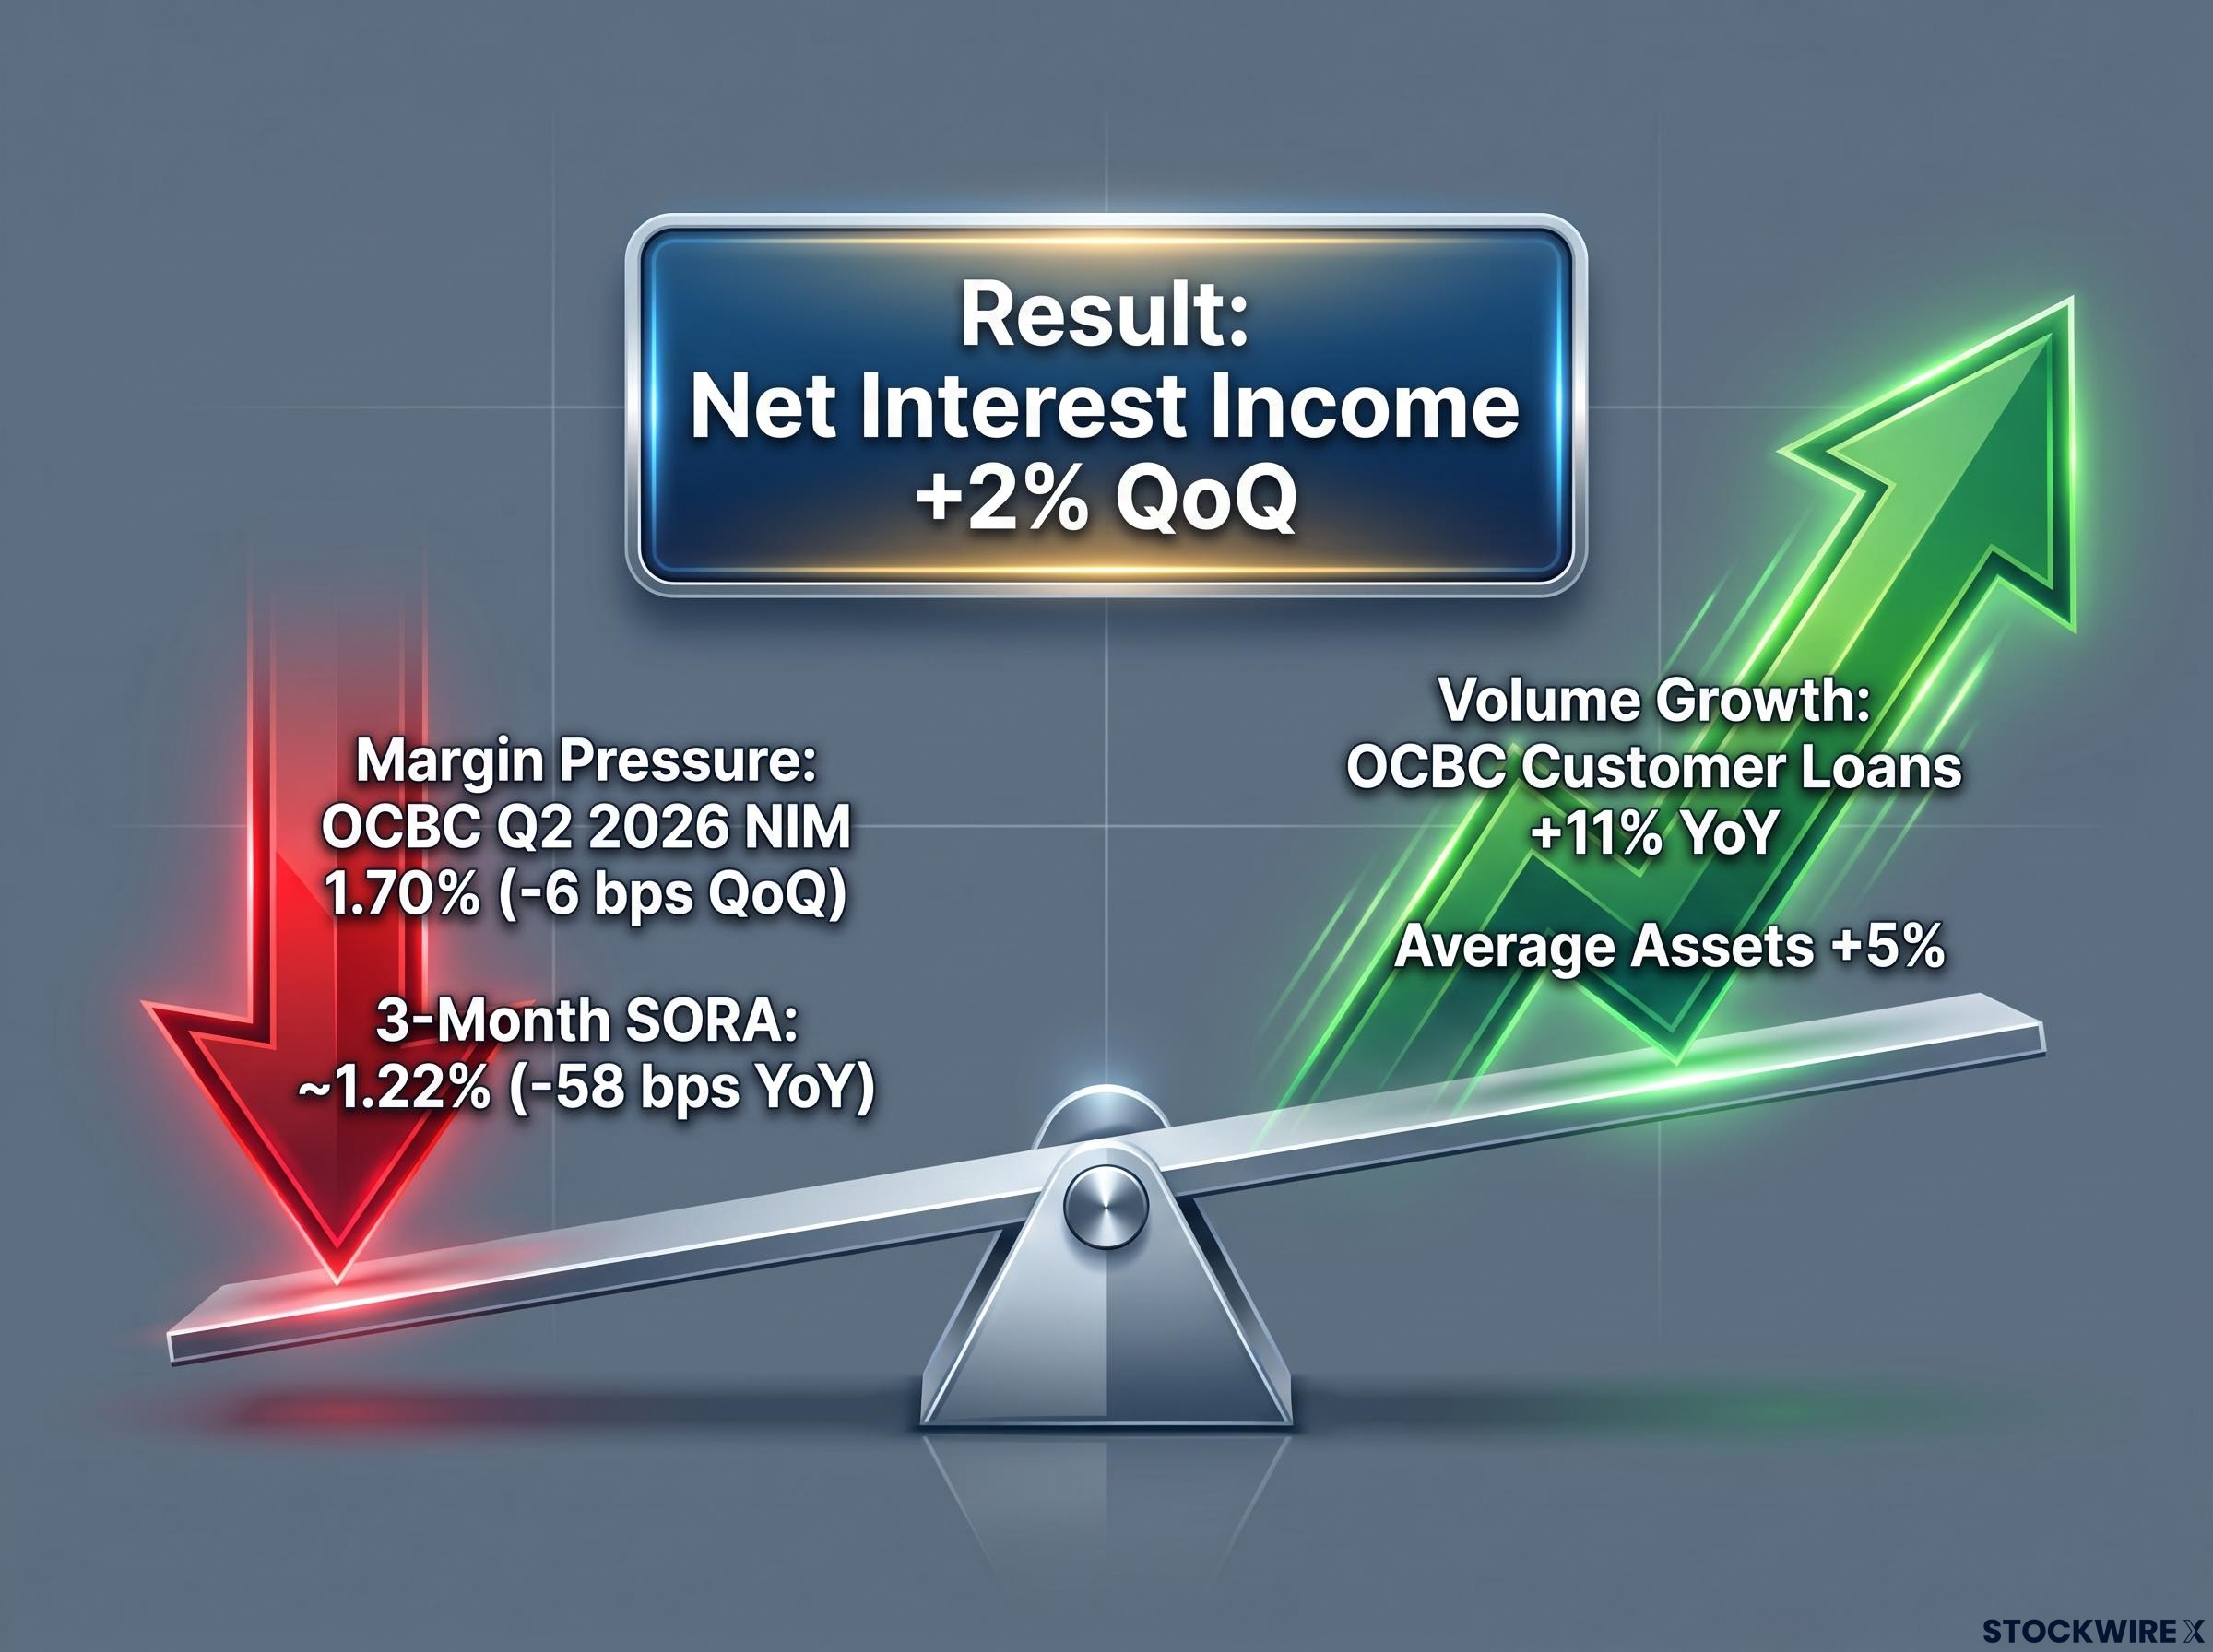
For two years, rising rates handed banks free NIM uplift. That era is over. The 3-month compounded SORA sat at roughly 1.22% as of 23 September 2026, and although it has drifted higher for four consecutive months, it remains 58 basis points below the prior year’s comparable level, per Phillip Securities Research.
MAS monetary policy operates through the Singapore dollar nominal effective exchange rate rather than an interest rate lever, which means SORA movements are a downstream consequence of currency settings rather than a direct policy tool, and this distinction matters when you are modelling how long the current rate environment persists.
A flat, structurally lower rate environment means no more free margin. So banks turned to the other lever.
How volume offsets margin
The mechanics are arithmetic. If profitability per loan falls but the number of loans rises fast enough, total income holds steady or grows.
OCBC’s Q2 2026 results show this in practice. Its NIM compressed 6 basis points quarter-on-quarter to 1.70%, and fell 25 basis points year-on-year across the first half to a group NIM of 1.73%. Yet net interest income still grew 2% quarter-on-quarter, because average assets rose 5% and customer loans climbed 11% year-on-year.
Net Interest Income is shaped by three moving parts:
- The size of the loan book (more loans, more interest earned)
- The margin on each loan (the NIM spread between lending and funding rates)
- The funding mix (cheaper deposits versus costlier wholesale funding)
– This is why bank stocks are no longer a simple rate trade. You now have to evaluate these institutions on their ability to originate loans and gather cheap deposits, not on their sensitivity to the next central bank move.
The practical takeaway for reading earnings reports: do not panic when you see NIM compressing. If NII is holding or growing on the back of volume, the earnings engine is still running. Compressing margins alongside stable income is exactly the pattern this cycle produces.
Tactical portfolio positioning between DBS and OCBC
The two banking giants now represent genuinely different tactical bets, and choosing between them comes down to what you want your bank exposure to do.
DBS is the margin-resilience play. Its Q2 2026 NIM held at 1.87%, falling just 2 basis points quarter-on-quarter, a stability that Phillip and others attribute to hedging strategies and disciplined balance-sheet growth.
OCBC is the growth-momentum play. Its customer loans grew 11% year-on-year, making it the loan-growth leader among the local trio, and it is the only Singapore bank guiding for stable to improving FY2026 income, driven by double-digit non-interest income growth.
Both earned analyst upgrades. Phillip Securities Research raised its DBS target price to 85.00 SGD and OCBC to 33.20 SGD, lifting sector PATMI (profit after tax and minority interests) estimates by roughly 1%, citing stronger lending momentum. Both banks are also pivoting toward wealth management and fee income to supplement lending as margins flatten.
| Bank | Price Target (Phillip) | Q2 2026 NIM | Key Strength |
|---|---|---|---|
| DBS | 85.00 SGD | 1.87% | Margin resilience, hedging, fixed DPS policy |
| OCBC | 33.20 SGD | 1.70% | Loan growth leader, wealth and non-interest income |
Both sit in a similar income bracket, with the sector’s estimated FY2026 dividend yield at around 3.9%. DBS backs its yield with a fixed dividend-per-share policy and a consistent capital-return record; OCBC pairs its yield with faster growth and residual potential for further capital returns.
So the decision is yours to frame. If you want defensive margin protection and a predictable dividend, DBS fits. If you can accept slightly higher funding-cost risk to capture aggressive loan and wealth-management upside, OCBC is your name.
Vulnerabilities in a high-volume lending cycle
Before you deploy capital, understand what a volume-heavy strategy quietly puts at risk. The same lending surge that props up earnings also introduces pressure points that can turn quickly.
The most immediate is funding cost. In August 2026, UOB raised its 12-month promotional deposit rate by 10 basis points to 1.40%, a clear signal that deposit pricing has stopped falling, while OCBC explicitly cited higher wholesale funding costs as a drag on its Q2 performance.
Deposit competition is the mechanism that most directly converts loan growth success into NIM pain: Australia’s Big Four experienced this dynamic acutely in May 2026, shedding up to 14% as margin misses driven by deposit pricing pressure arrived faster than revenue offsets could compensate.
Here are the three risks to watch, ranked by how directly they threaten the current earnings narrative:
- Deposit costs. To fund aggressive loan growth, banks compete harder for deposits. If that competition pushes funding costs up faster than loan yields, NIMs compress further and dividend headroom shrinks.
- Macro dependency. DBS research ties the loan surge directly to an upgraded growth outlook, which means the whole story rests on the domestic economy holding up. A cyclical downturn removes the volume that is offsetting margin compression.
- Credit quality. Saxo Bank notes asset quality remains healthy, but credit problems lag. Fast, broad-based loan expansion can seed non-performing loans that only surface as the cycle matures.
– The execution risk sits on top of all three. Banks are trying to shift their valuation story from a rate trade to a structural wealth-management business, and if fee-income growth or capital-return policies disappoint, the market may not reward the transition.
The action for you is straightforward: monitor deposit-rate competition across the sector. If banks start overpaying for deposits to fund these new loans, your expected dividend payouts will erode faster than the headline loan-growth numbers suggest.
Setting portfolio expectations for the late 2026 wealth pivot
The Singapore banking sector has quietly changed character. It has gone from a straightforward beneficiary of rising rates to a volume-dependent, increasingly wealth-driven story, and double-digit loan growth has been the bridge carrying earnings across the gap left by margin compression.
That bridge is doing its job, but it was built for a cyclical moment, not a permanent one. The window it creates is your opportunity to reposition before growth normalises back toward the mid-single digits that banks and analysts consider normal.
So the decision moves to you. Review your current financial-sector exposure and ask whether your chosen bank matches your tolerance for risk: DBS for margin defence and dividend predictability, OCBC for growth and wealth-management upside.
For investors who conclude that the current lending cycle raises their concentration risk in Singapore financials, our dedicated guide to portfolio diversification beyond SGX financials examines how Swiss blue-chip exposure can access healthcare, consumer staples, and luxury goods sectors with close to zero overlap with the local banking weighting.
This article is for informational purposes only and should not be considered financial advice. Investors should conduct their own research and consult with financial professionals before making investment decisions.
Past performance does not guarantee future results. Financial projections are subject to market conditions and various risk factors.