As of 25 September 2026, financial markets are assigning an 86% probability to a rate hike at the Reserve Bank of Australia’s Board meeting on 29 September, four days from now. That is not a distant forecast. It is a live number attached to a specific decision.
The problem is that this preview sits between two signals pointing in opposite directions. Trimmed-mean inflation is stuck at 3.6%, comfortably above the RBA’s target and pushing the case for more tightening. At the same time, unemployment has just climbed to its highest level in five years, the sort of reading that would normally argue for a pause.
This piece gives you the numbers, the competing interpretations, and the sector-level implications, so you can assess what the RBA’s decision on 29 September actually means for your portfolio and the wider economy before the meeting lands.
What markets are pricing in ahead of the 29 September decision
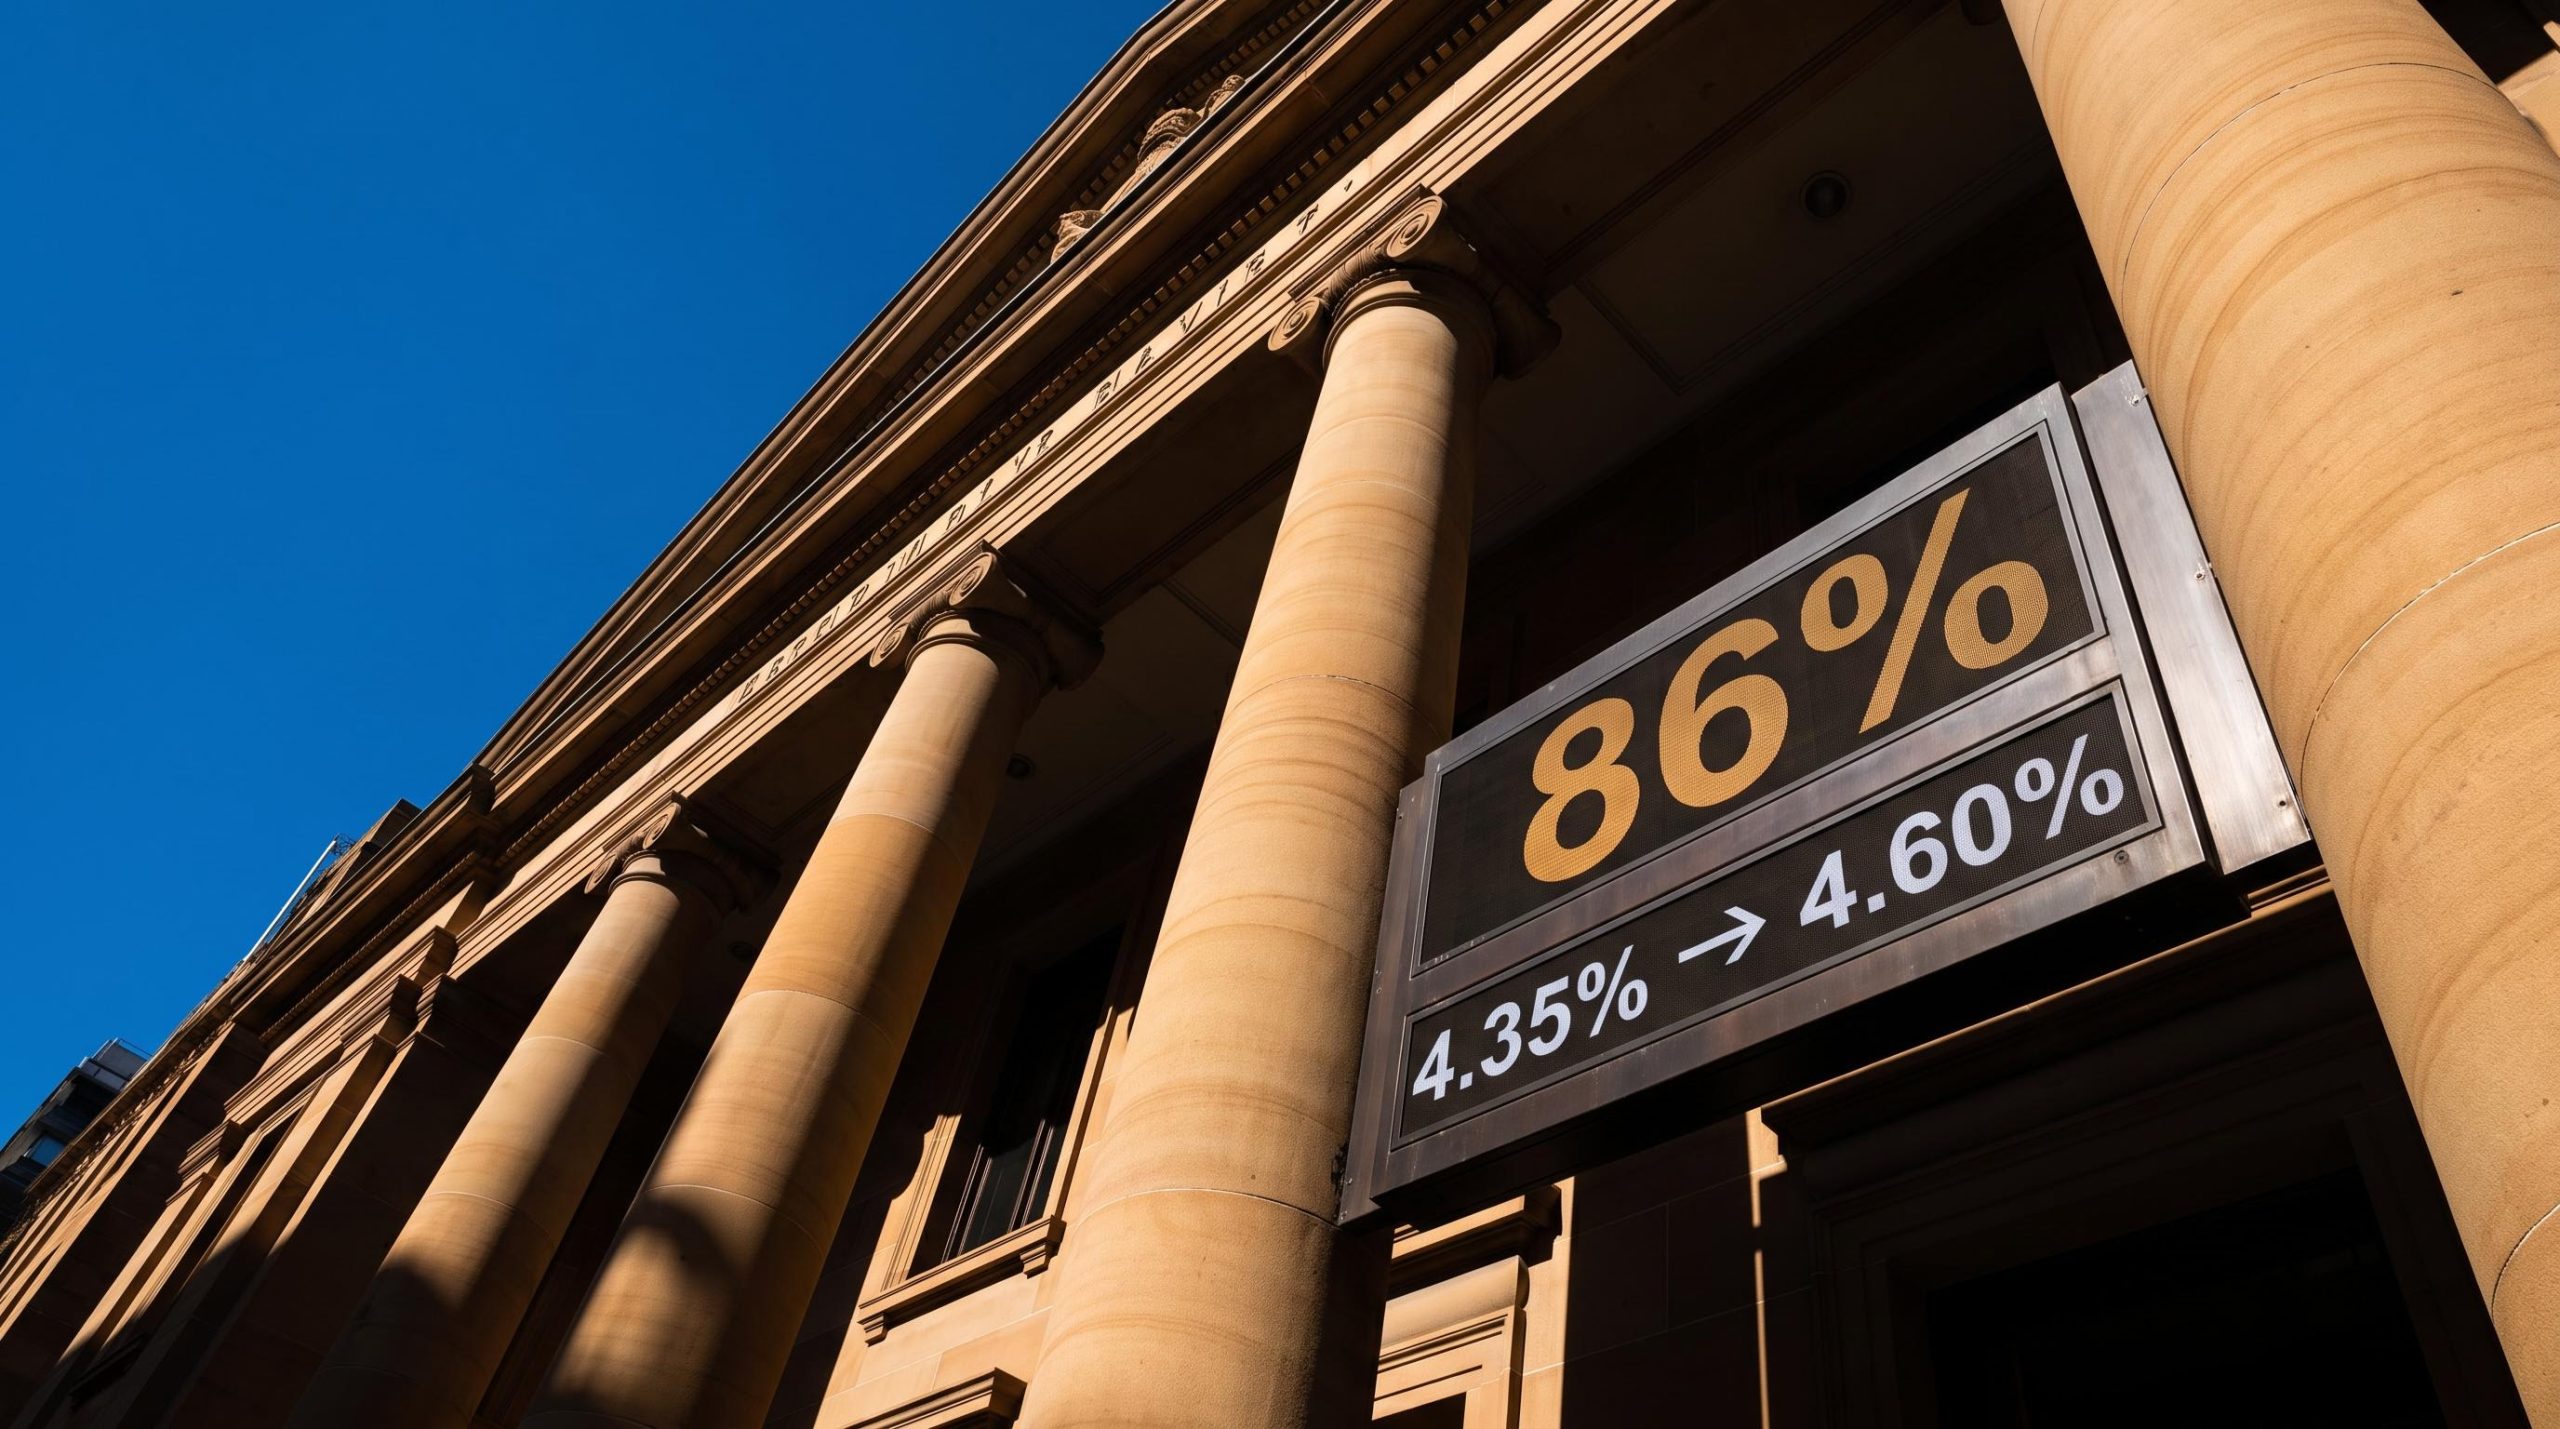
The headline figure does most of the talking. As of 24-25 September 2026, market pricing drawn from ASX rate tracker and central bank watch tools points to an 86% probability of a 25 basis point hike at the 29 September meeting, which would lift the cash rate from 4.35% to 4.60%.
The current 4.35% cash rate was itself the product of a third consecutive hike in May 2026, with eight of nine Board members voting to tighten and forward guidance language deliberately preserved to keep optionality open for exactly the kind of meeting now approaching.
86% market-implied probability of a hike As of 24-25 September 2026, financial markets were pricing roughly an 86% chance of a 25 basis point increase at the 29 September RBA Board meeting, based on ASX rate tracker and central bank watch data.
Rewind six weeks and the picture looked very different. The RBA’s August 2026 Statement on Monetary Policy (SMP), published 11 August 2026, reported markets pricing about a 50% chance of a cash rate increase by year-end.
The gap between those two numbers is not a contradiction. The 50% figure asked whether any hike would arrive before the end of the year, from a reference date of 11 August. The 86% figure asks a narrower question: will the Board move at this specific meeting. Different dates, different questions.
What the gap tells you is that data released in the intervening six weeks, particularly on inflation and the labour market, has hardened the market’s conviction that a move is coming now rather than later. When pricing shifts that sharply this close to a live meeting, it deserves attention from anyone positioning around the outcome.
On where the rate cycle ends, three official and independent reference points cluster in the mid-4% range:
- May 2026 SMP: cash rate assumed to rise to approximately 4.70% by end-2026
- August 2026 SMP: cash rate peaking near approximately 4.5% over coming quarters
- Original source estimate: near-term endpoint of approximately 4.6%
The read here is that most of the tightening cycle is already priced. Historically, market pricing this near a decision has been a reasonably reliable guide to the outcome, not merely a measure of sentiment. With the endpoint sitting only a fraction above the current 4.35%, the message for Australian investors is that limited additional tightening is embedded in asset prices beyond the September move itself.
When big ASX news breaks, our subscribers know first
The labour market data that complicates a straightforward hike decision
The August labour force numbers look, at first glance, like an argument against a hike. Then the detail underneath flips that reading.
The July jobs data, which showed a 15,800 fall in employment against a consensus forecast of a 12,000 gain, was the reading that originally pushed September hike odds sharply lower before the August labour force release reversed the picture.
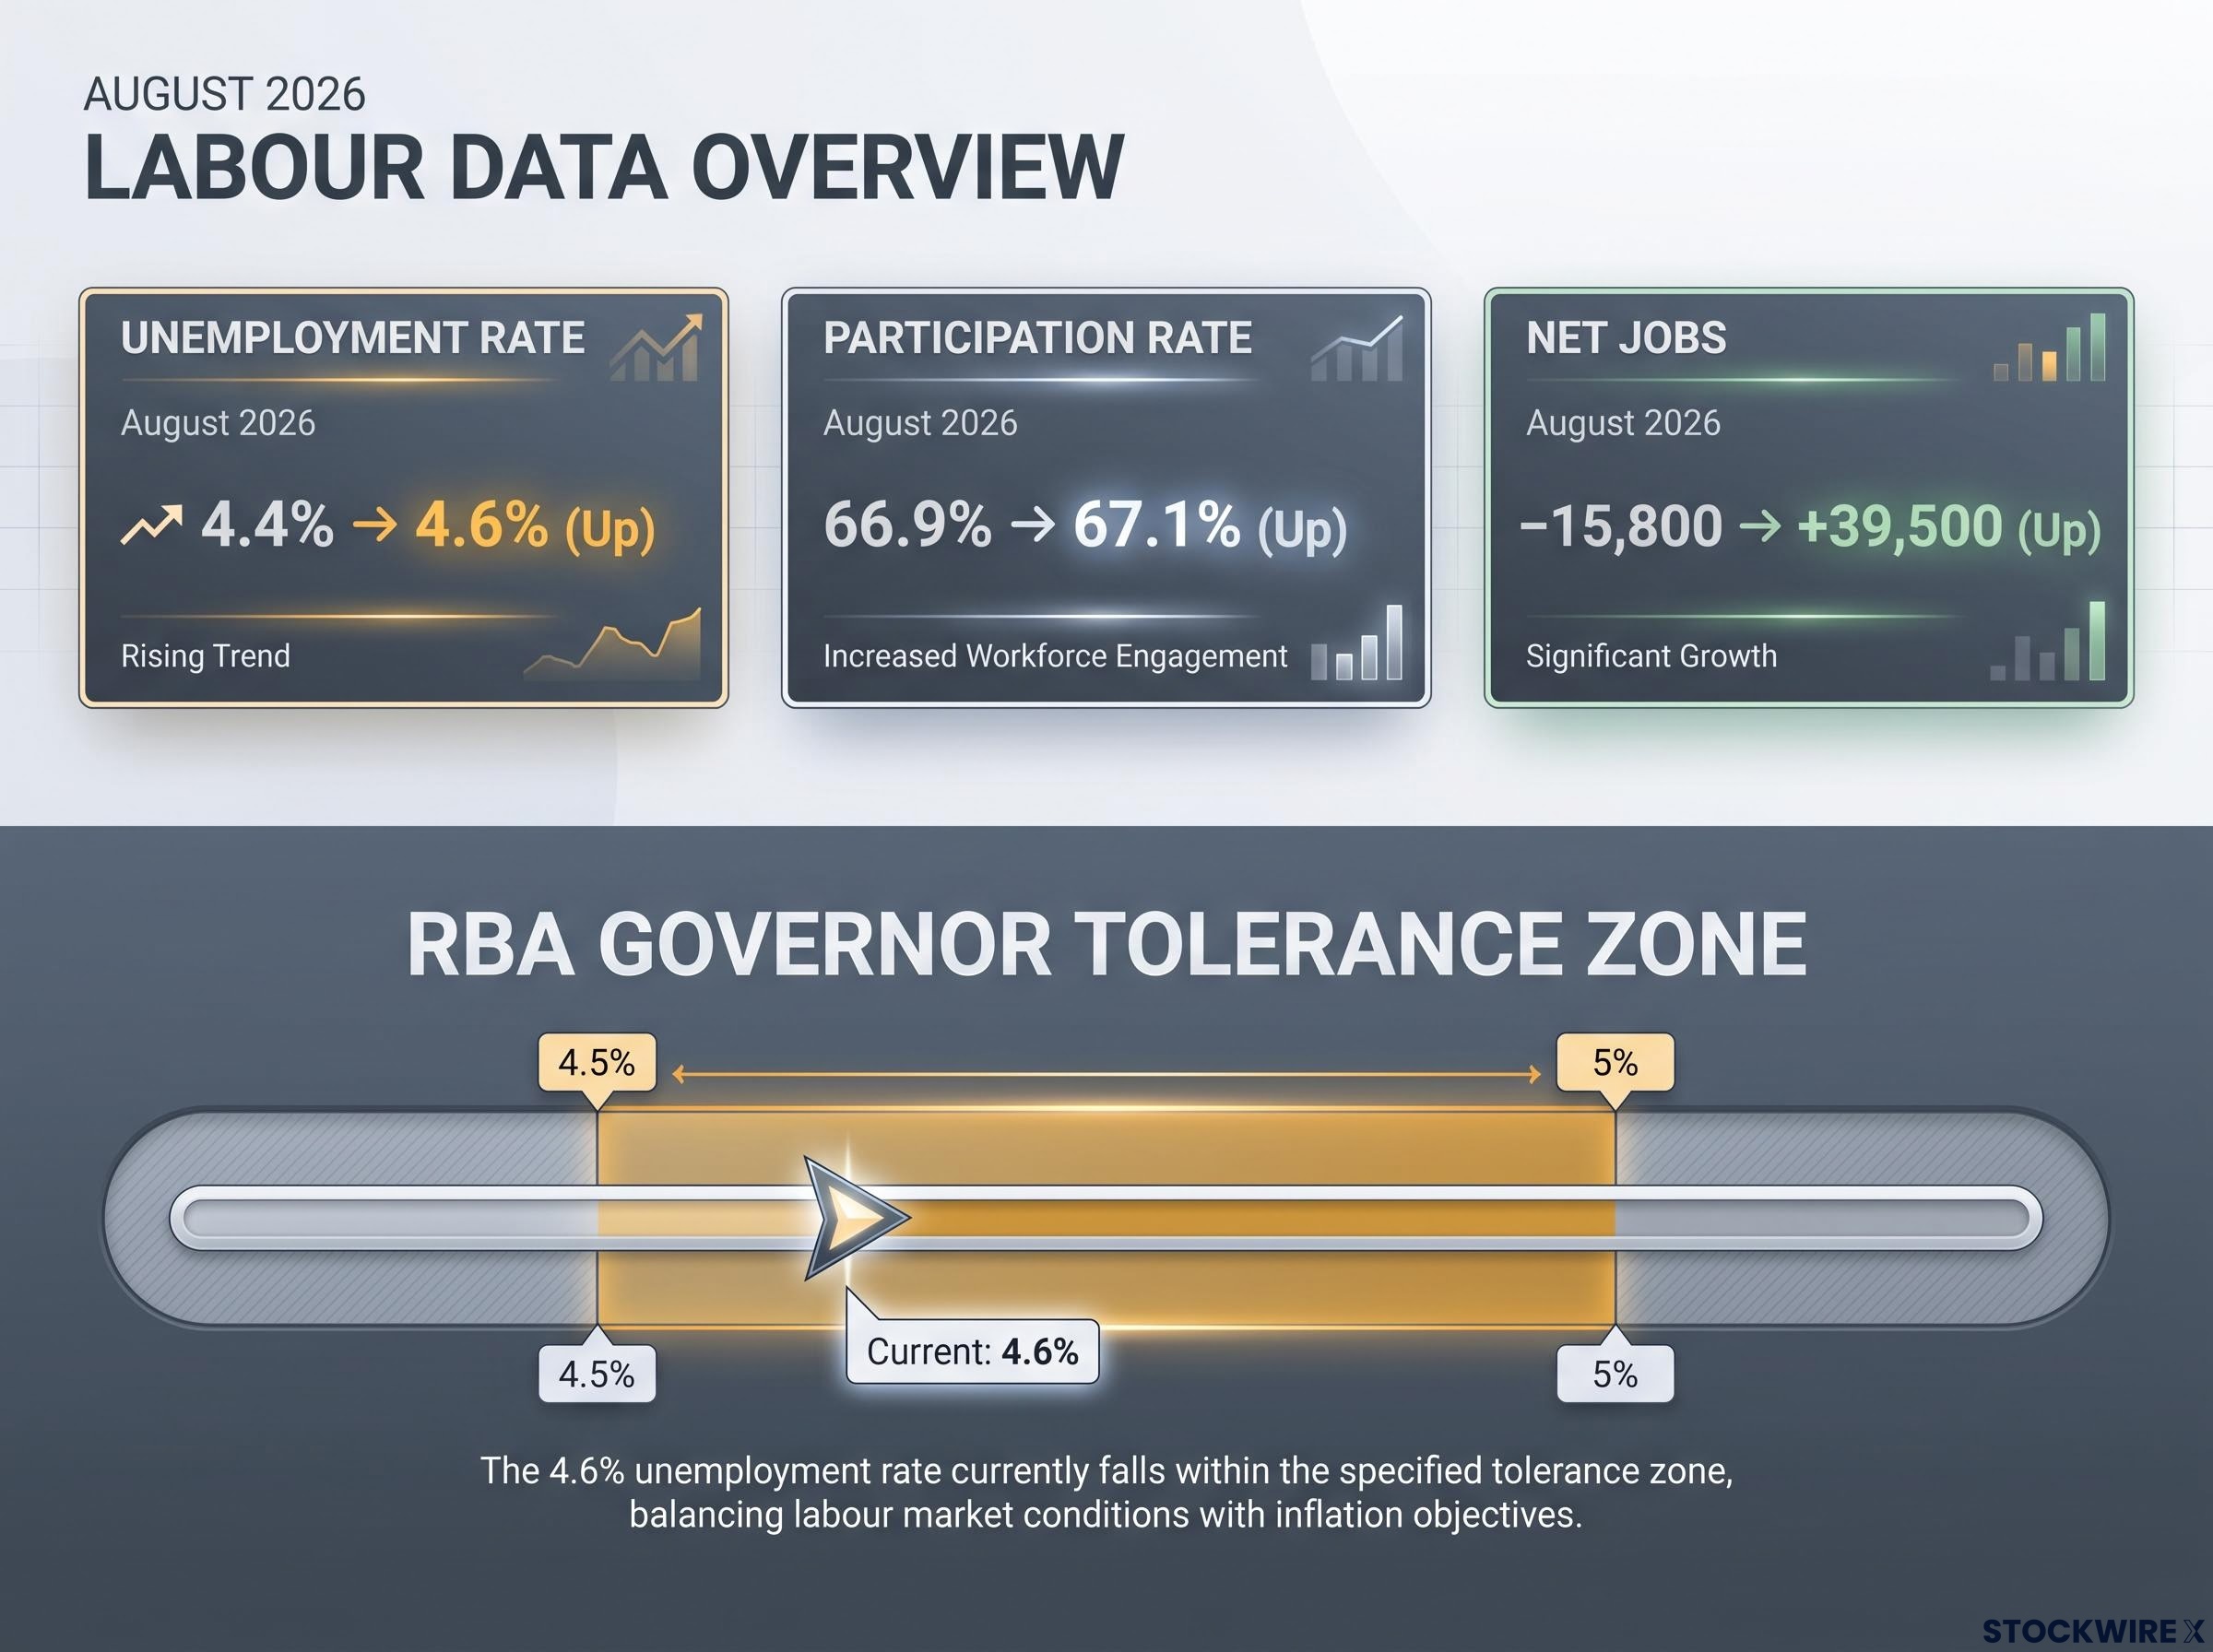
The ABS Labour Force release for August 2026, published 24 September 2026, showed the seasonally adjusted unemployment rate rising 0.2 percentage points to 4.6%, a five-year high. Coverage from outlets including The Straits Times and HCAMag echoed the figure.
| Metric | August 2026 | Prior month |
|---|---|---|
| Unemployment rate | 4.6% | 4.4% |
| Participation rate | 67.1% | 66.9% |
| Net employment change | +39,500 | -15,800 (July) |
Here is the twist. Employment did not fall; it grew by 39,500 jobs, reversing July’s decline of 15,800. The unemployment rate rose largely because participation lifted to 67.1% from 66.9%, drawing more people into the measured labour force. Westpac Economics noted in its 24 September summary that job creation was simply outpaced by faster labour supply growth.
Market strategists at the time attributed part of the rise to sample volatility and participation-rate noise. If that read holds, the underlying labour market remained relatively tight, which keeps the case for a near-term hike intact rather than undermining it.
How Governor Bullock has framed the tolerance zone
This is where the interpretation sharpens. RBA Governor Michele Bullock has publicly indicated that easing inflationary pressures likely requires an unemployment rate in the range of 4.5% to 5%.
At 4.6%, unemployment now sits squarely inside that band.
The key insight for Australian investors is not that the labour market is softening, though it is, gradually. It is that the RBA has effectively pre-signalled it will not treat 4.6% unemployment as a reason to hold, because that level falls within its own stated comfort zone for continued tightening. Since this was the final major labour input before the meeting, understanding how the Board reads it is the difference between anticipating a hold and positioning for a hike.
How sticky inflation and competing forecasts frame the RBA’s options
Trimmed-mean inflation, the RBA’s preferred core measure that strips out the most volatile price movements, is the central problem. It held at 3.6% year-on-year in the Q2 2026 CPI data, above target and slow to fall. The August 2026 SMP attributed part of that persistence to economy-wide capacity pressures and cost pass-through linked to the Middle East conflict.
The more interesting tension is over when inflation returns to target, and the sources genuinely disagree. The August 2026 SMP, the primary official RBA document, projects trimmed-mean inflation reaching the 2-3% midpoint in 2028. Earlier reporting referenced an “early 2027” re-entry into the band.
The distinction matters. Entering the 2-3% band is not the same as reaching its midpoint, and that difference likely explains much of the gap between the two timelines. The August SMP path is the one the Board is working from.
The August 2026 SMP maps out the descent in steps:
- 3.6% current
- 3.3%
- 3.0%
- approximately 2.4%, holding around that level through 2028
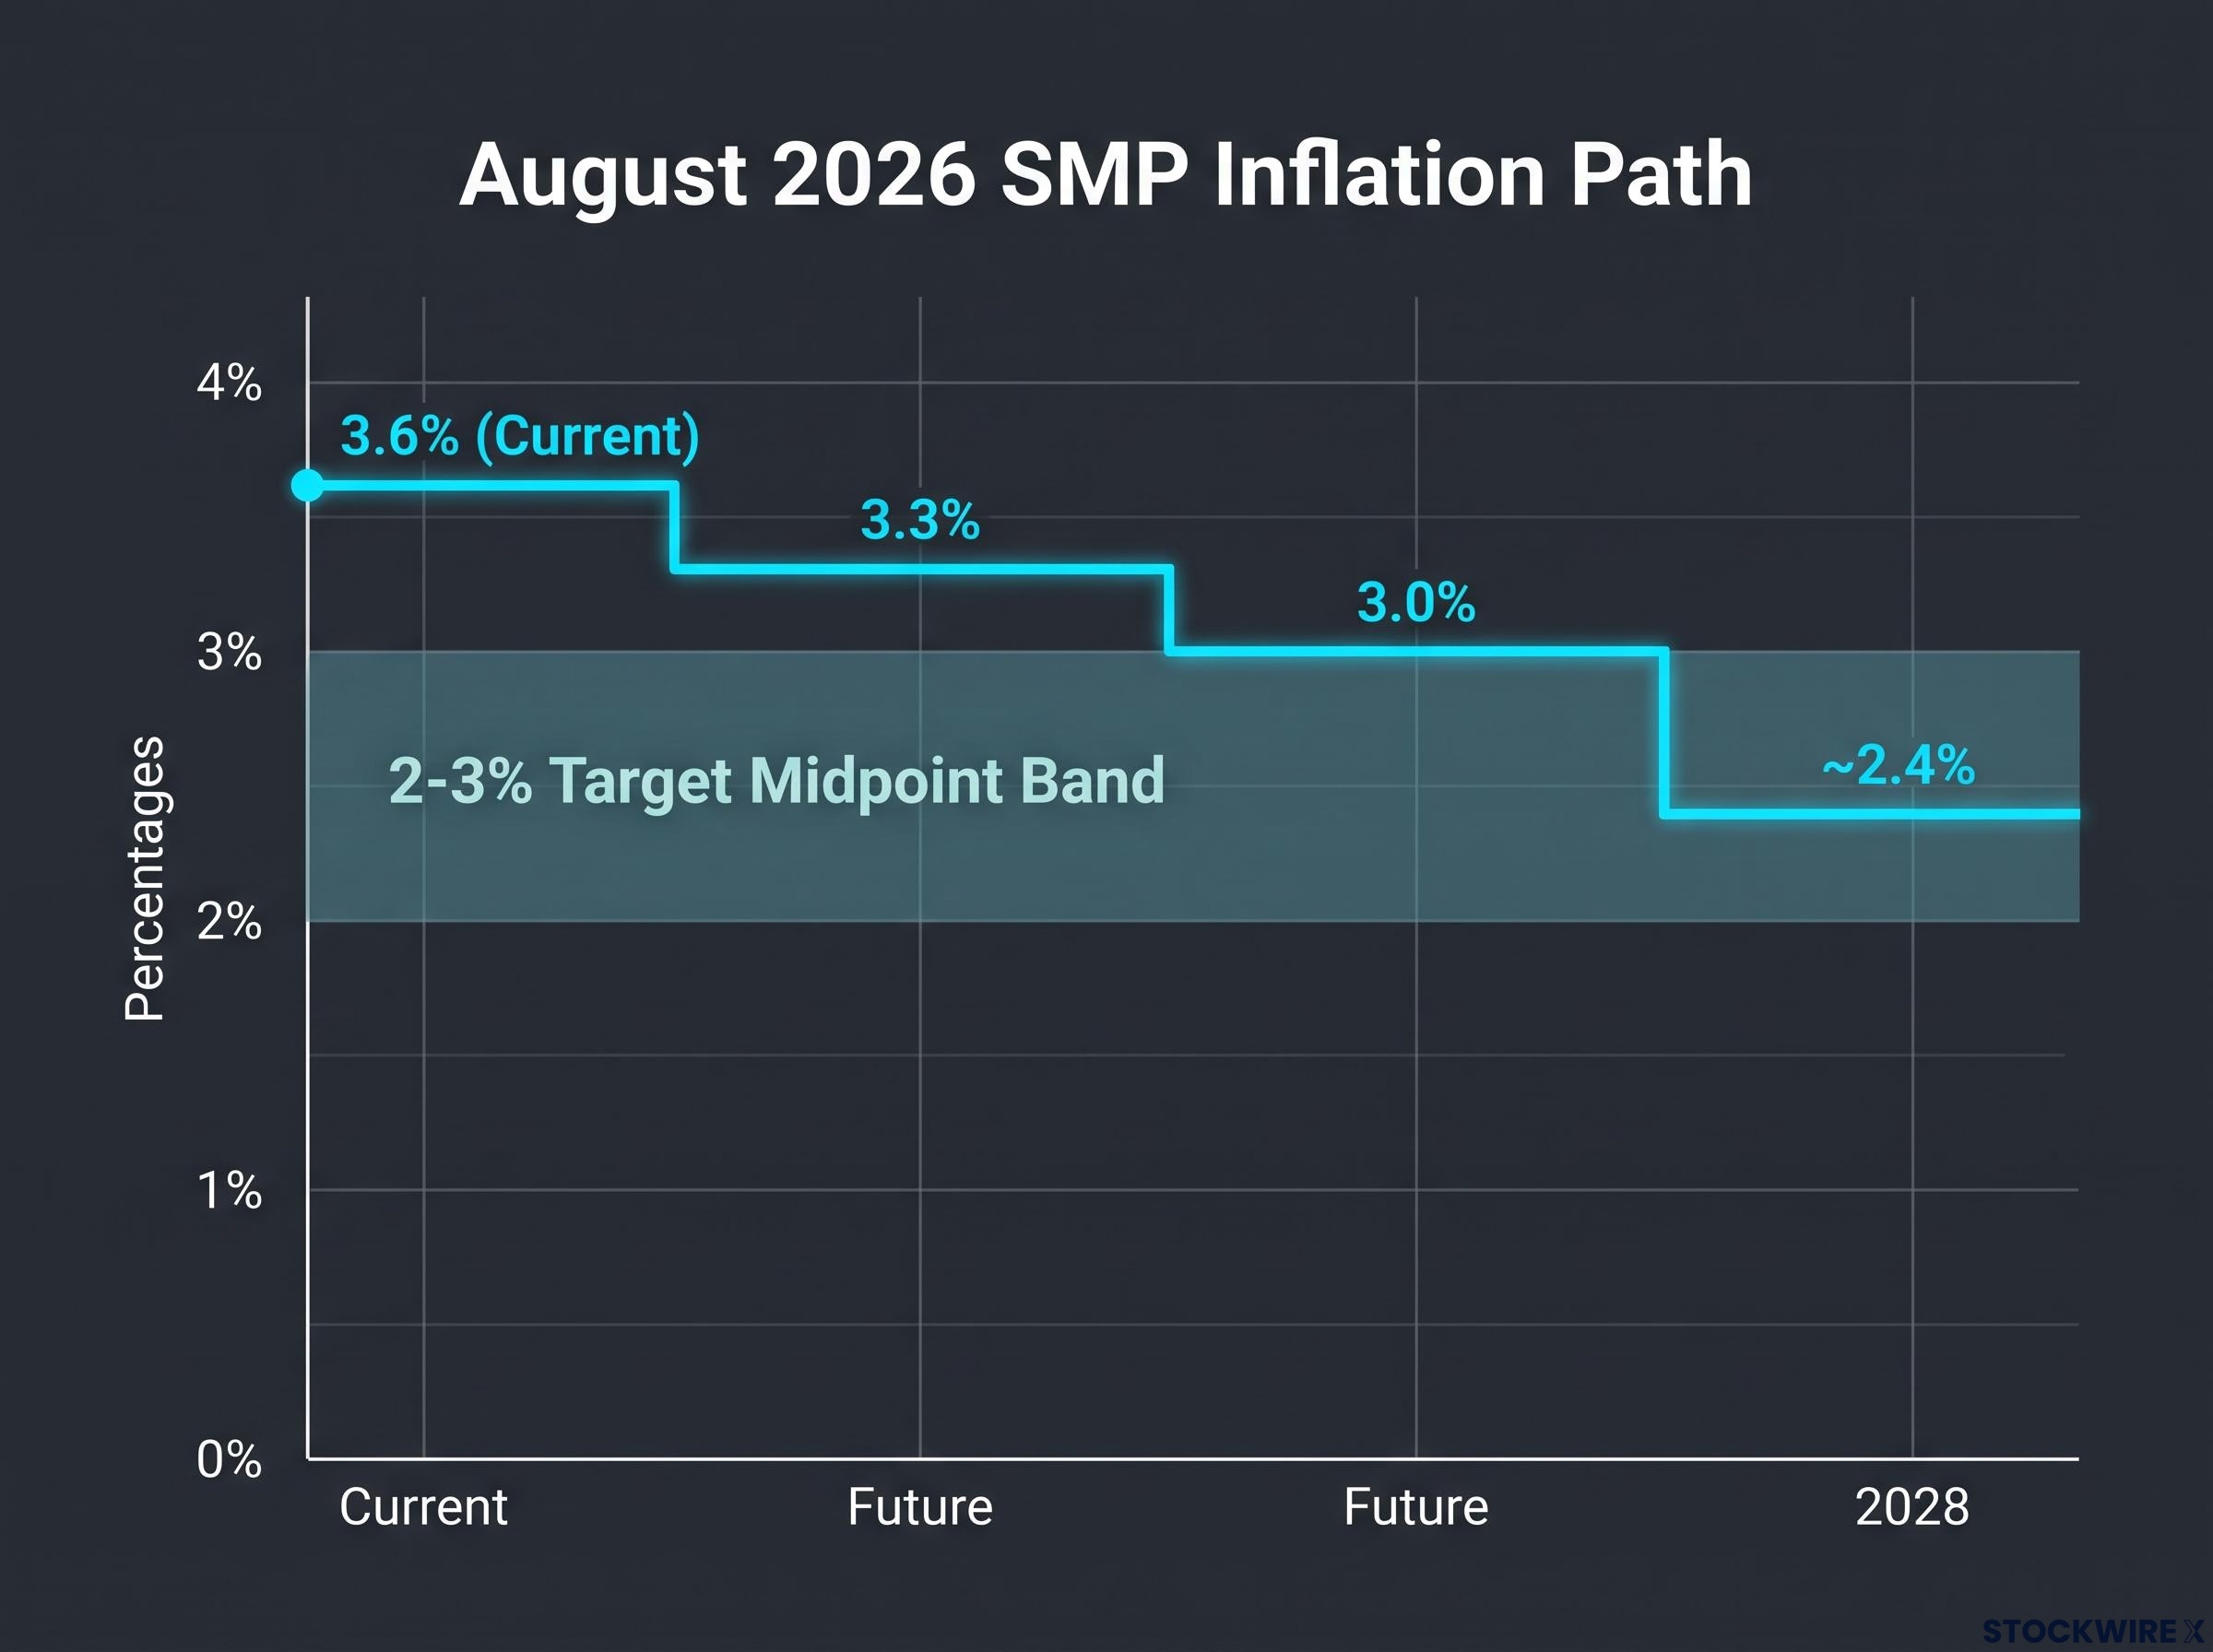
That path finds independent support. The Australian Industry Group’s August 2026 forecasts, published 28 August 2026, similarly project trimmed-mean inflation falling from 3.6% to around 2.4%, consistent with the RBA’s 2028 timeline.
The trade-off the Board is weighing is concrete. GDP growth is subdued at around 1.9% year-on-year, leaving limited buffer against the accumulated impact of tightening.
Per capita output contraction running alongside a 4.35% cash rate is the broader economic backdrop against which the Board is making this call: corporate insolvencies at their highest since the 1990-91 recession and consumer confidence at a 50-year low sit uncomfortably with a further tightening move.
The modelled cost of one more hike RBA-developed models estimate that modest further tightening could reduce GDP growth by approximately 0.2% to 0.75%, with an inflation effect of roughly 0.1% to 0.4%.
The 2028 timeline tells you the RBA appears willing to accept a prolonged inflation plateau rather than over-tighten into a slowing economy. The 86% hike probability tells you the market believes one more move is still needed to keep that path on track. For your portfolio, the horizon is what matters: a 2028 return to the midpoint means roughly two more years of elevated-rate conditions weighing on rate-sensitive assets, not a few quarters.
Which ASX sectors have already absorbed the rate cycle and which have not
The optimistic argument is straightforward. Rate-sensitive sectors, including REITs, consumer discretionary, and housing-linked equities, have already taken heavy valuation hits as the cycle approached its peak. Some consumer discretionary names have fallen roughly 30% from recent highs, and REA Group is down around 18% over the prior year, carrying a broad hold from broker consensus.
That is the pre-pricing case. The stock-level detail complicates it into something more useful than a simple bullish call.
| Sector / Stock | Approx. decline | Current broker view | Key risk |
|---|---|---|---|
| Consumer discretionary (sector) | ~30% from recent highs | Mixed | Household cash-flow squeeze |
| REA Group | ~18% over prior year | Broad hold | Housing turnover, tax policy shifts |
| Premier Investments | ~20% since end-June | Up 7% in prior session | Discretionary demand weakness |
| Soul Patts | Up 6.2% prior session | Defensive positioning | Broad market drawdown |
The broader tape stayed cautious. The ASX 200 fell 0.7% in the session before publication, with futures pointing to a further 0.3% drop at the open. Yet Premier Investments rose 7% in that same session despite its roughly 20% slide since end-June, with sales and gross profit landing within 1% of the prior corresponding period. Soul Patts added 6.2%. The selling has not been indiscriminate.
History offers a pattern here. In comparable cycles, rate-sensitive equities have tended to stabilise and re-rate once investors gained confidence the peak had been reached:
- Australian tightening cycle, 2009-2011
- Australian tightening cycle, 2016-2018
- US Federal Reserve cycle, 2004-2006
- US Federal Reserve cycle, 2015-2018
Two variables keep this from being a clean recovery thesis. The interaction between further hikes and recent tax policy changes adds complexity for residential property and related equities. And overtightening into a weakening labour market remains the key downside scenario.
The 30% fall in some discretionary names and the 18% drop in REA Group suggest the market has done significant pricing work already. For patient investors, that shifts the risk-reward in those sectors as the cycle approaches its endpoint, not after it ends. The specific reference prices above give you something concrete to anchor that judgment against, rather than a vague call that the sector is cheap.
What a decision in either direction means for Australian investors from here
The outcome is binary, and each path carries distinct portfolio implications.
If the Board hikes:
- Cash rate rises 4.35% to 4.60%, validating the priced endpoint
- Rate-sensitive equities may see short-term relief as the priced event lands rather than hangs over the market
- The 2028 return-to-target path stays intact
- Households already absorbing accumulated tightening face further pressure
If the Board holds:
- The 86% market pricing is wrong, and rate-sensitive sectors plus the Australian dollar could see a short-term relief rally
- Questions emerge over whether the RBA is falling behind on 3.6% inflation
- Medium-term uncertainty rises, even as near-term pressure eases
- The path back to target may need re-examining
The more durable question sits above either outcome. With the cash rate priced to peak in the mid-4% range and trimmed-mean inflation not forecast to reach the 2-3% midpoint until 2028, the useful exercise is identifying which sectors benefit most from the rate plateau and the eventual easing cycle, not just from the next 25 basis points.
The window that matters The real positioning question is the roughly 18-month period between now and when trimmed-mean inflation is expected to re-enter the target band. That is the window in which rate-sensitive sector valuations will be set.
Whether the RBA hikes or holds on 29 September, how you are positioned for that stretch matters more than the single move itself.
For investors wanting to look past the September decision to the eventual easing cycle, our dedicated guide to ASX sector positioning for rate cuts maps which sectors have historically moved first when the RBA pivots, including the specific dynamics for REITs, infrastructure, and long-duration growth names.
This article is for informational purposes only and should not be considered financial advice. Investors should conduct their own research and consult with financial professionals before making investment decisions. Past performance does not guarantee future results. Financial projections are subject to market conditions and various risk factors, and forward-looking statements are speculative and subject to change based on market developments.
Making an informed call in a live rate decision environment
Four tensions run through this decision, and none of them resolves cleanly. Markets price an 86% hike probability against a labour market showing genuine, if gradual, softening. Trimmed-mean inflation sits at 3.6% against an official path back to the 2-3% midpoint by 2028. Rate-sensitive equities have absorbed much of the cycle already, yet policy risk remains unresolved. And the hike-versus-hold outcome cuts both ways for sectors and the currency.
Two things are genuinely unknown. Whether the participation-driven jump in unemployment reflects real loosening or statistical noise. And whether the Board treats 4.6% as grounds for a pause or as comfortably inside its 4.5% to 5% tightening tolerance.
The honest conclusion is that the 29 September decision is one data point in a multi-year cycle. With the cash rate priced to peak in the mid-4% range and inflation not expected back at target until 2028, the structural opportunity lies in positioning for the turn, not just reacting to the next move.