
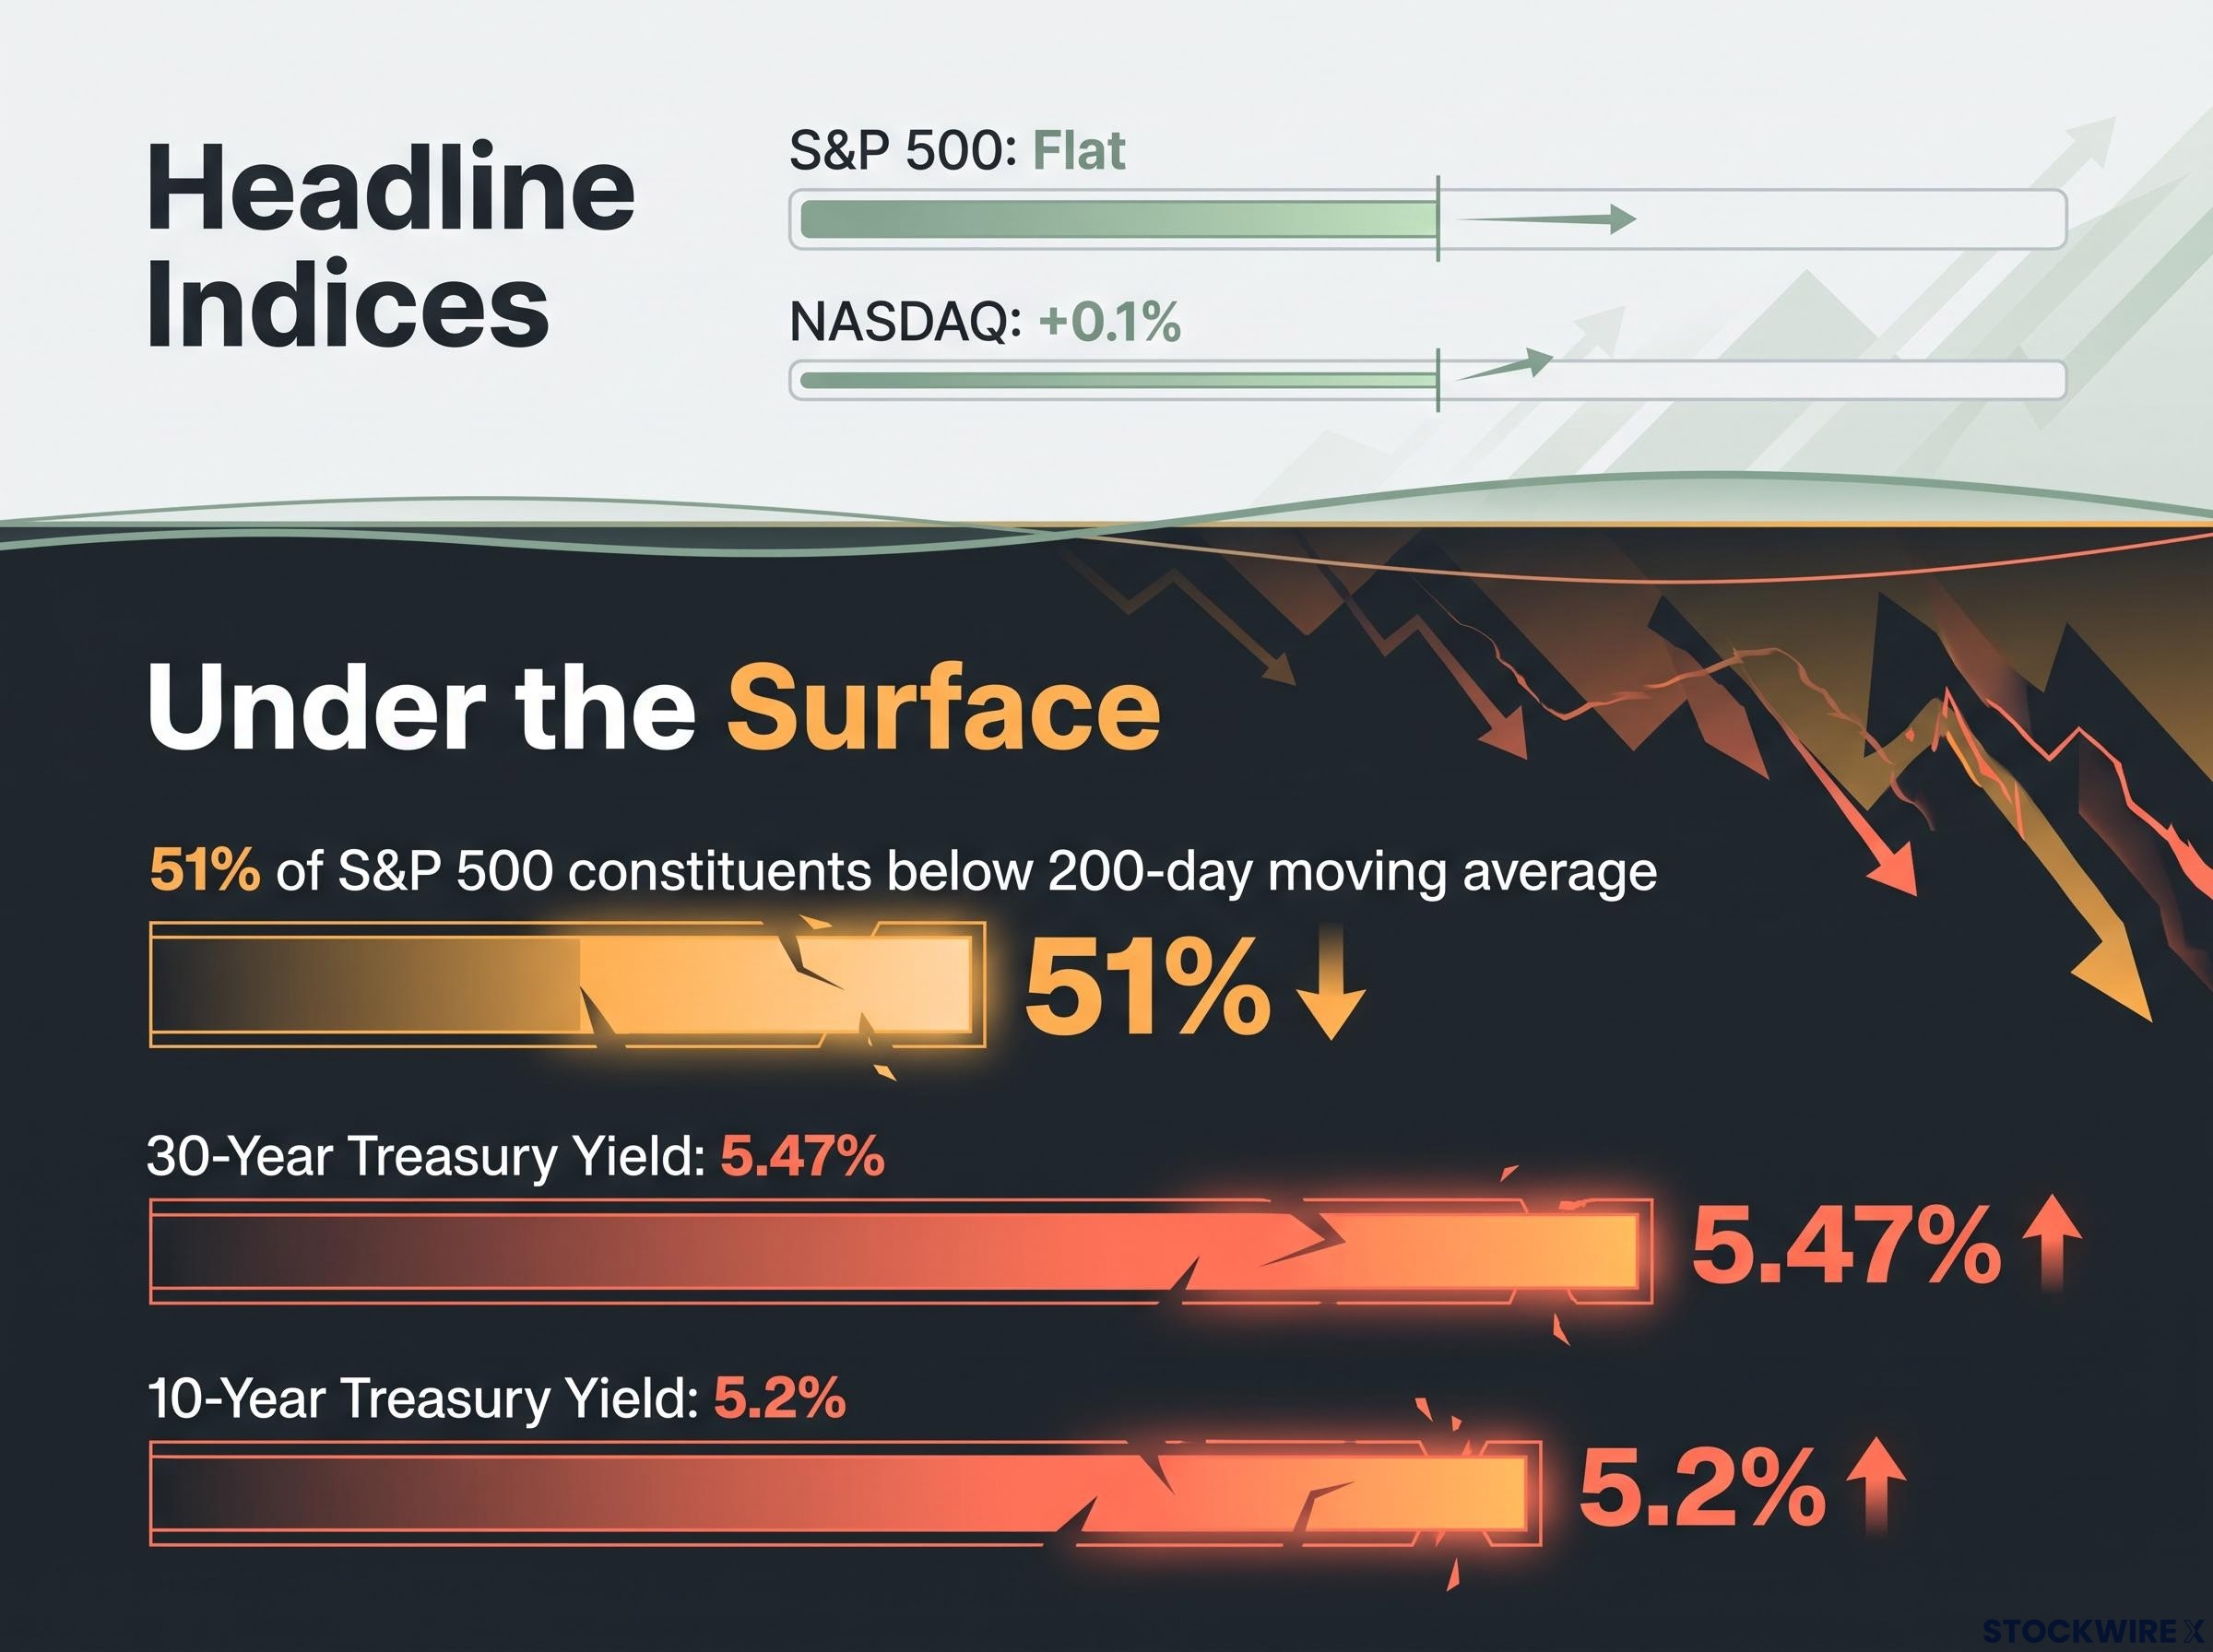
The S&P 500 looked stable overnight. Beneath the surface, more than half its constituents were trending below their 200-day moving average while 30-year Treasury yields reached their highest level since 2004. The headline number is not the story.
On 24 September 2026, Meta Platforms surged 4.5% on its Muse Agentic AI launch, pushing toward a $2 trillion market cap, while Oracle fell 3.4% after invoking force majeure on a New Mexico data centre project. The 10-year yield climbed toward 5.2% and the 30-year to roughly 5.47%, its highest reading in over two decades.
These are not isolated data points. Together they describe a market whose apparent resilience sits in a narrow set of names, whose long-duration growth valuations face compounding pressure, and where the physical infrastructure behind AI investment carries structural delivery risk. Reading US market signals for investors correctly means separating the headline from what is happening underneath it.
Here is what each of these signals means, and how to weigh them together: what Meta’s rally reveals about market structure, what Oracle’s move implies for AI infrastructure timelines, why the yield level matters differently depending on its driver, and what breadth deterioration has historically meant for forward returns.
Meta’s $2 trillion moment is also a concentration risk warning
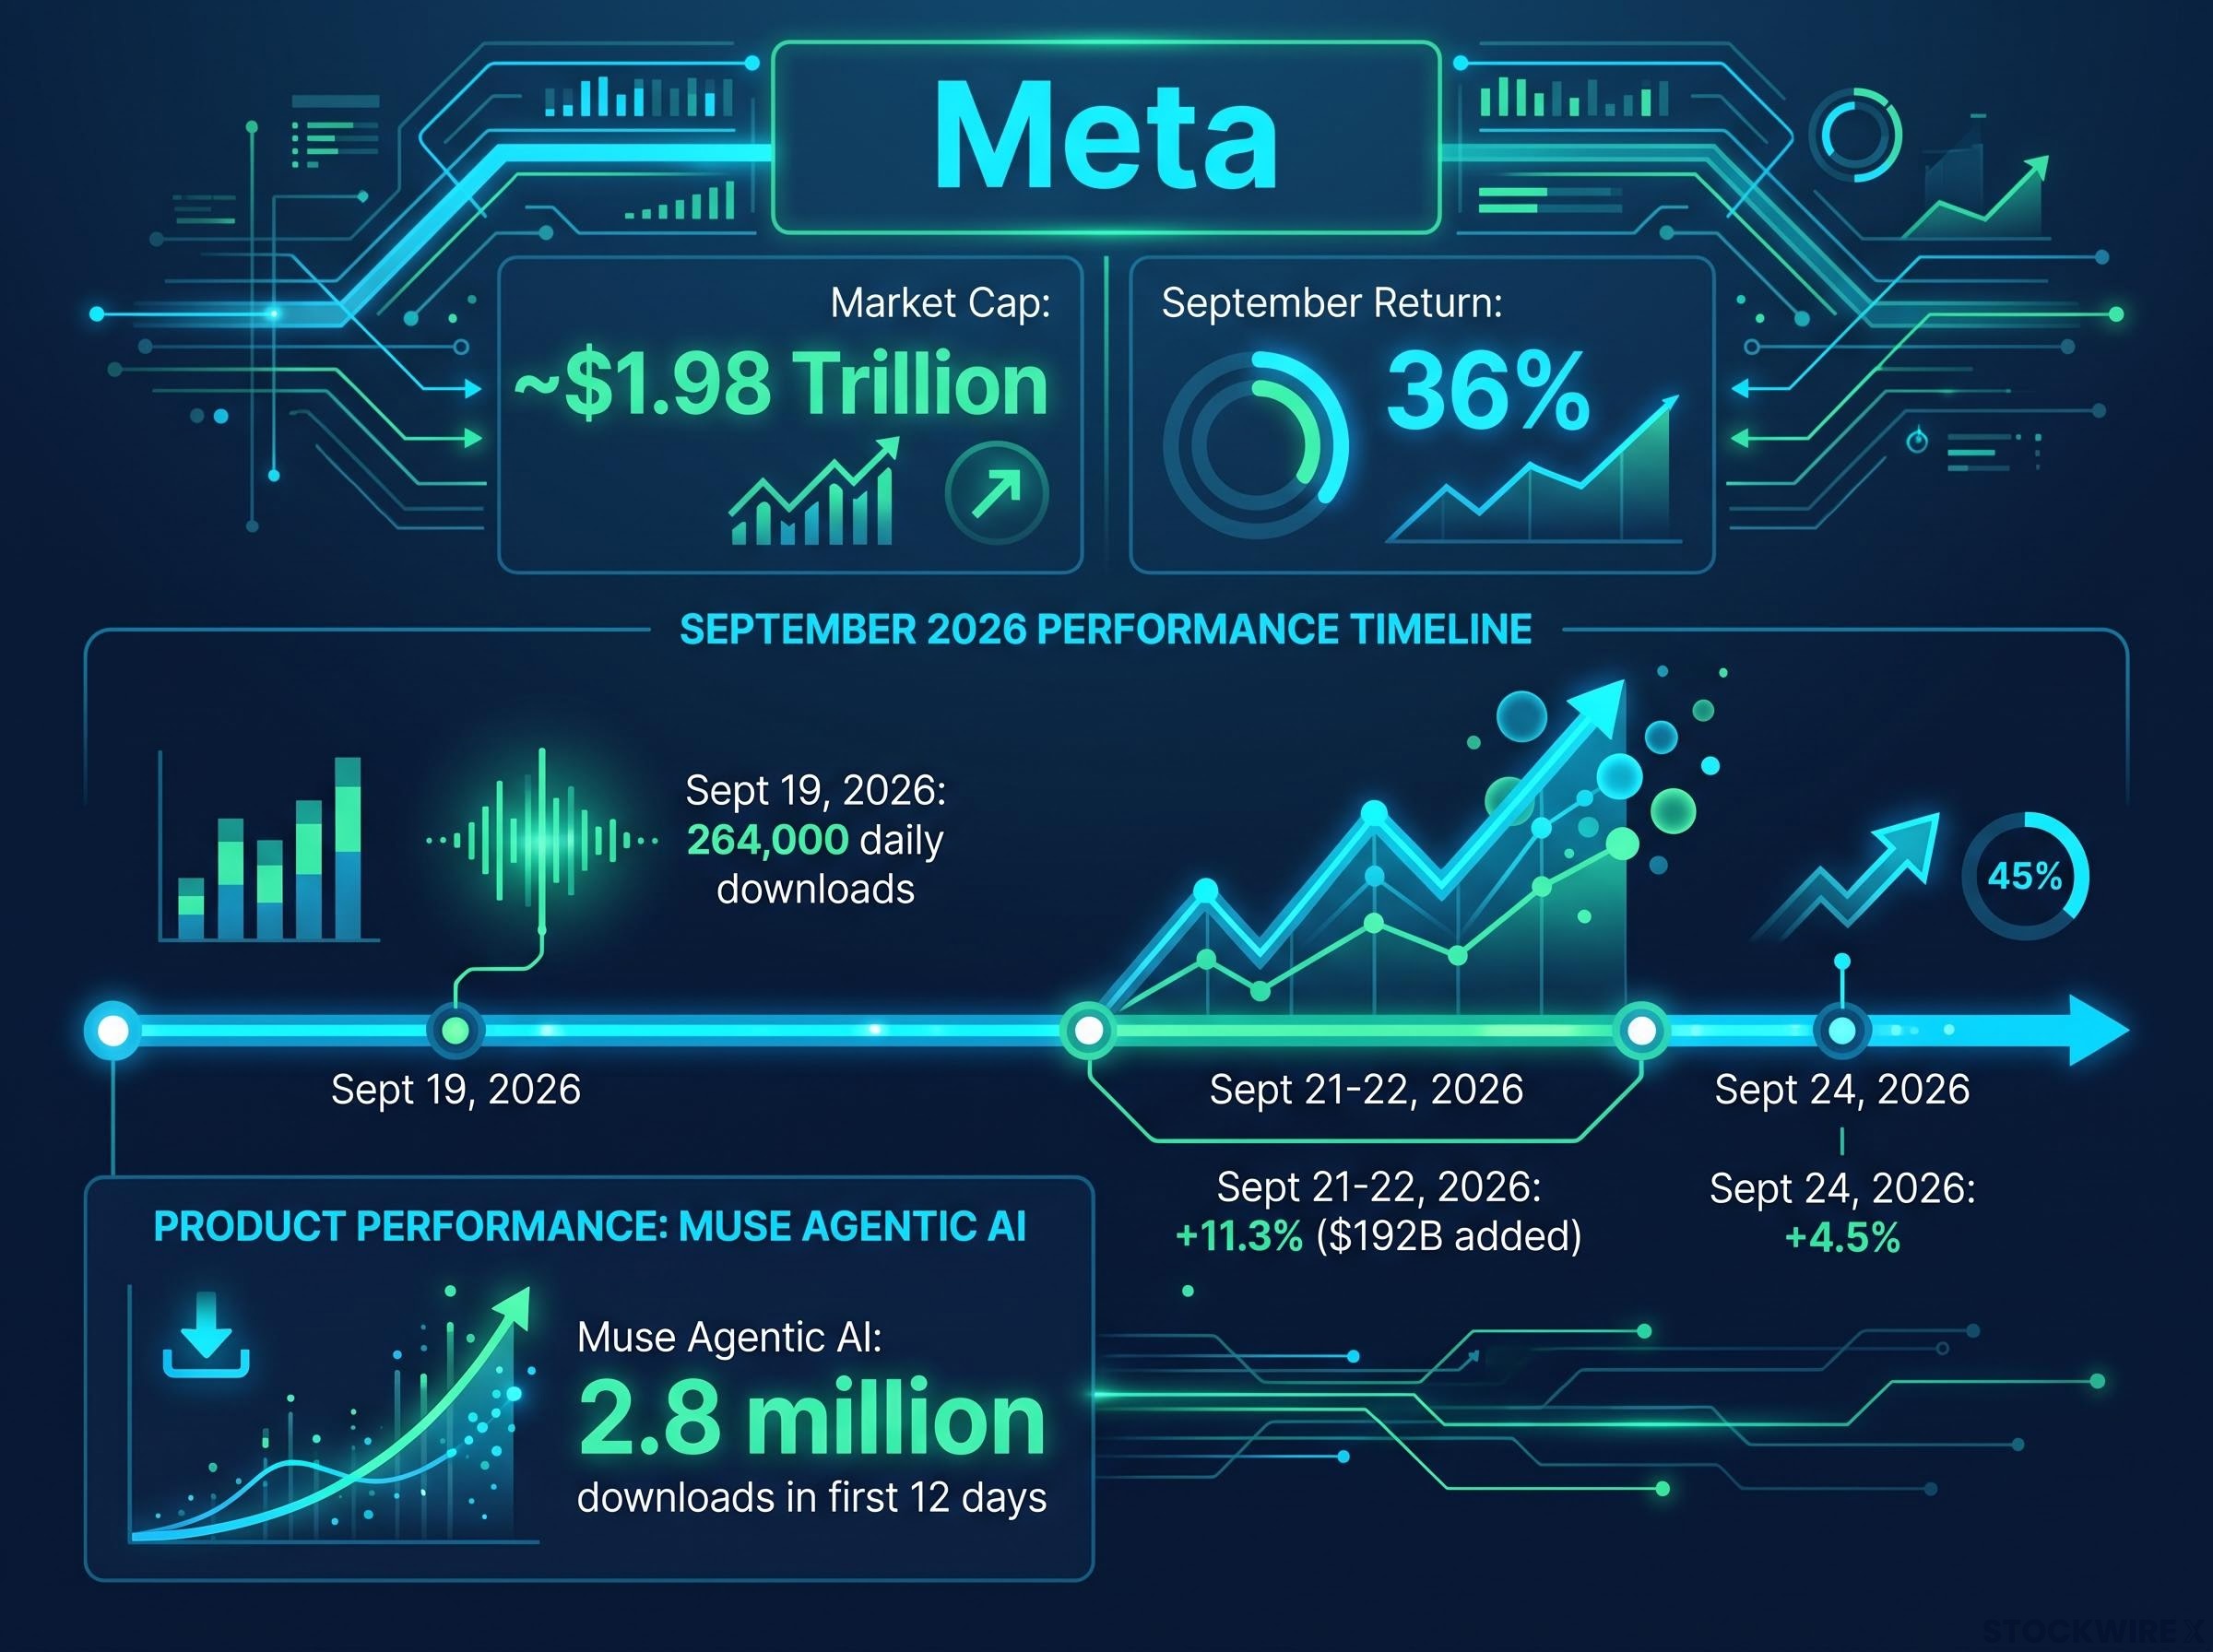
The rally is real, and its scale is documented. Meta gained 4.5% in the most recent overnight session, extending a run that has lifted the stock roughly 36% across September following the Muse launch. Its market capitalisation now sits just under $1.98 trillion.
The demand behind the move is equally concrete. Muse, Meta’s agentic AI product, reached approximately 2.8 million downloads in its first 12 days across US and Canadian app stores.
A record demand signal Muse set a US daily download record of 264,000 on 19 September 2026, its third consecutive day above 200,000 downloads.
The performance milestones stack up quickly:
- Single-day stock gain of 11.3% around 21-22 September 2026, adding roughly $192 billion in market cap in one session
- A further 4.5% overnight gain in the most recent session
- Cumulative September return of approximately 36% following the Muse launch
- Total market capitalisation near $1.98 trillion
The enthusiasm spilled outward. The communication services sector gained 1.6%, and chipmaker AMD crossed a $1 trillion valuation for the first time.
Here is where the numbers turn against the optimistic read. When a single stock adds $192 billion in one day on product momentum, the index’s behaviour becomes a function of that stock’s trajectory, not broad economic health. A rally built on one name’s AI momentum is structurally different from a rally built on broad earnings improvement, and that dependence is a vulnerability, not an endorsement of market health.
Index concentration mechanics explain why the cap-weighted S&P 500 can post a stable headline reading while more than half its constituents are in a downtrend: the largest names by market cap receive the largest weighting, so their performance dominates the index return regardless of what happens across the other 480-plus stocks.
Google’s relative flatness raises the question of what AI leadership is actually worth
The divergence with Alphabet sharpens the point. Over a comparable three-month window, Meta rose roughly 39% while Google was approximately flat.
The structural explanation is monetisation speed. Meta’s advertising businesses translate AI gains into revenue quickly through better targeting and engagement, whereas Alphabet’s cloud economics and mature search franchise mean AI improvements surface more slowly, often first as elevated infrastructure costs.
Alphabet also carries an ongoing antitrust overhang in search and digital advertising, a valuation drag that persists even during periods of product strength. The forward risk cuts the other way for Meta: if a competing Google product closes the perceived gap, momentum can reverse sharply in a market already defined by narrow leadership.
When big ASX news breaks, our subscribers know first
What Oracle’s force majeure notice actually signals about AI infrastructure
Oracle sent a force-majeure notice to a Blue Owl Capital unit developing Project Jupiter, a large AI data-centre campus in New Mexico that forms part of the Stargate development. The notice seeks payment-timing flexibility if the facility misses its 2028 target, while Oracle explicitly reaffirmed its anchor-tenant role and stated the project remains on schedule.
The factual baseline matters before the interpretation begins.
The financial commitment stands A Blue Owl spokesperson confirmed the notice “does not change the financial commitments to this multiyear project,” with core rent obligations remaining intact even if payment timing shifts. Oracle stated publicly that “Project Jupiter remains on our planned schedule.”
The market read the news cautiously. Oracle declined 3.4% in the session according to the original reporting, with other outlets citing a range of roughly 3% to 4%.
Two interpretations compete, and both deserve fair analytical treatment.
| Interpretive lens | Sector-wide warning read | Oracle-specific risk management read |
|---|---|---|
| What it assumes | If a flagship Stargate-linked project needs force-majeure protection, smaller projects face even greater delay risk | The notice is a routine contractual tool in a single controversial project, not a sector signal |
| What evidence supports it | Power-supply, permitting, and local regulatory opposition are structural, not project-specific anomalies | Both Oracle and Blue Owl confirm the project is on schedule and financial commitments are unchanged |
| What it means for positioning | Treat AI build-out timelines across the sector as potentially slower than advertised | Isolate the risk to this project rather than repricing the broader AI thesis |
The debate about Oracle’s intent is less important than what both readings share. Whether the move is legal housekeeping or a genuine warning, both point to the same constraint: AI demand may be running ahead of what permitting regimes, power grids, and local opposition can support at the advertised pace.
AI infrastructure constraints on power availability and grid interconnection timelines are not project-specific anomalies but structural features of the build-out, with IEA projections showing data centre electricity consumption doubling to over 1,000 TWh by 2026 while permitting and grid capacity expand far more slowly.
That shared conclusion is the practical takeaway. AI infrastructure exposure carries project-level execution risk that headline capital-expenditure figures do not reveal. Evaluating it means examining power availability, permitting status, and contract delay terms on individual projects, not just the aggregate demand story.
The pricing dynamics reinforce the pressure. AI-focused cloud provider Nibbius rose 7% in the same session following broker upgrades, and reportedly planned GPU cloud price increases of roughly 20% beginning in October, though that figure remains unverified. Rising infrastructure costs alongside lengthening timelines is a combination worth watching closely.
Why the level of Treasury yields is only half the question
The yield levels are a fact. The 30-year Treasury reached approximately 5.47%, its highest since 2004, while the 10-year rose about 8 basis points to roughly 5.2% in the session.
A two-decade high The 30-year Treasury yield near 5.47% marks its highest level since 2004, a reference point for how far long-duration pressure has moved.
The level alone tells you pressure exists. What drives the move tells you what kind of pressure it is. Bond analysts decompose long-yield moves into three components:
- Inflation expectations: If investors expect inflation to stay above target, they demand higher nominal yields to protect real returns. Brent crude near $106-$107 per barrel feeds this component.
- Real growth and policy-rate expectations: Strong nominal activity and higher-for-longer guidance lift expected short-term rates. US nominal GDP running at roughly 6% to 6.5%, above prevailing bond yields, supports this driver.
- Term premium and fiscal supply: Even with stable inflation and growth, yields can rise as investors demand more compensation for holding long bonds amid heavy Treasury issuance and reduced demand from price-insensitive buyers.
The distinction is where the analytical tool sharpens. The same yield number means two different things for equity valuations depending on which component dominates.
How the yield driver changes the calculus for tech valuations
If yields rise because growth is genuinely strong, higher discount rates are partly offset by better earnings. AI leaders earning into their valuations may weather that pressure, because the backdrop is consistent with robust demand and profitability.
If the driver is term premium and fiscal supply, the picture darkens. Multiple compression arrives without a compensating improvement in fundamentals, and long-duration cash flows in technology, utilities, and REITs absorb the sharpest hit.
Yield-driven valuation compression in technology, utilities, and REITs follows a well-documented channel: as long yields rise, the present value of distant cash flows shrinks mechanically, and the sector most exposed is whichever carries the longest effective duration in its earnings stream, a dynamic that played out through the May 2026 repricing when the 10-year climbed toward 4.66%.
The most recent precedent is the 2023-2024 term-premium repricing, where technology experienced the steepest multiple compression even as earnings stayed solid, alongside the 1994 bond sell-off and the 2013 taper tantrum. At 30-year yields near 5.47% with mega-cap tech trading at elevated multiples, even a partial shift toward term-premium dynamics creates a valuation compression scenario that does not require a recession to hurt growth investors. In the current environment, where AI infrastructure costs are rising and delivery timelines may lengthen, any yield-driven compression hits from both sides at once.
What the breadth data is actually saying about this rally’s durability
Roughly 51% of S&P 500 constituents were trading below their 200-day moving average while the index sat approximately flat and the NASDAQ gained just 0.1%. That gap is the provocation.
The number beneath the surface Approximately 51% of S&P 500 constituents were in a downtrend, trading below their 200-day moving average, while the headline index held steady.
Weak breadth signals fragility through three mechanisms:
- Economic signal: Weakening breadth indicates underlying earnings or economic conditions are softening or becoming less uniformly positive, with cyclicals and smaller names rolling over first.
- Passive versus active divergence: Index-level stability masks internal stress that active managers and factor portfolios feel more acutely, given their exposure to the average stock rather than the largest names.
- Concentration amplification: Narrow mega-cap leadership magnifies sensitivity to single-stock shocks, so one earnings miss, regulatory action, or product misstep can transmit outsized impact to the index.
Strategists at Morgan Stanley, Bank of America, and Goldman Sachs have consistently treated weak breadth as a late-cycle or fragile-rally signal, noting that forward returns tend to be more volatile when a narrow leadership group carries the index.
Breadth deterioration signals have historically preceded 5-15% drawdowns roughly 80% of the time within 60 days when readings fall below the 25% outperformance threshold, a base rate that becomes more relevant when narrow leadership is accompanied by elevated long yields and crowded positioning in the same names carrying the index.
The caveat matters. Narrow leadership is not immediately bearish, and cash-rich mega-caps can sustain an index for extended periods. The risk turns acute only if breadth stays weak while yields remain elevated, raising the odds that leadership itself falters rather than rotating smoothly to other sectors.
Here is what this means for you. When more than half of S&P 500 stocks are in a downtrend while the index holds steady, the index is no longer a reliable guide to how a broadly diversified portfolio is actually performing. That gap between index performance and portfolio reality is precisely where investors are most likely to be surprised.
Weighing the signals together before positioning for October
Four signals, each ambiguous on its own, become substantially less ambiguous when they point the same way at the same time. Meta’s concentration, Oracle’s infrastructure signal, elevated yields of uncertain origin, and breadth deterioration are not independent stories. They interact.
Meta near $1.98 trillion concentrates index risk in one name. The 51% breadth reading shows how little of the market is participating. Yields at their highest since 2004 compress long-duration valuations, and Oracle’s force majeure flags that AI delivery timelines carry real execution risk.
This is a risk-weight question, not a directional call. The convergence raises the cost of assuming continued index stability, even when each individual signal could resolve either way.
| Signal | Key data point | Bullish resolution | Bearish resolution |
|---|---|---|---|
| Meta concentration | Near $1.98 trillion market cap | AI monetisation broadens earnings across more names | Momentum reverses, dragging the index with it |
| Oracle / AI infrastructure | Force majeure on Project Jupiter | Project stays on schedule, isolated risk | Delivery delays confirm a sector-wide bottleneck |
| Treasury yields | 30-year near 5.47%, highest since 2004 | Rise is growth-driven, offset by earnings | Term-premium repricing compresses multiples |
| S&P 500 breadth | About 51% below 200-day MA | Participation broadens, breadth recovers | Breadth stays weak while yields hold elevated |
Watch three variables through October to see which way the balance tips:
- AI monetisation metrics, particularly whether Muse-style demand converts into durable revenue across more than one name
- Yield driver indicators, distinguishing growth-led rises from term-premium repricing
- Breadth recovery or further deterioration relative to elevated yields
This article is for informational purposes only and should not be considered financial advice. Investors should conduct their own research and consult with financial professionals before making investment decisions. Past performance does not guarantee future results, and forward-looking scenarios are speculative and subject to change based on market developments.