Sonic Healthcare’s share price has shed more than 35% from its 52-week high, settling near its annual floor at $18.91 while posting its first double-digit profit recovery in years. The two facts sit in tension: a business that appears to be healing, priced as though the damage is still deepening. Whether the market has correctly dismissed a structurally impaired operator or overshot on the downside depends heavily on which valuation framework an investor applies. SHL is not a mature yield stock to be assessed on dividend consistency and debt load alone. It is a global pathology operator navigating a structural reset after an exceptional COVID-era earnings peak, which means the relevant analytical lens centres on trajectory, not current-year snapshots. What follows unpacks the forces driving the sell-off, examines the HY25 recovery signal and its credibility, situates SHL’s valuation against ASX pathology peers, and offers a practical framework for investors deciding whether the current price represents opportunity or a falling knife.
From pandemic peak to near-record low: what has driven SHL’s 35% fall
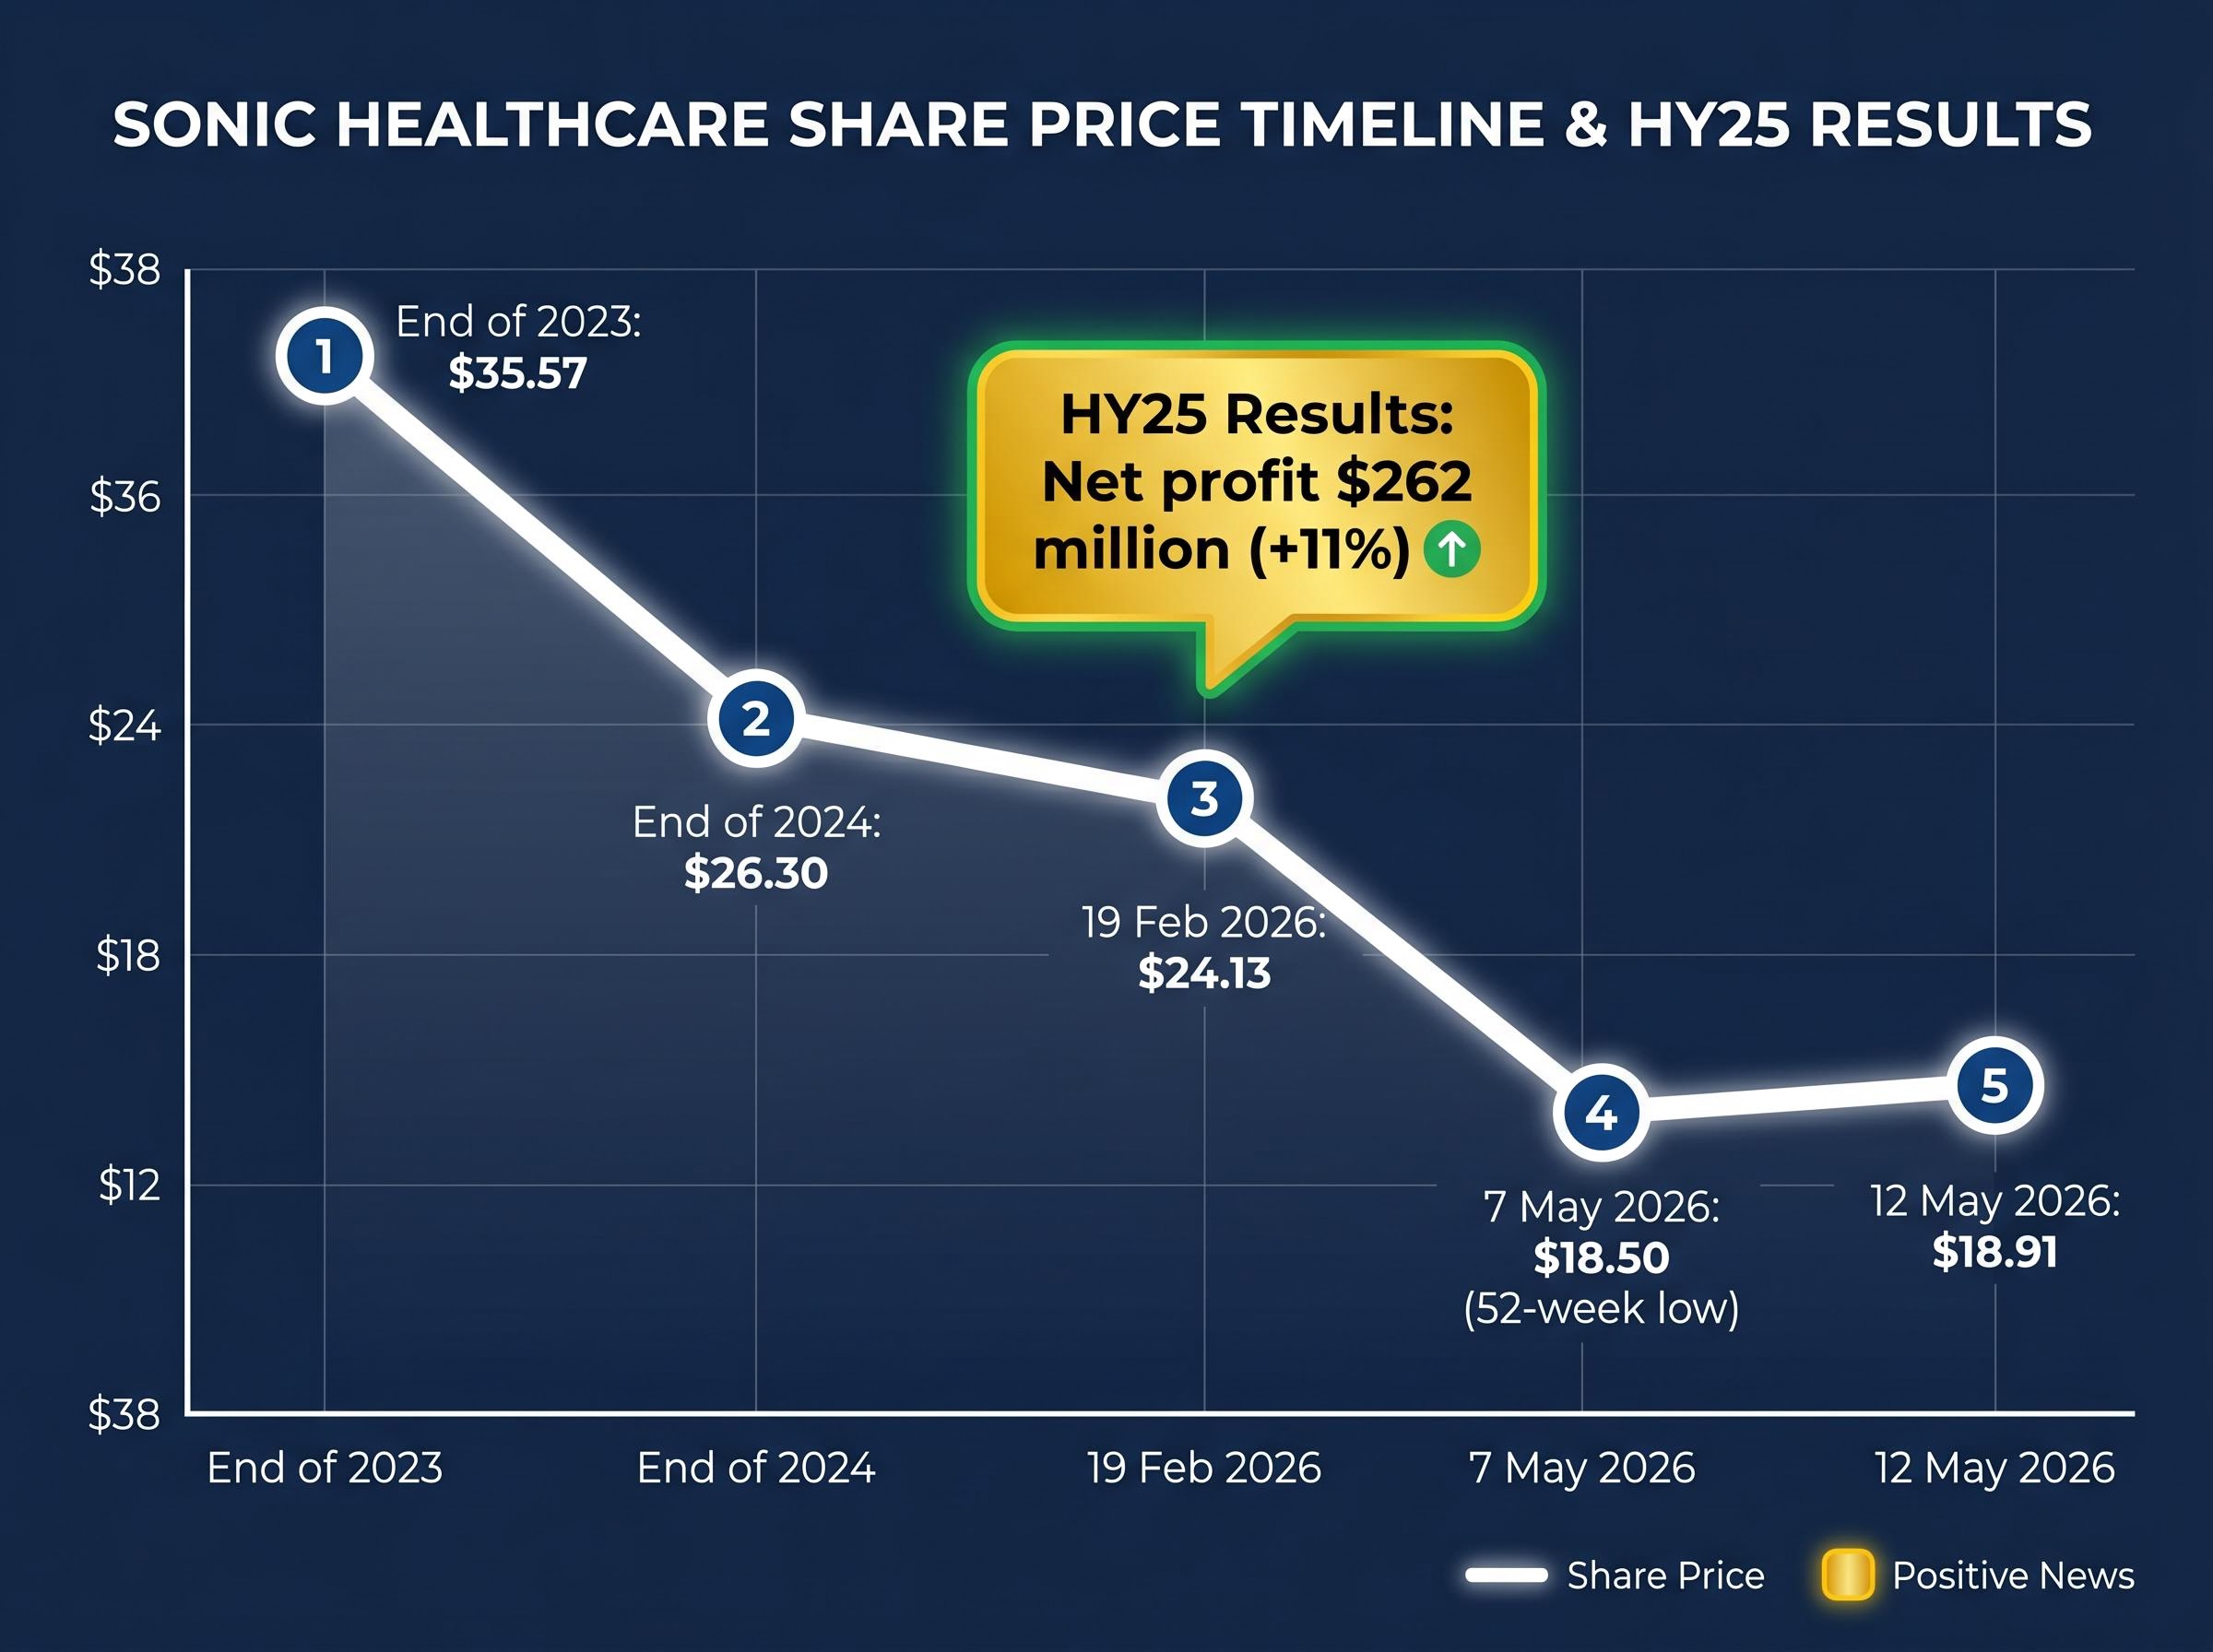
The price chart tells a story of sustained erosion rather than a single shock. Three data points frame the chronology:
- $35.57 at the end of 2023
- $26.30 at the end of 2024
- $18.91 as of 12 May 2026 (AEST close), down 0.21% on the day
The 52-week range of $18.50 to $29.24 confirms SHL is trading near its lowest point of the past year, with the floor reached on 7 May 2026.
The structural driver behind this decline is not company-specific. Post-COVID pathology volume normalisation has compressed revenues and margins across the global diagnostics sector since 2022. Testing volumes that surged during the pandemic have unwound to levels below the pre-COVID baseline in several markets, and the revenue that replaced them has grown at a crawl: SHL’s revenue compound annual growth rate (CAGR) over the three years to FY24 was just 0.8% annualised, reaching $8,967 million.
The ASX healthcare sector rout that has taken the S&P/ASX 200 Health Care Index to a six-year low is driven by five compounding forces, of which post-COVID pathology volume normalisation is one component alongside RBA rate pressure, AUD appreciation, corporate governance failures, and geopolitical cost disruption.
Net profit contracted from $1,315 million to $511 million over three fiscal years through FY24, a decline of more than 60% that reflects the full force of the volume normalisation cycle.
Understanding that this sell-off has a coherent structural cause, rather than being the product of a single earnings miss or management failure, is the first step toward evaluating whether it is fully priced in.
When big ASX news breaks, our subscribers know first
What Sonic Healthcare actually does and why scale matters in pathology
Sonic Healthcare, listed on the ASX since April 1987, operates across a broad diagnostic and healthcare services portfolio:
- Laboratory medicine and pathology
- Diagnostic imaging
- Radiology
- General practice
- Workplace medical services
The company’s geographic footprint spans Australia, New Zealand, Germany, the UK, the US, and smaller markets, giving it an international revenue diversification that none of its domestic-listed peers can match. Market capitalisation stood at $9.35 billion as of 12 May 2026.
Scale in pathology creates a dual dynamic. On the upside, it delivers operating leverage: higher volumes spread fixed laboratory costs across more tests, improving margins. On the downside, recovery from a volume shock is slower when operations span multiple regulatory environments with different reimbursement structures and recovery timelines.
The commercial logic behind SHL’s national pathology network reach was illustrated in early 2026 when BCAL Diagnostics secured SHL as one of two providers for a national rollout of its Avantect early cancer detection blood tests, a partnership that allowed BCAL to achieve coverage without capital-intensive infrastructure build, and that SHL could absorb through existing laboratory workflows.
SHL versus domestic-only peers
The contrast with domestic-only operators is instructive. Healius at $0.495 and Australian Clinical Labs at $1.93 illustrate the severity of the sector-wide de-rating. All three face similar volume normalisation headwinds, but SHL’s European and North American operations add a layer of margin complexity absent from purely Australian businesses. European margin compression has been a recurring theme in analyst discussion of SHL, and it means that reading Australia-only pathology data as a proxy for SHL’s recovery trajectory introduces a category error that can distort investment conclusions.
The right valuation lens for a business in recovery mode
A trailing price-to-earnings (P/E) ratio, the ratio of share price to the most recent twelve months of earnings per share, of approximately 17.1x at $18.91 is the number most screeners will surface for SHL. By itself, it communicates almost nothing.
The distinction that matters is between two valuation frameworks: one designed for mature businesses and one appropriate for companies in recovery.
| Dimension | Mature business lens | Recovery-phase lens |
|---|---|---|
| ROE benchmark | Above 10% sustained | Direction of ROE matters more than level |
| P/E interpretation | Compared to sector average | Meaningless without knowing direction of “E” |
| Revenue focus | Stable or growing revenue base | Multi-year trend and organic growth rate |
| Dividend weight | High; consistency is a quality signal | Low; capital may be better retained for recovery |
| Key question | “Is the business sustaining quality?” | “Is the earnings trajectory inflecting?” |
SHL’s return on equity (ROE), a measure of how efficiently a company generates profit from shareholder funds, sits at 6.8%. That is below the 10% threshold typically expected of a mature, high-quality compounder. But the relevant question for a recovery candidate is not whether 6.8% is adequate in isolation; it is whether it is rising or falling, and from what base.
For a company in recovery, the direction of earnings matters more than the level of any single period’s P/E.
Applying the wrong framework to a recovery-phase business is one of the most common investor errors. SHL’s trailing P/E of 17.1x is neither cheap nor expensive until the trajectory of the denominator, earnings per share of approximately $1.11 on a trailing twelve-month basis, becomes clearer.
The limits of any single metric become clear when examining SHL’s trailing P/E in isolation: share valuation methods that combine P/S screening, EV/EBITDA benchmarking, and DCF analysis produce a materially more complete picture of where earnings need to go for the current price to make sense.
HY25 results: recovery signal or dead-cat bounce?
The half-year results to December 2025, released on 19 February 2026, delivered the first concrete evidence of an earnings inflection after three years of decline.
| Metric | HY25 result | Year-on-year change |
|---|---|---|
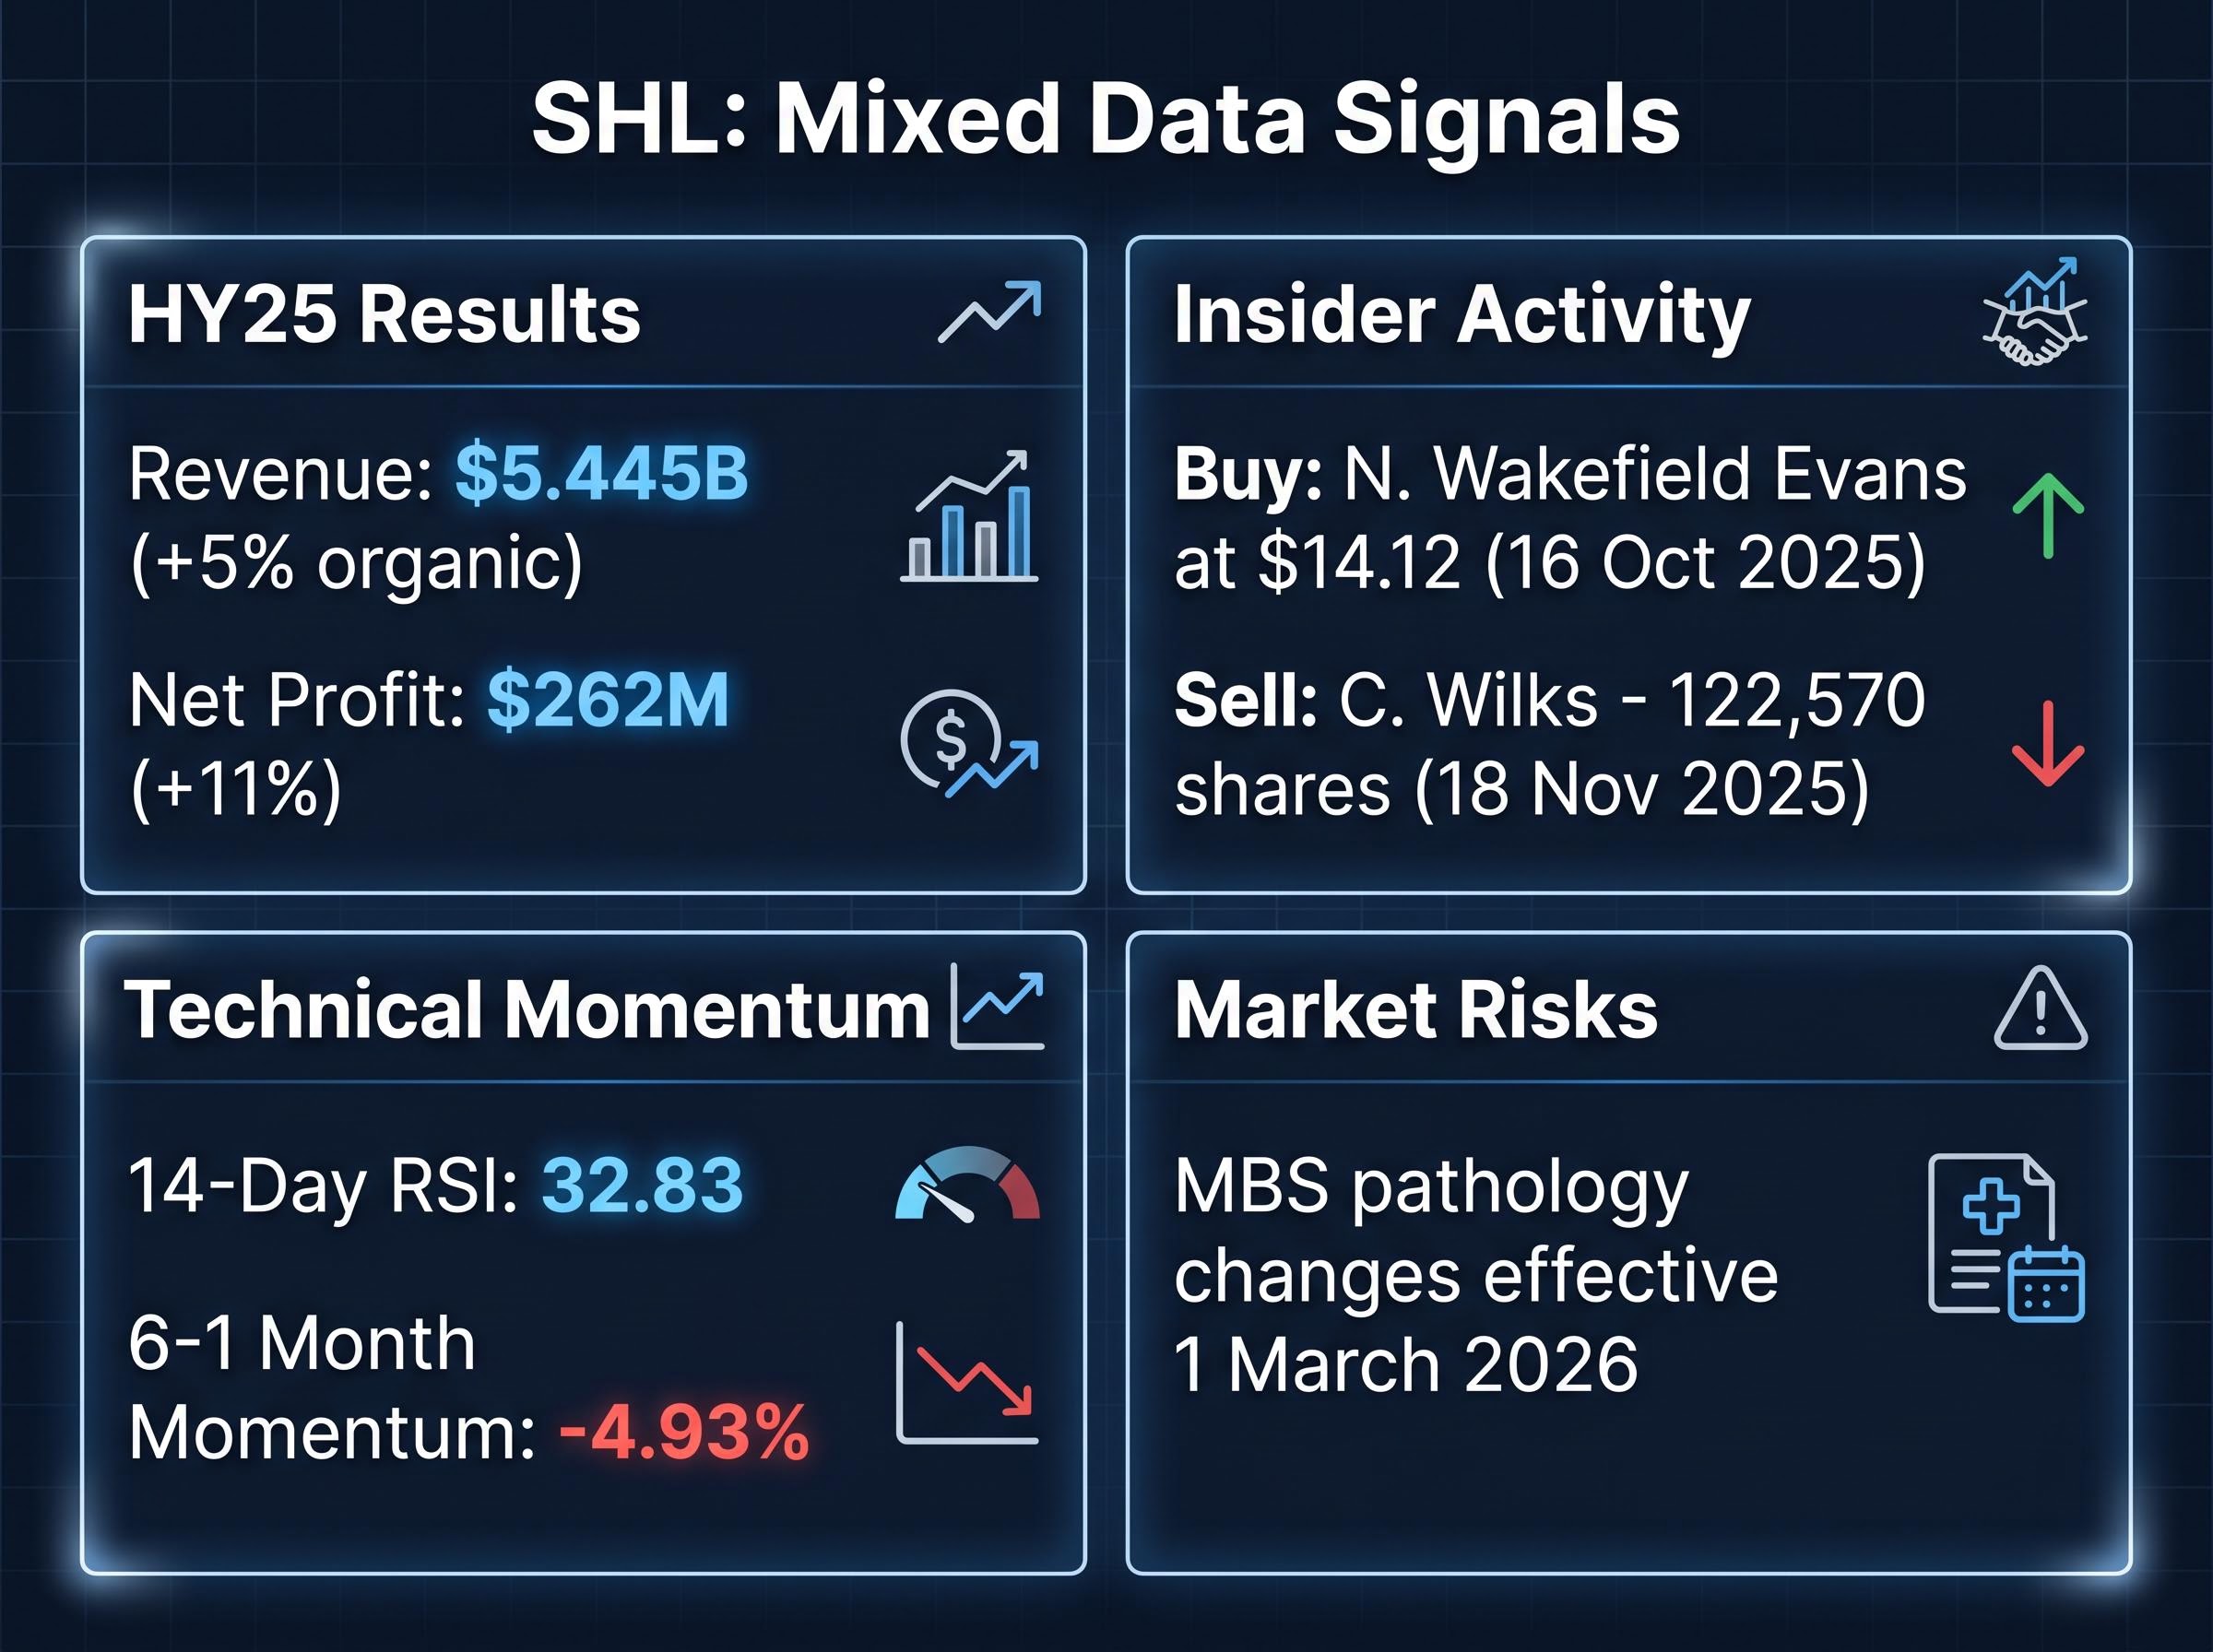
| Revenue | $5.445 billion | +5% organic |
| EBITDA | $907 million | N/A |
| Net profit | $262 million | +11% |
An 11% net profit recovery is a genuine positive data point. It is the kind of inflection that, in isolation, would ordinarily prompt a re-rating of a stock trading near its 52-week low.
The market’s reaction tells a different story. On the day of the Intelligent Investor review (19 February 2026), SHL traded at $24.13. It has since fallen to $18.91, a further decline of more than 21% despite the improving earnings. That divergence signals the market views the pace of recovery as insufficient relative to what is required to justify a higher valuation.
Three conditions would need to be met for a re-rating:
- Sustained profit recovery through the second half of FY25, confirming the HY25 result was not a one-off
- Clearer FY26 guidance at the full-year results release, providing forward visibility the market currently lacks
- Resolution of Medicare Benefits Schedule (MBS) uncertainty following pathology changes effective 1 March 2026, which created an unresolved domestic revenue risk
Technical signals reinforce the caution. StockInvest.us downgraded SHL to Sell on 11 May 2026, projecting a three-month target range of $15.74 to $17.63. The 14-day RSI of 32.83 (according to GuruFocus data as of 11 May 2026) suggests the stock is approaching oversold territory, but approaching oversold is not the same as bottoming.
The gap between a positive earnings result and a falling share price is precisely the space where disciplined analysis matters most.
Insider moves, technical signals, and what the smart money appears to be doing
Three signal categories paint a picture that is genuinely mixed rather than directionally clear:
- Insider buying: Non-executive director Nicola Wakefield Evans purchased shares at $14.12 on 16 October 2025, a price well below current levels. That entry point suggests a board member with information advantages saw value at a significant discount.
- Insider selling: Director Christopher David Wilks disposed of 122,570 shares on 18 November 2025. The motivation is unknown, and drawing conclusions from a single disposal is unreliable, but the contrast with the Wakefield Evans purchase is worth noting.
- Technical momentum: The 14-day RSI of 32.83 is approaching the 30 threshold typically associated with oversold conditions. Momentum, however, remains negative: 6-1 month momentum sits at -4.93% and 12-1 month momentum at -1.28%. Daily volatility is low at approximately 0.67%, which suggests the decline has been orderly rather than panicked.
An RSI of 32.83 suggests the stock is approaching oversold territory, but momentum signals remain negative, and oversold conditions can persist longer than many investors expect.
Insider activity and technical indicators are two of the most frequently misread inputs in retail investing. They function best as probabilistic context rather than binary buy or sell triggers. A director buying at $14.12 does not mean $18.91 is cheap. A negative RSI trend does not mean the stock will fall further. Both are data points that sharpen the picture without resolving it.
The recovery case is real but unconfirmed: what investors should watch next
SHL at 35.3% below its 52-week high of $29.24, with a market capitalisation of $9.35 billion and 494.24 million shares on issue, is a legitimate turnaround candidate. The HY25 net profit growth of +11% is the first recovery signal after three years of decline. But a signal is not a confirmation, and the burden of proof rests squarely on the next two reporting periods.
Bull case watchpoints:
- FY25 full-year results (covering the period to June 2026) confirm or accelerate the HY25 recovery trajectory
- FY26 guidance, if provided at the full-year release, establishes forward earnings visibility
- Organic revenue growth sustains above 5%, indicating the volume normalisation has bottomed
Bear case signals to monitor:
- Second-half FY25 net profit growth decelerates or reverses, validating the market’s scepticism
- MBS pathology changes effective 1 March 2026 compress domestic margins more than anticipated
- European operations fail to stabilise margins, extending the drag on group-level returns
The MBS Online pathology services changes effective 1 March 2026, published under the Health Insurance (Pathology Services Table) Regulations 2020, amended reimbursement conditions for pathology providers in ways that analysts have flagged as a potential domestic margin headwind for operators including SHL.
How to frame the position size decision
The combination of negative momentum, absence of full-year results, and unresolved MBS uncertainty argues against outsized position sizing at current prices. Investors considering entry near these levels may be better served treating SHL as a tracked candidate pending the next earnings release rather than committing a full allocation on incomplete data. The recovery-phase valuation framework outlined above provides the lens; the FY25 full-year results will provide the evidence.
For investors wanting to translate the bull and bear case watchpoints above into a structured analytical framework, our dedicated guide to scenario-based stock valuation walks through how to build bull, base, and bear scenarios with explicit probability weights, using analyst price target divergence as a starting point for modelling what any share price is implicitly betting on.
The 35% discount is a question, not an answer
A 35% pullback from a 52-week high creates the conditions for opportunity. It does not, by itself, constitute the opportunity. The distinction between a mature-business valuation lens and a recovery-phase lens is the most portable analytical tool from this analysis, applicable not only to SHL but to any ASX healthcare stock trading at a significant discount to historical highs.
The next definitive moment for reassessment is the FY25 full-year results, expected to cover the period to June 2026. Investors positioned to act on that data, rather than reacting to the price alone, will be better equipped to determine whether the recovery trajectory has earned conviction or whether the market’s scepticism was warranted all along.
This article is for informational purposes only and should not be considered financial advice. Investors should conduct their own research and consult with financial professionals before making investment decisions. Past performance does not guarantee future results. Financial projections are subject to market conditions and various risk factors.