Goodman Group’s 18% Pullback: Decoding the Metrics That Matter
1 hr ago

Commonwealth Bank of Australia shares trade near $161 while the average of 14 analyst price targets sits around $124, a gap of roughly 30% that has only widened since the stock’s record single-day fall on 13 May 2026. For a company that anchors superannuation portfolios, self-managed funds, and retail investor watchlists across the country, the distance between where the market prices CBA and where formal valuation methods place it is not a peripheral curiosity. It is the central question facing anyone deciding whether to buy, hold, or sell Australia’s largest bank.
That 13 May earnings miss, which sent the stock down 10.4% in a single session, sharpened the debate about whether the premium CBA commands over its peers reflects durable franchise quality or the tail end of a momentum trade. What follows walks through two formal valuation models applied to CBA’s own numbers, examines the qualitative arguments on both sides of the premium debate, and maps the macro conditions that will determine whether the gap between price and estimated fair value closes or persists.
Before interpreting the premium, the raw numbers deserve to sit side by side. CBA closed at $153.67 on 13 May 2026 after falling 10.4%, then recovered to around $161 by 19 May. The pre-drop close on 12 May was approximately $171-$173.
Against that price, two standard valuation approaches produce outputs well below the current level.
The price-to-earnings method takes CBA’s FY24 earnings per share of $5.63 and multiplies it by the 18x sector average PE ratio, yielding a value of $101.54. CBA’s current share price implies a PE of approximately 28.9x, roughly 60% above its peer group.
The base dividend discount model (DDM), using a blended range of growth rates (2%-4%) and discount rates (6%-11%), produces a central estimate of $98.33. Using a forward dividend of $4.76, that figure rises to $100.66. When adjusted for gross dividends of $6.80 (incorporating franking credits), the DDM output reaches $143.80.
| Method | Key Input | Output Valuation | Gap vs ~$161 |
|---|---|---|---|
| PE Method | $5.63 EPS × 18x sector PE | $101.54 | ~37% below |
| Base DDM | $4.65 DPS, blended rates | $98.33 | ~39% below |
| Gross Dividend DDM | $6.80 grossed-up DPS | $143.80 | ~11% below |
Sensitivity matters. Depending on the growth and risk rate assumptions fed into the DDM, CBA’s modelled value ranges from $52.89 (11% discount rate, 2% growth) to $238.00 (6% discount rate, 4% growth). Model outputs are only as reliable as the assumptions behind them.
The two models produce different outputs because they are answering different questions. Neither is broken. Each captures a distinct dimension of value, and understanding the gap between them is more useful than picking one and ignoring the other.
A PE ratio compresses a company’s valuation into a single question: how much is the market paying for each dollar of earnings? It has three practical applications:
Using the sector average PE as the benchmark is not a claim that CBA should trade at the sector average. It is a starting point that isolates how much premium the market currently assigns.
ASX bank valuation methods including price-to-book, which compares market capitalisation to net asset value, and discounted cash flow analysis add dimensions that PE and DDM alone cannot capture, particularly where earnings are distorted by credit cycle timing, regulatory capital changes, or one-off remediation charges that inflate or suppress reported EPS in any given period.
The DDM asks a different question: what is a stream of future dividends worth today, discounted at a rate that reflects the risk of holding the stock?
The formula divides the annual dividend by the difference between the required return and the expected growth rate. For CBA, using the FY24 dividend of $4.65 (fully franked), with FY25 forecasts of $4.75-$4.80, the base DDM produces $98.33 and the forward estimate reaches $100.66.
The gross dividend DDM at $143.80 uses $6.80, which accounts for the value of franking credits. This adjustment is relevant only for Australian tax residents entitled to those credits, but for that audience, it captures real economic value the base model omits. Professional analysts typically run multiple scenarios across different growth and risk rate combinations, then average the results to manage assumption sensitivity.
The gross dividend figure of $6.80 used in the adjusted model incorporates the value of franking credits, and franking credit adjustments in DDM analysis can shift effective yields materially for Australian retirees and superannuation funds in pension phase, where the full credit is often received as a refundable tax offset rather than a partial reduction in tax owed.
The bull case for CBA’s valuation premium rests on three reinforcing pillars, and at their strongest, these arguments explain why sophisticated institutional investors have tolerated a gap that screens as overvaluation on every standard metric.
“Australia’s best retail banking franchise” Macquarie described CBA in those terms in a November 2024 banking sector update, citing dominant household deposit share, mortgage market leadership, superior Net Promoter Scores, and digital engagement metrics that peers have not matched.
The franchise argument is the foundation. CBA’s CommBank app engagement, digital sales penetration, and deposit funding advantage create a more stable earnings stream and lower funding risk than competitors. Morningstar Australia reinforced this on 10 March 2025, reiterating CBA’s “wide economic moat” based on scale, brand, and switching costs.
The returns argument layers on top. Morgan Stanley analyst Richard Wiles noted in February 2025 that CBA’s “consistently higher return on equity and better cost discipline” justify part of the premium, even as he flagged that the magnitude looked stretched versus historical norms.
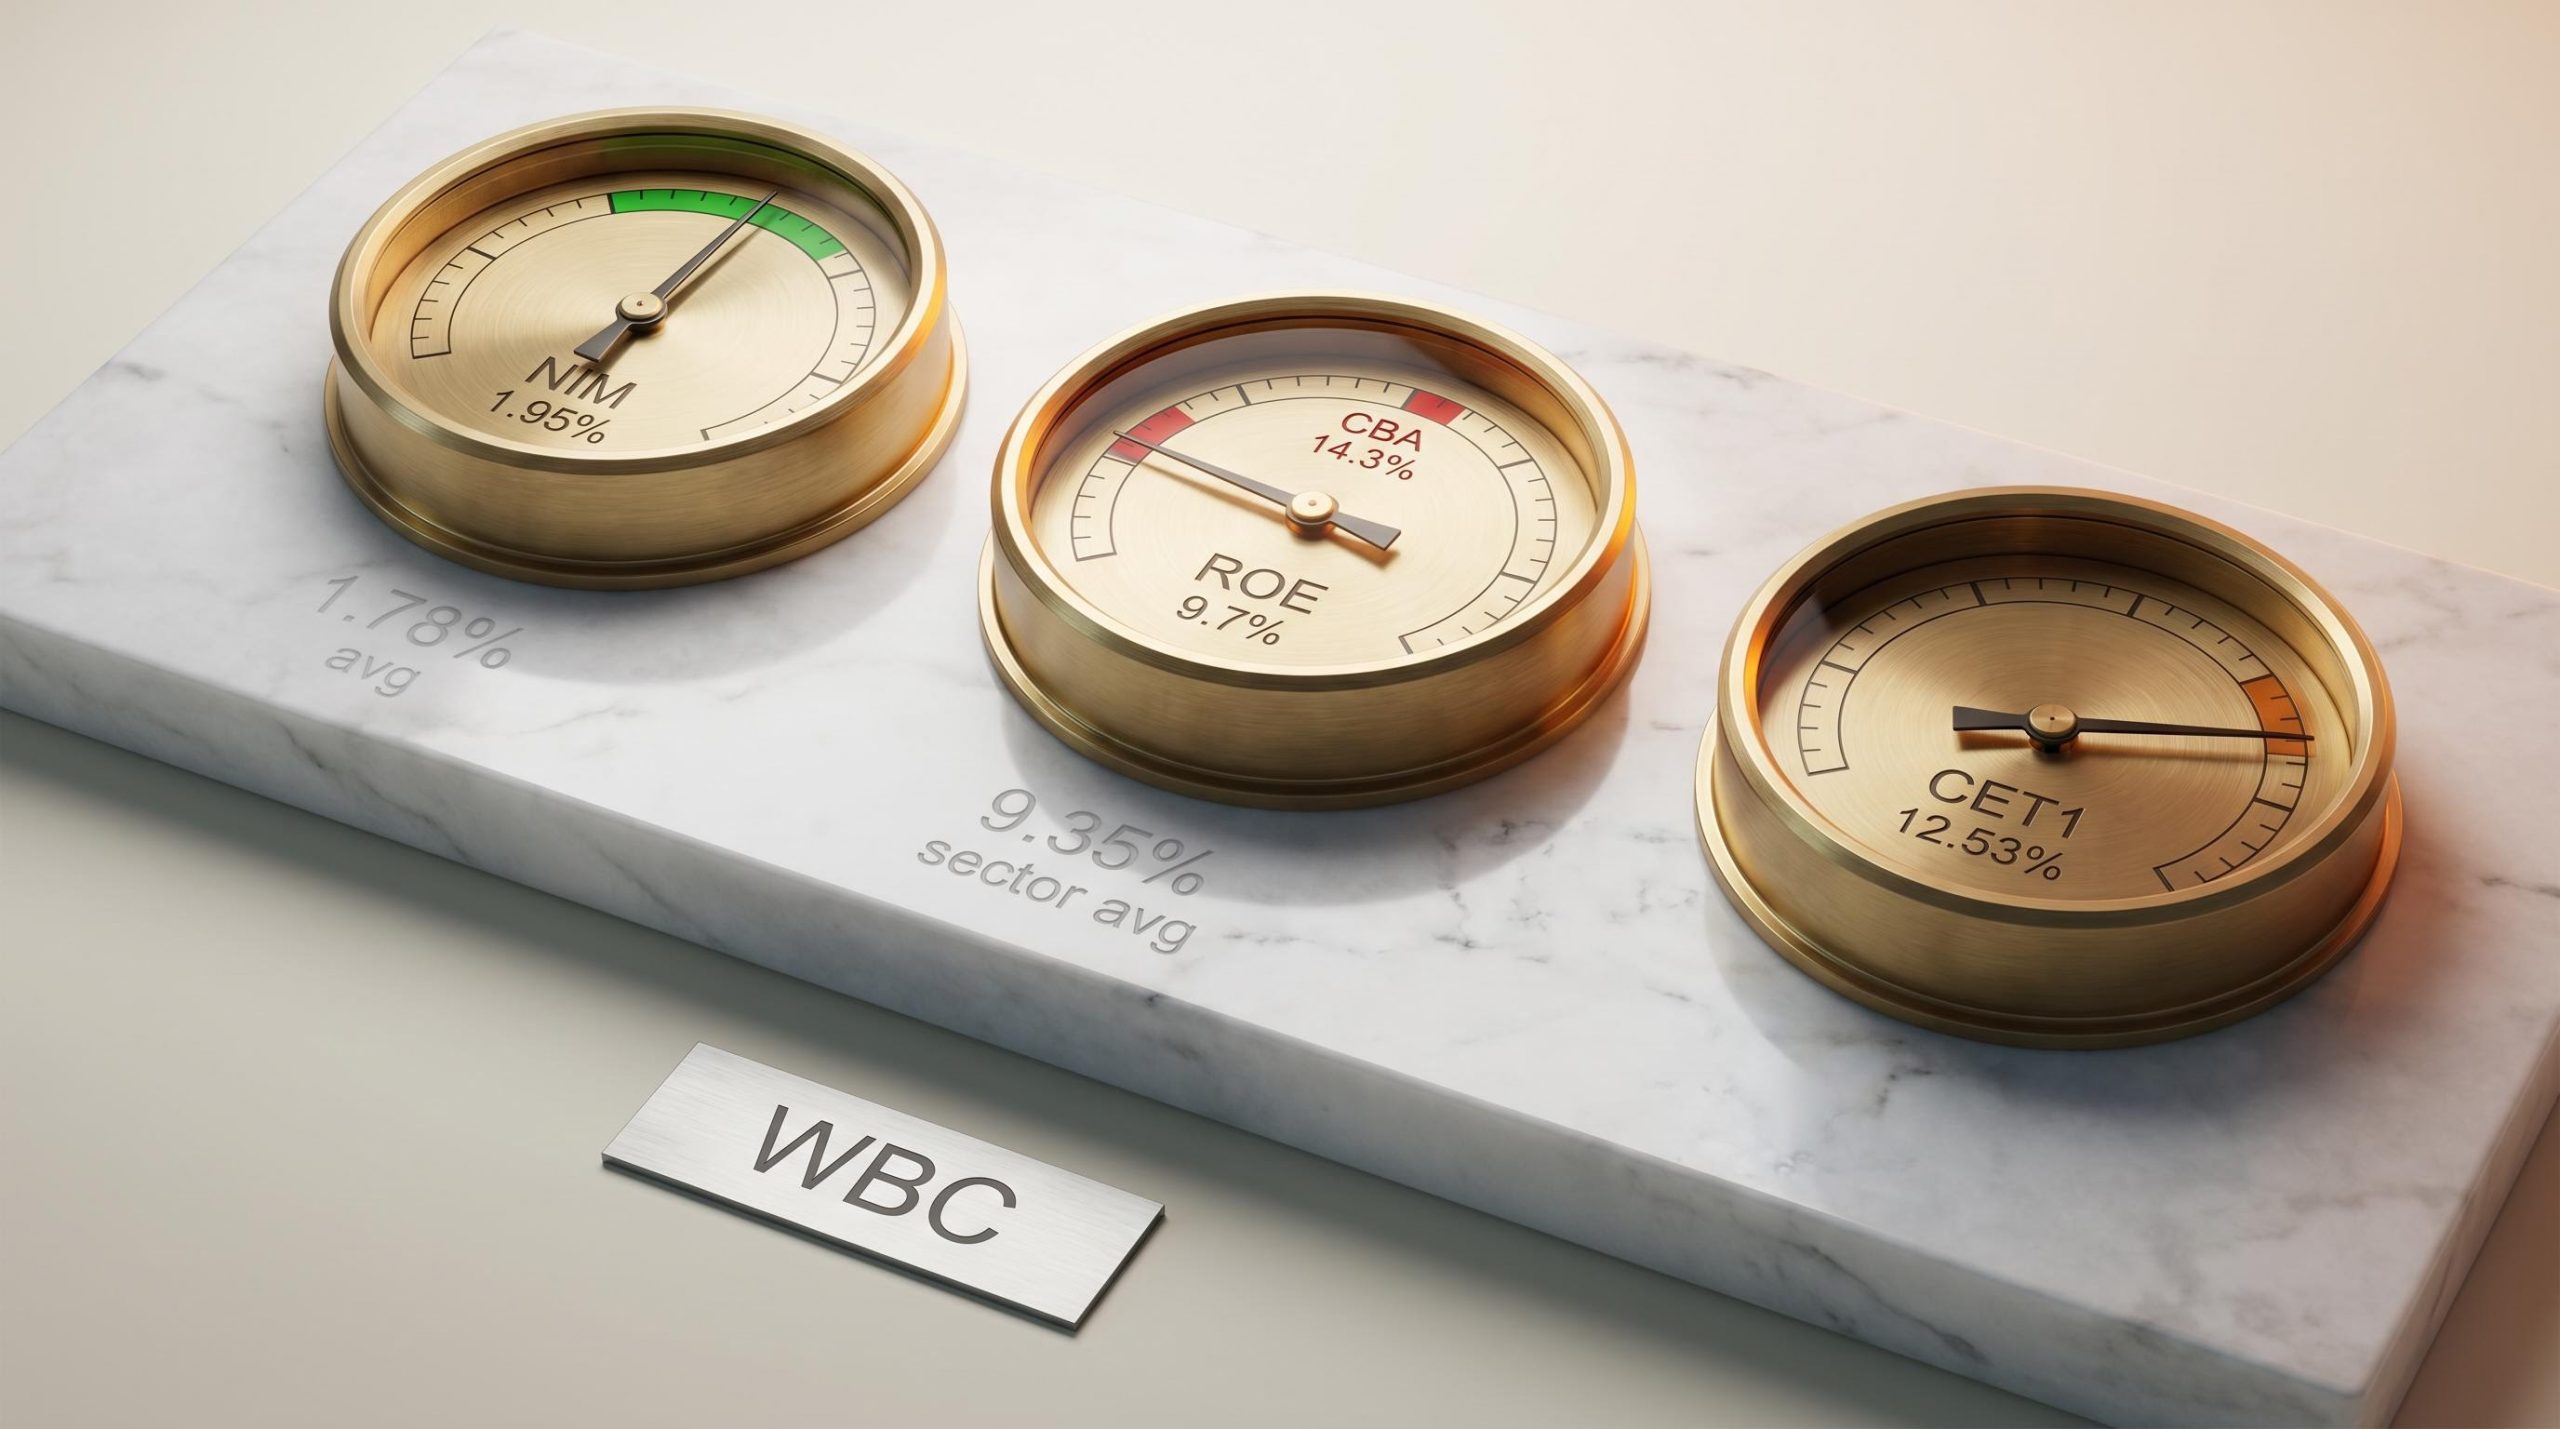
NIM compression at CBA, with net interest margin falling to 1.99% in 1H FY26 due to competitive mortgage pricing, sits alongside the ROE leadership narrative as one of the two forces pulling the earnings story in opposite directions: the returns advantage is real, but the margin trajectory is contracting, and analysts who built their price targets on the pre-compression NIM are revising downward.
The risk profile argument completes the picture:
The debate is not about whether CBA deserves a premium. It does. The debate is about whether a 60%-plus premium over sector PE is rational when earnings growth forecasts sit at 1-2% and the broker community overwhelmingly prices the stock for a correction.
The growth problem is the starting point. FY25 EPS consensus of approximately $5.70-$5.75 implies only 1-2% growth over FY24 actuals of $5.63. Dividend growth of 2-3% (to around $4.75-$4.80) tells the same story. These are not the growth rates that typically sustain a near-29x PE multiple.
The broker consensus provides quantitative weight. The 14-analyst consensus target of approximately $124.42 (updated post-13 May earnings revision) sits roughly 22-23% below the current share price. The rating mix as of 8 May 2026 stood at 3 Buy, 7 Hold, 6 Sell, with some aggregators shifting to a “Strong Sell” tilt following the earnings miss.
| Source | Stance | Commentary |
|---|---|---|
| Morningstar (Mar 2025) | 1-star (most overvalued) | High expectations for sustained margin strength leave little safety margin |
| Jarden (Feb 2025) | Underweight | “Most expensive major bank on any metric we track” |
| Macquarie | Lowered target post-13 May | Acknowledges franchise quality; price reflects perfection |
| Morgan Stanley | Lowered target post-13 May | Premium “looks stretched versus history” |
| Consensus (14 analysts) | ~$124.42 target | ~22-23% below current price |
AustralianSuper, quoted in October 2024 coverage, described CBA as “a high-quality franchise but priced for perfection.”
Institutional behaviour reinforces the point. AustralianSuper trimmed CBA exposure relative to other majors. Value managers including Perpetual and Investors Mutual Limited are explicitly underweight, preferring cheaper peers offering higher dividend yields and lower PE ratios. Short interest remains relatively low; scepticism is expressed through underweights and pairs trades (short CBA, long cheaper majors) rather than outright directional shorts.
Valuation models use static inputs. Whether the gap between CBA’s price and its estimated fair value closes, and in which direction, depends on how four macro variables evolve.
The RBA’s prolonged hold at 4.35% has supported CBA’s net interest margin through higher asset yields. The benefit is real but limited: competitive mortgage pricing has squeezed pass-through, and the same elevated rates pressure household cash flow on CBA’s large mortgage book. Should the anticipated late-2026 rate cuts materialise, CBA’s margin trajectory would face compression, though lower rates could also reduce credit stress across the mortgage portfolio.
The RBA cash rate decisions and accompanying monetary policy statements set the baseline from which CBA’s net interest margin trajectory is modelled, with the current 4.35% hold representing the outer boundary of the rate support that has underpinned CBA’s asset yield performance through the 2024-2026 period.
Resilient housing prices and low forced-selling have kept CBA’s collateral values strong and mortgage arrears contained. These are the conditions that have validated the bull case to date. AMP Chief Economist Shane Oliver warned in September 2024 that CBA’s premium embeds a “benign view of the housing cycle,” offering “little compensation” for housing-related downside risk. The same leveraged household sector that has proven resilient is also the channel through which a rate or unemployment shock would hit CBA’s loan book fastest.
The weight of quantitative evidence converges below the current share price. Ranked from lowest to highest, the four valuation anchors are:
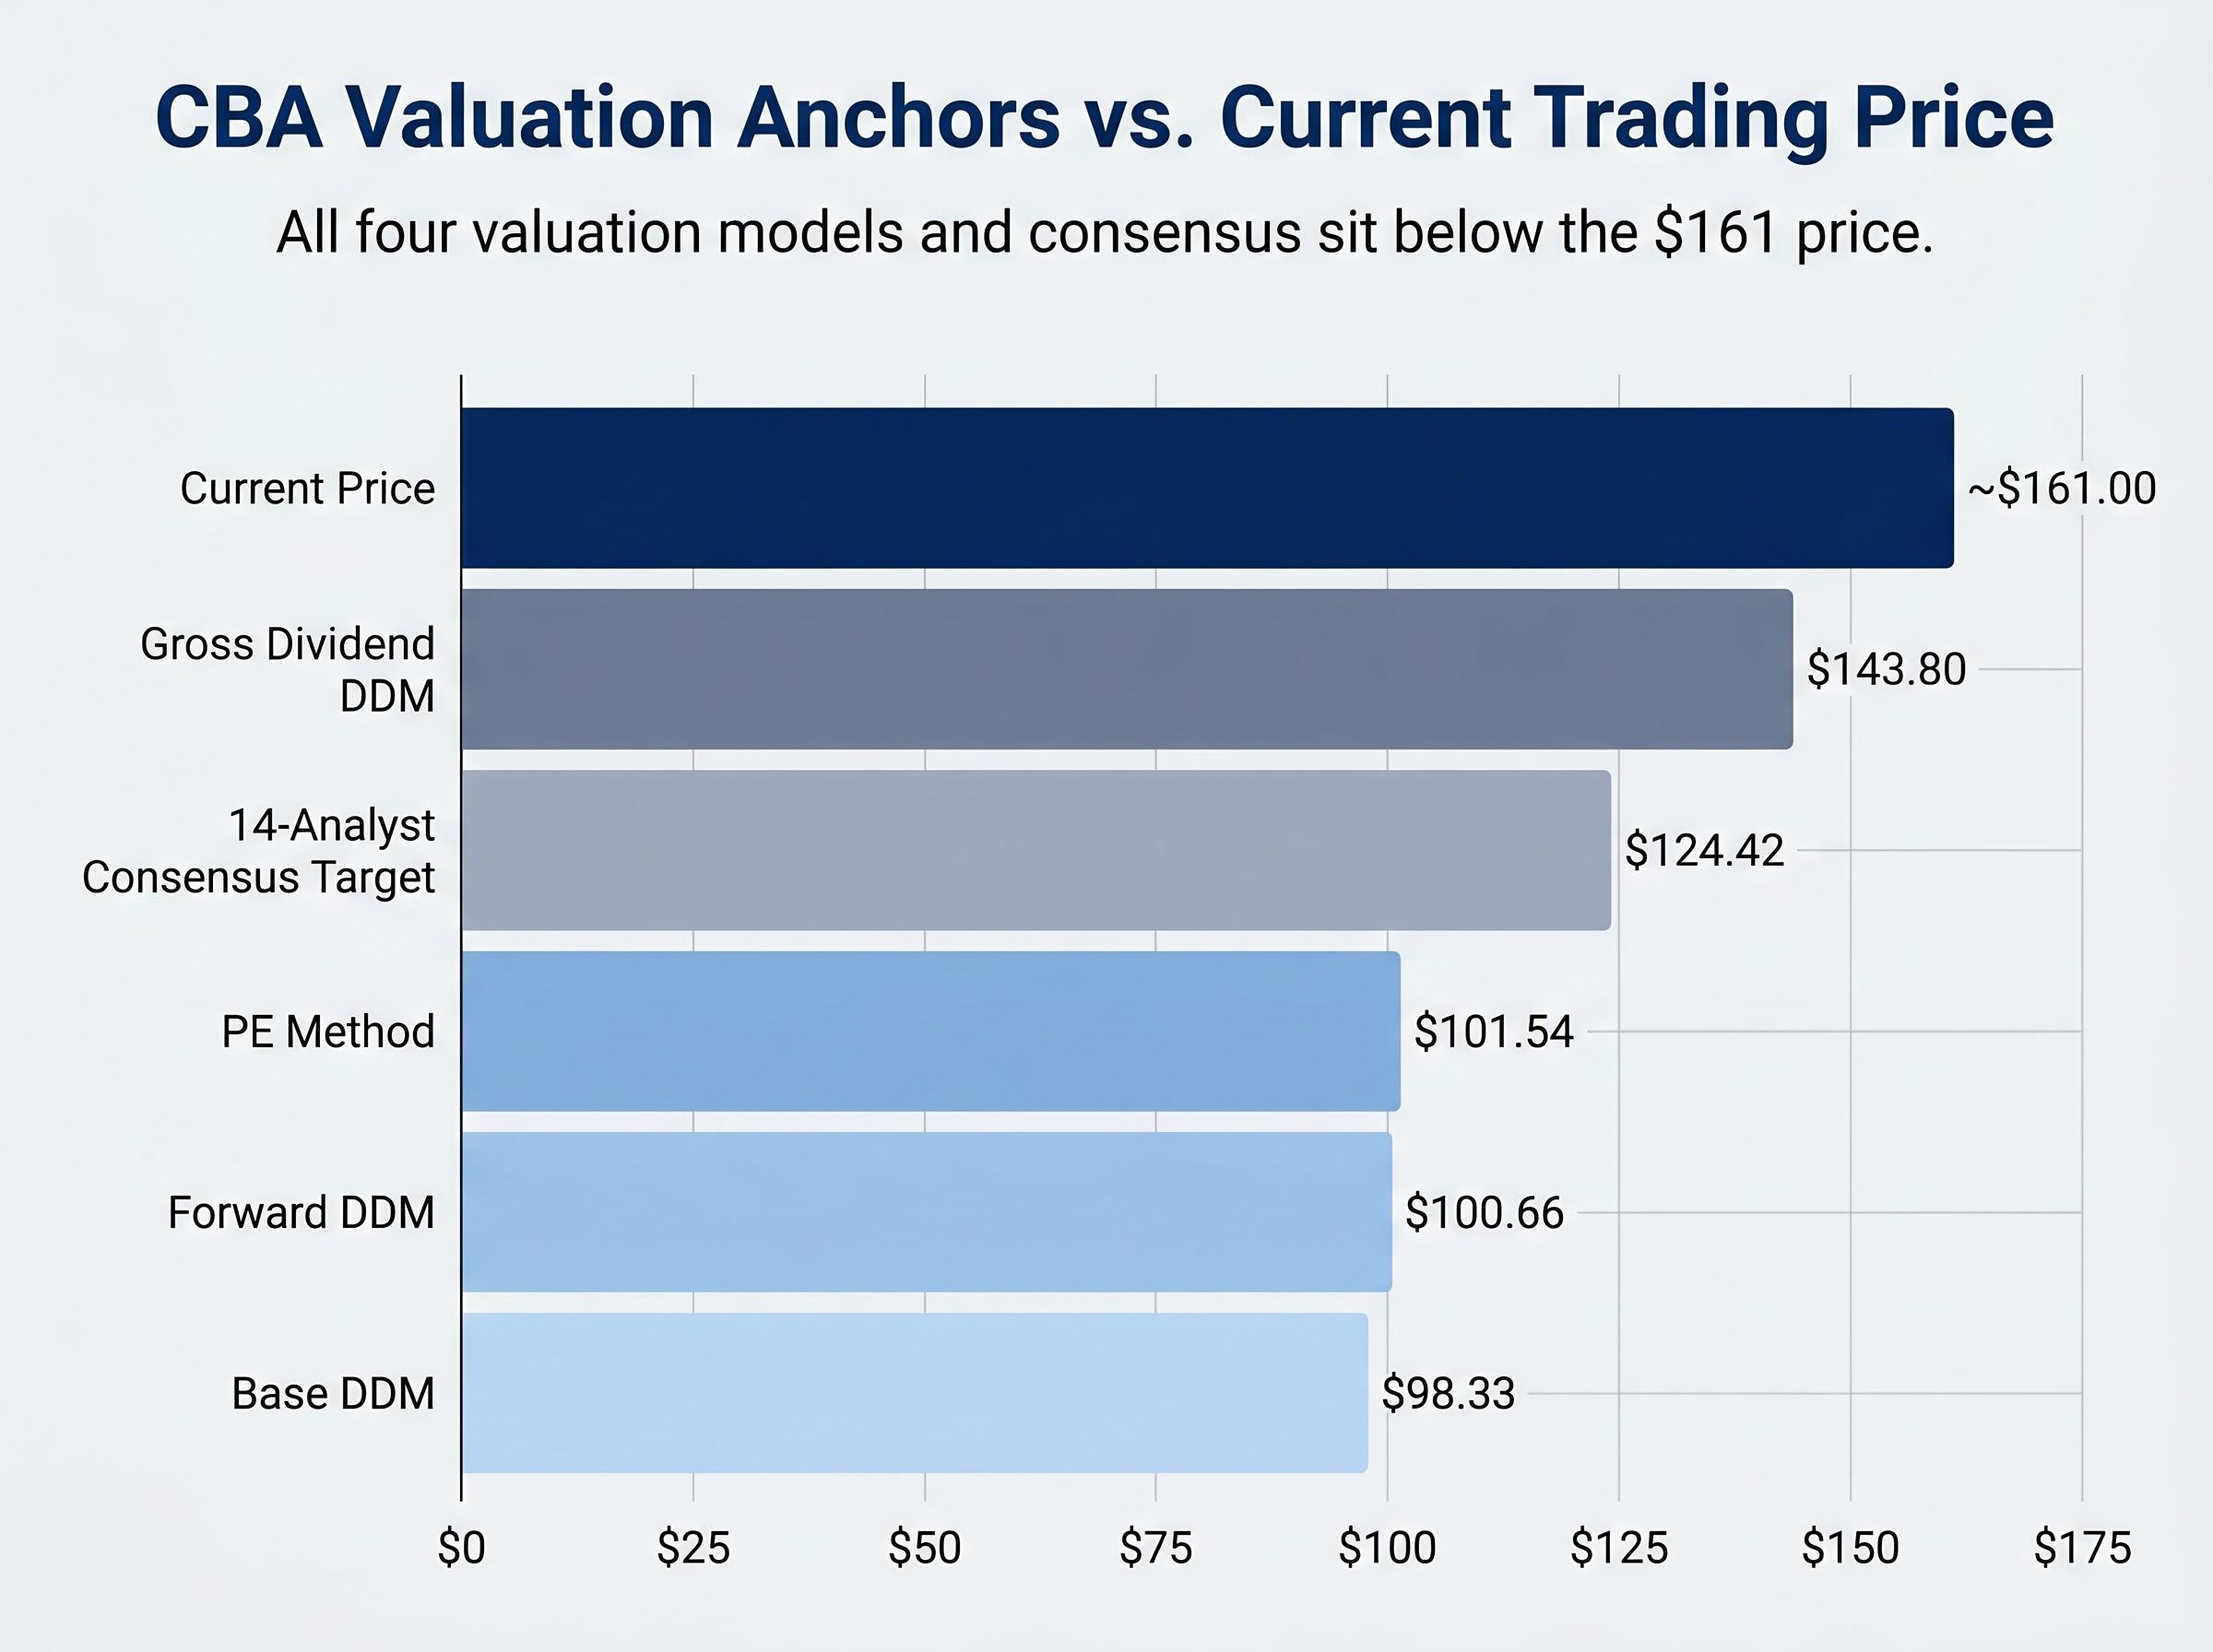
The 14-analyst consensus target of $124.42 sits between the base models and the gross dividend DDM. Even after the 13 May 2026 record single-day fall of 10.4%, the stock remains well above all four anchors.
CBA is a genuinely superior franchise. The premium is earned in principle. The evidence disputes the magnitude: FY25 earnings and dividend growth of 1-3% does not independently support a near-29x PE, and the macro conditions ahead (stable but not strongly growth-accretive) offer limited scope for the kind of earnings surprise that might close the gap from below.
Whether the gap narrows through price decline, earnings re-rating, or prolonged premium persistence is a function of the four macro variables identified above, each of which investors can monitor as new data arrives.
For investors wanting to apply a structured framework to the macro variables identified here, our comprehensive walkthrough of Australian bank stock assessment covers a five-factor checklist across income structure, property exposure, unemployment trajectory, management discipline, and arrears trends, with current data points for each factor as of May 2026 and guidance on how often to revisit each input as conditions evolve.
This article is for informational purposes only and should not be considered financial advice. Investors should conduct their own research and consult with financial professionals before making investment decisions. Past performance does not guarantee future results. Financial projections are subject to market conditions and various risk factors.
The dividend discount model (DDM) estimates a stock's fair value by calculating the present value of its future dividends, discounted at a rate that reflects investment risk. Applied to CBA using a FY24 dividend of $4.65 and blended growth and discount rates, the base DDM produces a central estimate of $98.33, rising to $143.80 when franking credits are incorporated.
CBA commands a premium because of its dominant retail banking franchise, superior return on equity, digital leadership via the CommBank app, and a wide economic moat recognised by analysts including Morningstar. However, with FY25 earnings growth forecast at only 1-2%, many analysts argue the magnitude of the premium, implying a PE near 29x versus an 18x sector average, is difficult to justify on fundamentals alone.
CBA shares fell 10.4% on 13 May 2026 following an earnings miss, marking the stock's largest single-day decline on record. The share price dropped to approximately $153.67 before recovering to around $161 by 19 May 2026.
Franking credits represent tax already paid by CBA on its profits and can be claimed as a tax offset by eligible Australian residents. When the grossed-up dividend of $6.80 (incorporating franking credits) is used in the DDM instead of the cash dividend, the modelled fair value rises from $98.33 to $143.80, reflecting real economic value for superannuation funds and retirees who can access the full credit.
Four key variables will drive whether the valuation gap narrows: RBA interest rate decisions (currently held at 4.35%), Australian housing price trends, the unemployment rate (rising gradually toward 4.5% by March 2026), and consumer confidence levels. Rate cuts anticipated in late 2026 could compress CBA's net interest margin while also reducing mortgage stress across its large home loan book.