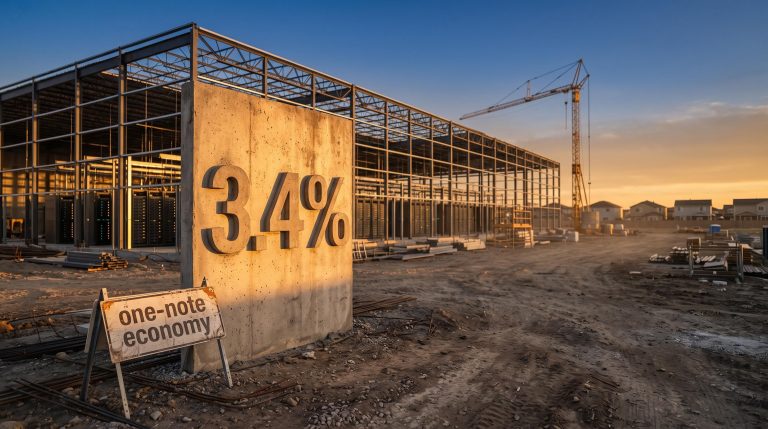
A 4.4% one-day fall in the S&P 500 usually means one thing: investors are selling everything at once. Yet when the index dropped to 7,353.73 on Thursday, 5 November 2026, Cboe’s measure of implied correlation reached only about 22%. Over the prior 20 years, it has averaged roughly 70% on comparable down days.
That gap is the story. The S&P 500 then rebounded 2.35% to 7,549.94 yesterday, Monday, 9 November, and the VIX fell to 19.91. The rebound looks less surprising once you see what correlation was signalling during the drop.
If you hold an index fund or trade options, this signal deserves your attention before December options expiration. It shows how widely the stress spread through the market, and that affects how worried you should be about your broader holdings.
Here is how to read a weak correlation reaction, what a 17-23 VIX range implies for the weeks ahead, and which catalysts could break the pattern. This explains this week’s market behaviour. It is not trading advice.
What is implied correlation, and why did it barely move in a 4.4% selloff?
The screen showed a sharp fall in the index and a correlation gauge that hardly reacted. To see why that matters, you need to know what the gauge measures.
How the index works
Cboe publishes two implied correlation indices, COR1M (one month) and COR6M (six months). Each estimates the average correlation that options prices expect among S&P 500 constituents. Correlation is the degree to which stocks move in the same direction at the same time.
A high reading means the market expects stocks to rise and fall together. A low reading means the market expects them to move independently, with some rising while others fall.
The contrast that matters COR1M reached about 22% on Thursday. On one-day S&P 500 falls of around 4%, it has averaged roughly 70% over the past two decades, according to Cboe.
Cem Karsan and Noel Smith of Kai Wealth, speaking on Tasty Live, put the typical reading at 60-70 in drawdowns of this size, compared with the mid-20s this time. Smith said the correlation response relative to the size of the move was the weakest on record. Cboe called the event highly unusual.
Why sector rotation keeps it low
The answer is dispersion. Dispersion means individual stocks or sectors are moving in different directions. The S&P 500 is cap-weighted, which means its largest companies have the most influence on the index. A sharp fall in a handful of heavyweight technology and AI names can therefore drag the index down while much of the market holds up.
Cboe’s Mandy Xu said the selloff was unusually concentrated in tech, and five of eleven S&P sectors finished the week higher. Treasuries traded calmly, another sign the selling did not spread. Cboe has not yet published a post-rebound COR1M close.
| Measure | Typical ~4% selloff | 5 November selloff |
|---|---|---|
| S&P 500 move | Around -4% | -4.4% |
| Implied correlation | Roughly 70% | About 22% |
| VIX | Elevated | 28.18 |
| Sector breadth | Broad selling | 5 of 11 sectors up for the week |
For you, a low reading means the market was repricing one corner of equities rather than selling everything. That is why the fall did not trigger the forced, indiscriminate de-risking that usually turns a bad day into a bad month.
If you hold several tech names, stock correlation trading is a quick way to check whether they are separate ideas or one theme, because a concentrated selloff like this one hits stacked positions far harder than a diversified book.
When big ASX news breaks, our subscribers know first
Implied versus realised volatility: why did the VIX fall back so fast?
The VIX rose quickly once investors rushed to buy protection. It fell just as quickly once that protection began to look overpriced.
Implied volatility is the price the market pays today for protection against future moves. Realised volatility is the movement that actually happens. Karsan and Smith frame it this way: implied volatility is what you pay for insurance, and realised volatility is the damage that occurs.
The premium you pay for insurance is not guaranteed to pay off for sellers either, because implied versus realised volatility can invert in slow-moving crises that options markets are too calm to price.
- 5-6 November: VIX at 28.18, up 69.7% in a single session
- Friday, 6 November: reported around 23.5
- Monday, 9 November: closed at 19.91, down 22.35%
SpotGamma tracks the spread between the VIX and one-month realised S&P 500 volatility. That spread normally sits around 3-4 points. The extra amount reflects the premium buyers pay for protection.
| Moment | VIX minus realised volatility |
|---|---|
| Normal conditions | About 3-4 points |
| Before the election | About 5-6 points |
| Initial relief rally | About 4 points |
| Subsequent selloff | About 11 points (briefly near 15) |
An 11-point gap means you were paying heavily for insurance against a crash that never arrived. When the follow-through failed to come, sellers collected that premium and implied volatility fell. According to SpotGamma, front-end SPX implied volatility dropped from roughly 25% on Thursday to about 17.5%-18.5% by Monday, with the 20 November expiration near 16.5%.
Smith said implied volatility was still above realised volatility heading into Monday, a rare condition he does not expect to last. He expects both measures to fall, with realised volatility lagging. Karsan said breaking the pattern would have required a further quick fall of roughly 4-5%.
Karsan’s range Karsan expects the VIX to settle at about 17-23, possibly nearer 17, rather than returning to the 14-15 zone.
That range points to conditions that are elevated but orderly. You should expect smaller daily swings than during the selloff, but you should not assume the calm of a 14-15 VIX is coming back. Read the VIX as a price rather than a fear gauge, and you can judge whether option premiums look rich or cheap compared with how much the market is actually moving.
How dealer hedging amplified the drop and may now fuel compression into December opex
The falling insurance price is only part of the explanation. The other part is how the banks that sell options hedge their books, and why those hedging forces reverse once volatility eases.
Gamma: how the drop accelerated
Dealers are the market makers on the other side of your options trades. Gamma measures how quickly an option’s sensitivity to the share price changes as that price moves. When dealers are short gamma, they must sell as the market falls and buy as it rises. That procyclical hedging can turn an orderly decline into a rout.
Most options trades have a market maker on the other side, so options dealer hedging can move a stock more than the original trade did, though research suggests the gamma effect on daily volatility is real but modest.
SpotGamma attributed part of Thursday’s fall to negative gamma concentrated around the 7,400 area. The index broke through that level and hedging flows pushed it lower.
Vanna, charm and the pull toward December
Vanna measures how an option’s delta, its sensitivity to the share price, changes when implied volatility changes. As implied volatility falls, dealers who are short options may need to hold fewer hedges, which can create buying. Charm measures how delta changes simply as time passes, and its effect grows stronger near expiration.
- Initial shock: AI and tech names fall and pull the cap-weighted index down.
- Gamma amplification: short-gamma dealers sell into the weakness.
- Volatility repricing: demand for puts lifts implied volatility and can force more hedging.
- Vanna response: falling implied volatility can turn dealers into buyers.
- Charm response: as options age, deltas shift and hedges are adjusted.
- Expiration convergence: hedging pressure fades as positions close, roll or expire.
- Compression loop: a lower VIX feeds further vanna buying and less hedging demand.
The S&P 500 had been weak on three consecutive Fridays, and the latest was rescued from becoming a fourth. Karsan said much of the open interest sits in December options expiration, about six weeks away. He expects heavy buybacks of hedges and volatility compression into that date unless a shock arrives. He described the risk window as roughly a week to a week and a half.
| Event | Date | Why it matters |
|---|---|---|
| November VIX expiration | Wednesday, 18 November | Volatility hedges roll off the day after Nvidia reports |
| November monthly opex | Friday, 20 November | Gamma near the 7,400 area may stay influential until then |
| December VIX expiration | Wednesday, 16 December | Volatility positioning resets |
| December monthly opex | Friday, 18 December | Heavy open interest that Karsan expects to drive compression |
None of this guarantees a rally. It works only if the market stops falling and event risk passes. Hedging flows explain why moves can overshoot in both directions, so you should treat the rebound as partly mechanical rather than proof that fundamentals have improved.
What could break the pattern before expiration?
The compression case rests on a calendar, and the first dates on it carry real risk.
Nvidia reports earnings on Tuesday, 17 November, after the close, and the November VIX expiration follows the next day. The stock fell roughly 5%-6.5% on 9 November, even as the broader market rallied. The fall came after the board opened an independent investigation into whether CEO Jensen Huang was targeted in a foreign spy plot. Nvidia said it had no reason to believe company secrets were compromised. Karsan said the administration reportedly knew about the matter for six to nine months and questioned the timing of its release.
Published estimates of the options-implied earnings move range from about 8.5% to 13.1%, which shows how uncertain the market is about the result.
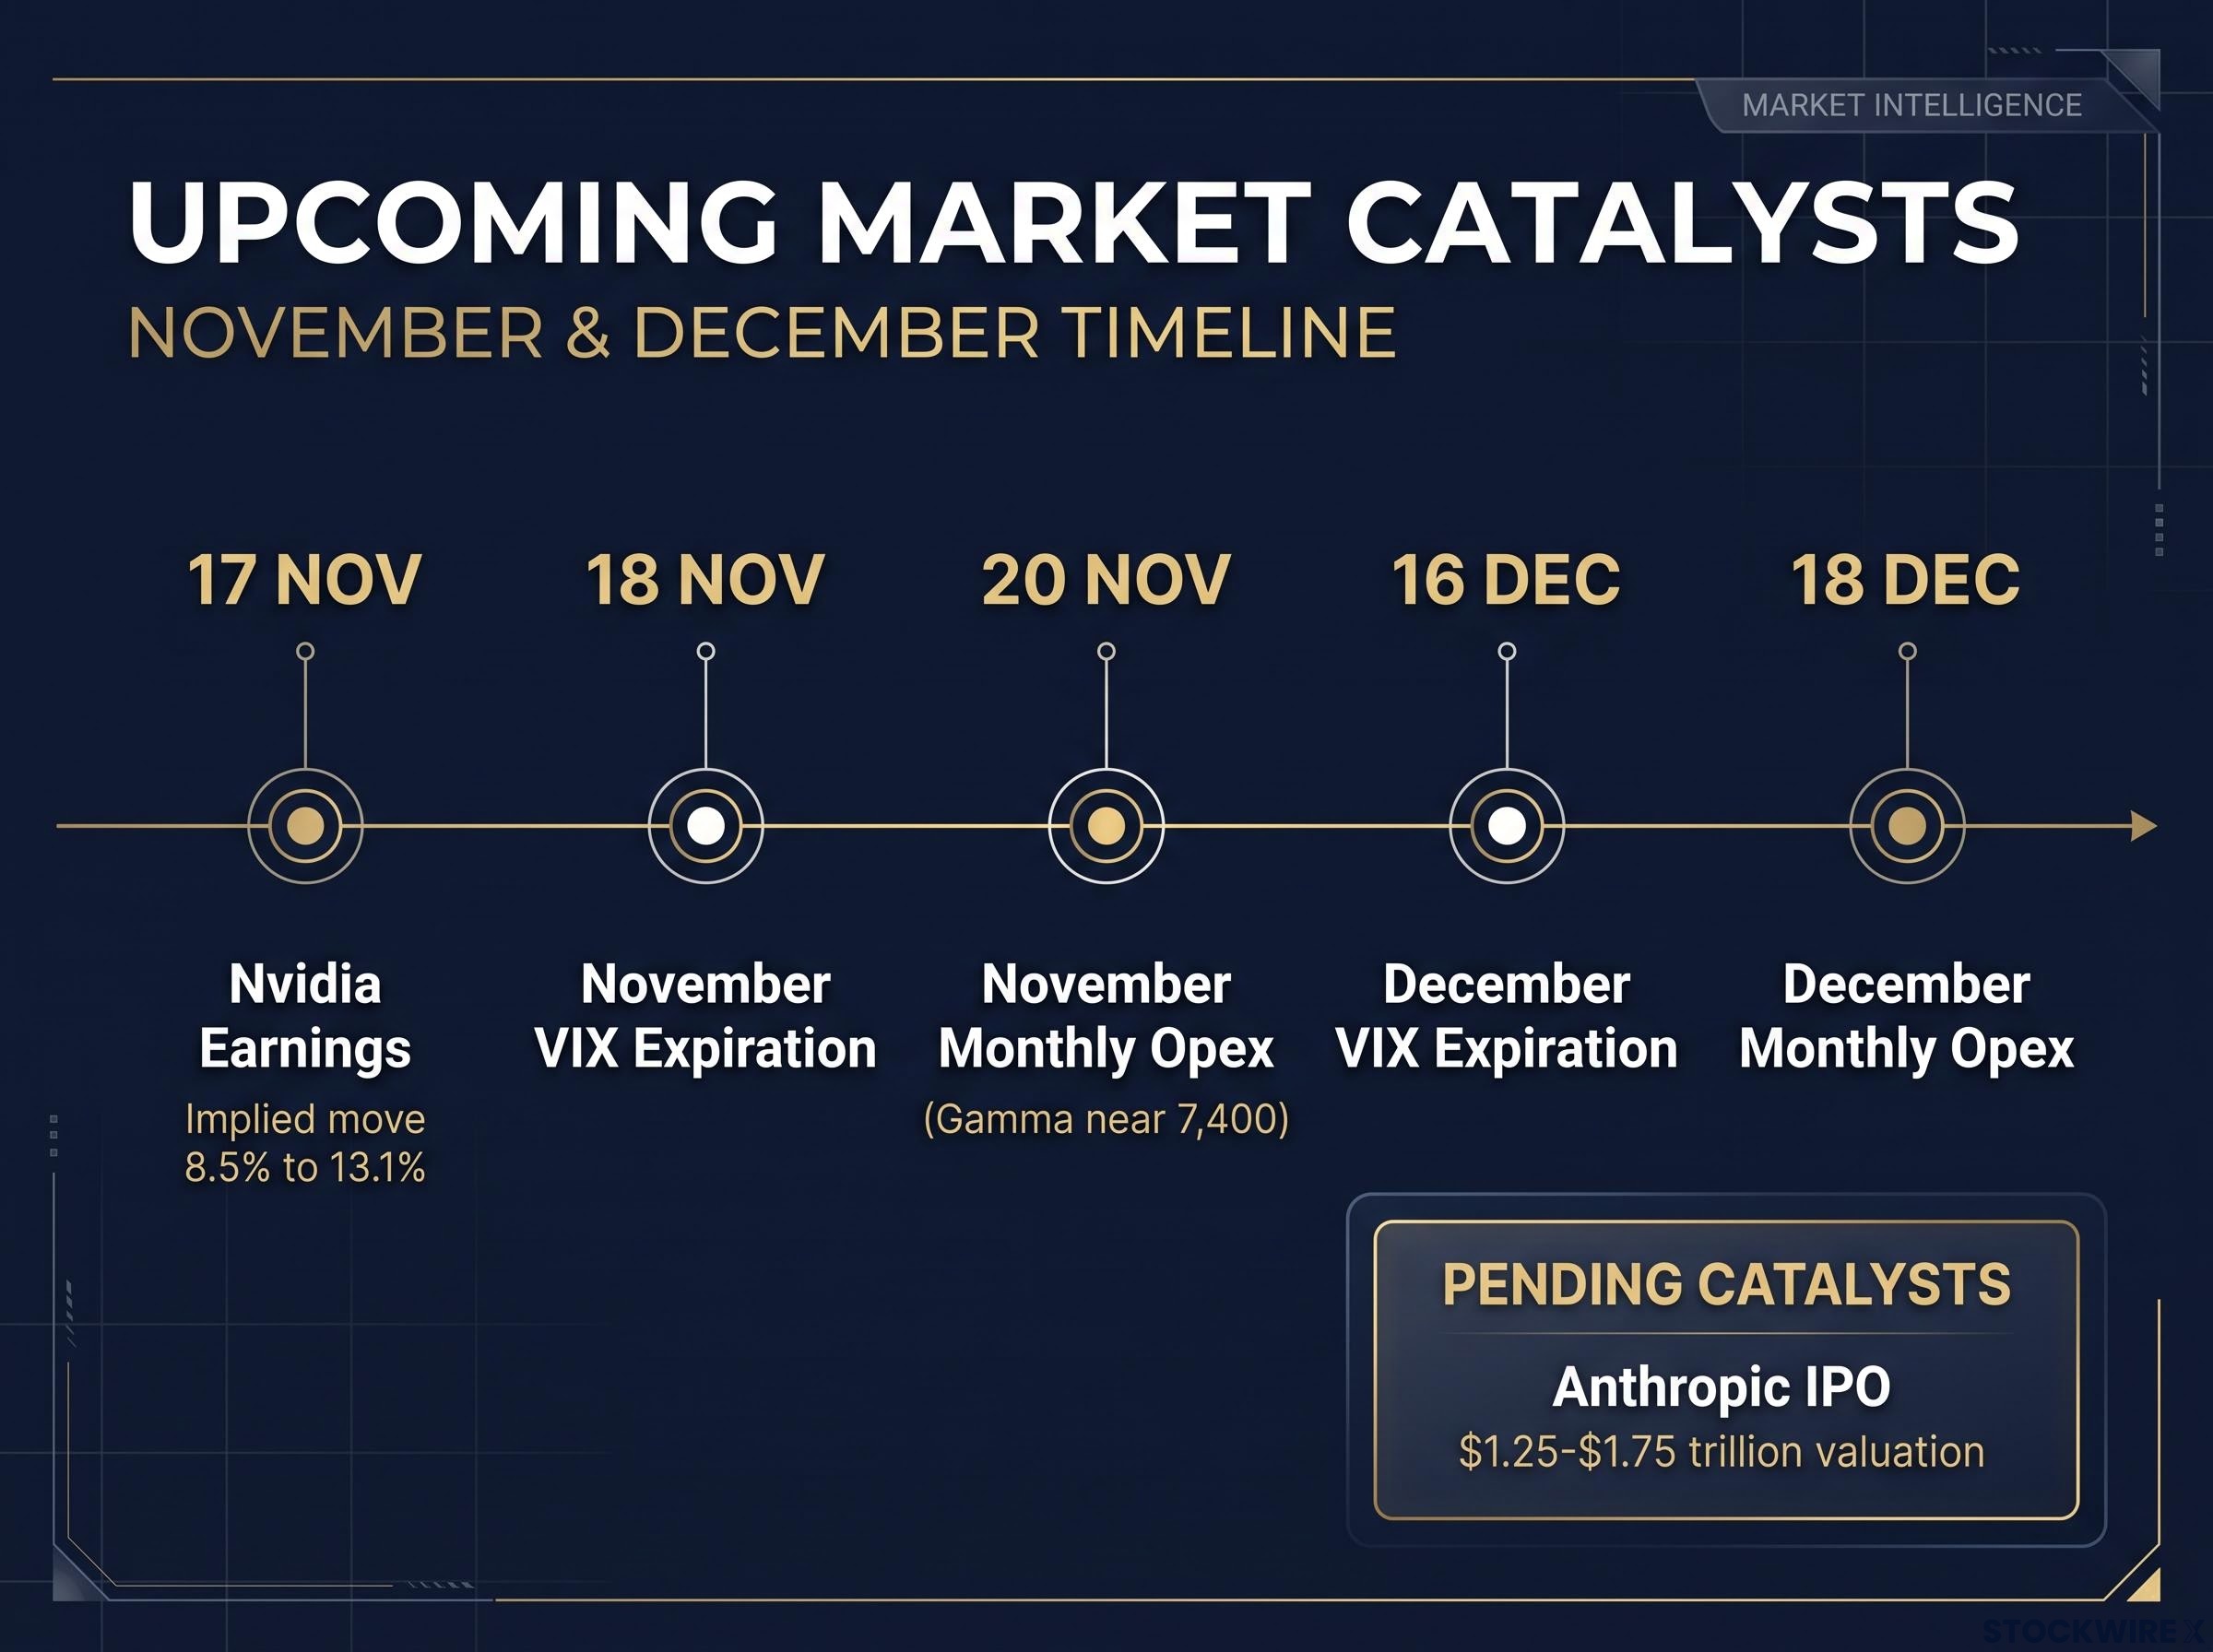
Upcoming market catalysts include 17 Nov Nvidia earnings with an 8.5% to 13.1% implied move, and the Anthropic IPO at $1.25-$1.75 trillion.
Smith on the Nvidia straddle Smith cited a straddle near $18 with implied volatility around 72. He said that price does not account for Huang being removed. He considers that outcome unlikely, but it would erase supportive gamma.
Three secondary risks also sit in the background:
- Anthropic’s IPO: the offering reportedly targets a valuation of about $1.25-$1.75 trillion, and Karsan expects it to draw liquidity away from existing holdings.
- Iran and oil: current reporting points to hopes of de-escalation, and no confirmed new US action has been reported, but Karsan still lists it as a near-term risk.
- Macro fragility: Karsan points to credit default swap stress, drying liquidity in neocloud and AI capex, the risk that long-end rates climb again, and a quieter Treasury Secretary Bessent.
| Catalyst | Date | What to watch | Signal it would break the pattern |
|---|---|---|---|
| Nvidia earnings | 17 November | Size of the move against the implied range | A large miss that spreads beyond tech |
| VIX expiration and opex | 18-20 November | Hedging pressure near 7,400 | A fourth weak Friday |
| Anthropic IPO | Pending | Liquidity drawn from tech holdings | Broad selling to fund the deal |
| Rates and credit | Ongoing | Long-end yields and CDS spreads | Stress spreading past AI borrowers |
The pattern has failed before. SpotGamma described an election-week episode in which the VIX jumped from about 16 to above 28. A relief rally followed, but a later selloff widened the VIX/realised spread and correlation spiked.
Watch for these signals that the compression thesis has failed:
- Correlation climbing toward 60%-70%
- The VIX/realised spread widening again
- Long-end yields rising materially
- A fourth weak Friday
These catalysts make the compression view conditional. You should watch correlation and the VIX/realised spread rather than rely on the calendar alone.
Reading the signal into December: what to track and what it does not promise
Three readings explain last week. Weak implied correlation showed the selloff was dispersion, not contagion. The insurance premium built into the VIX was sold back once the follow-through failed to arrive. Heavy December expiration positioning may support further compression, provided no shock lands first.
Three variables will tell you whether that holds:
- COR1M against its 60-70 drawdown norm
- The VIX against Karsan’s 17-23 range
- The VIX/realised spread against its usual 3-4 points
Check them around 17-20 November and again around 16-18 December. If all three stay calm, the structure described here remains intact. If correlation jumps, you are looking at a different market.
The weeks after a large expiry are often a window of non-strength rather than weakness, since options expiration volatility effects remove the dealer cushion and gamma takes two to three weeks to rebuild.
This piece explains market structure. It is not a forecast.
Past performance does not guarantee future results. Financial projections are subject to market conditions and various risk factors. These statements are speculative and subject to change based on market developments and company performance.
This article is for informational purposes only and should not be considered financial advice. Investors should conduct their own research and consult with financial professionals before making investment decisions.