Finfluencer Rules Won’t Work Until the Penalty Beats the Profit
2 hrs ago


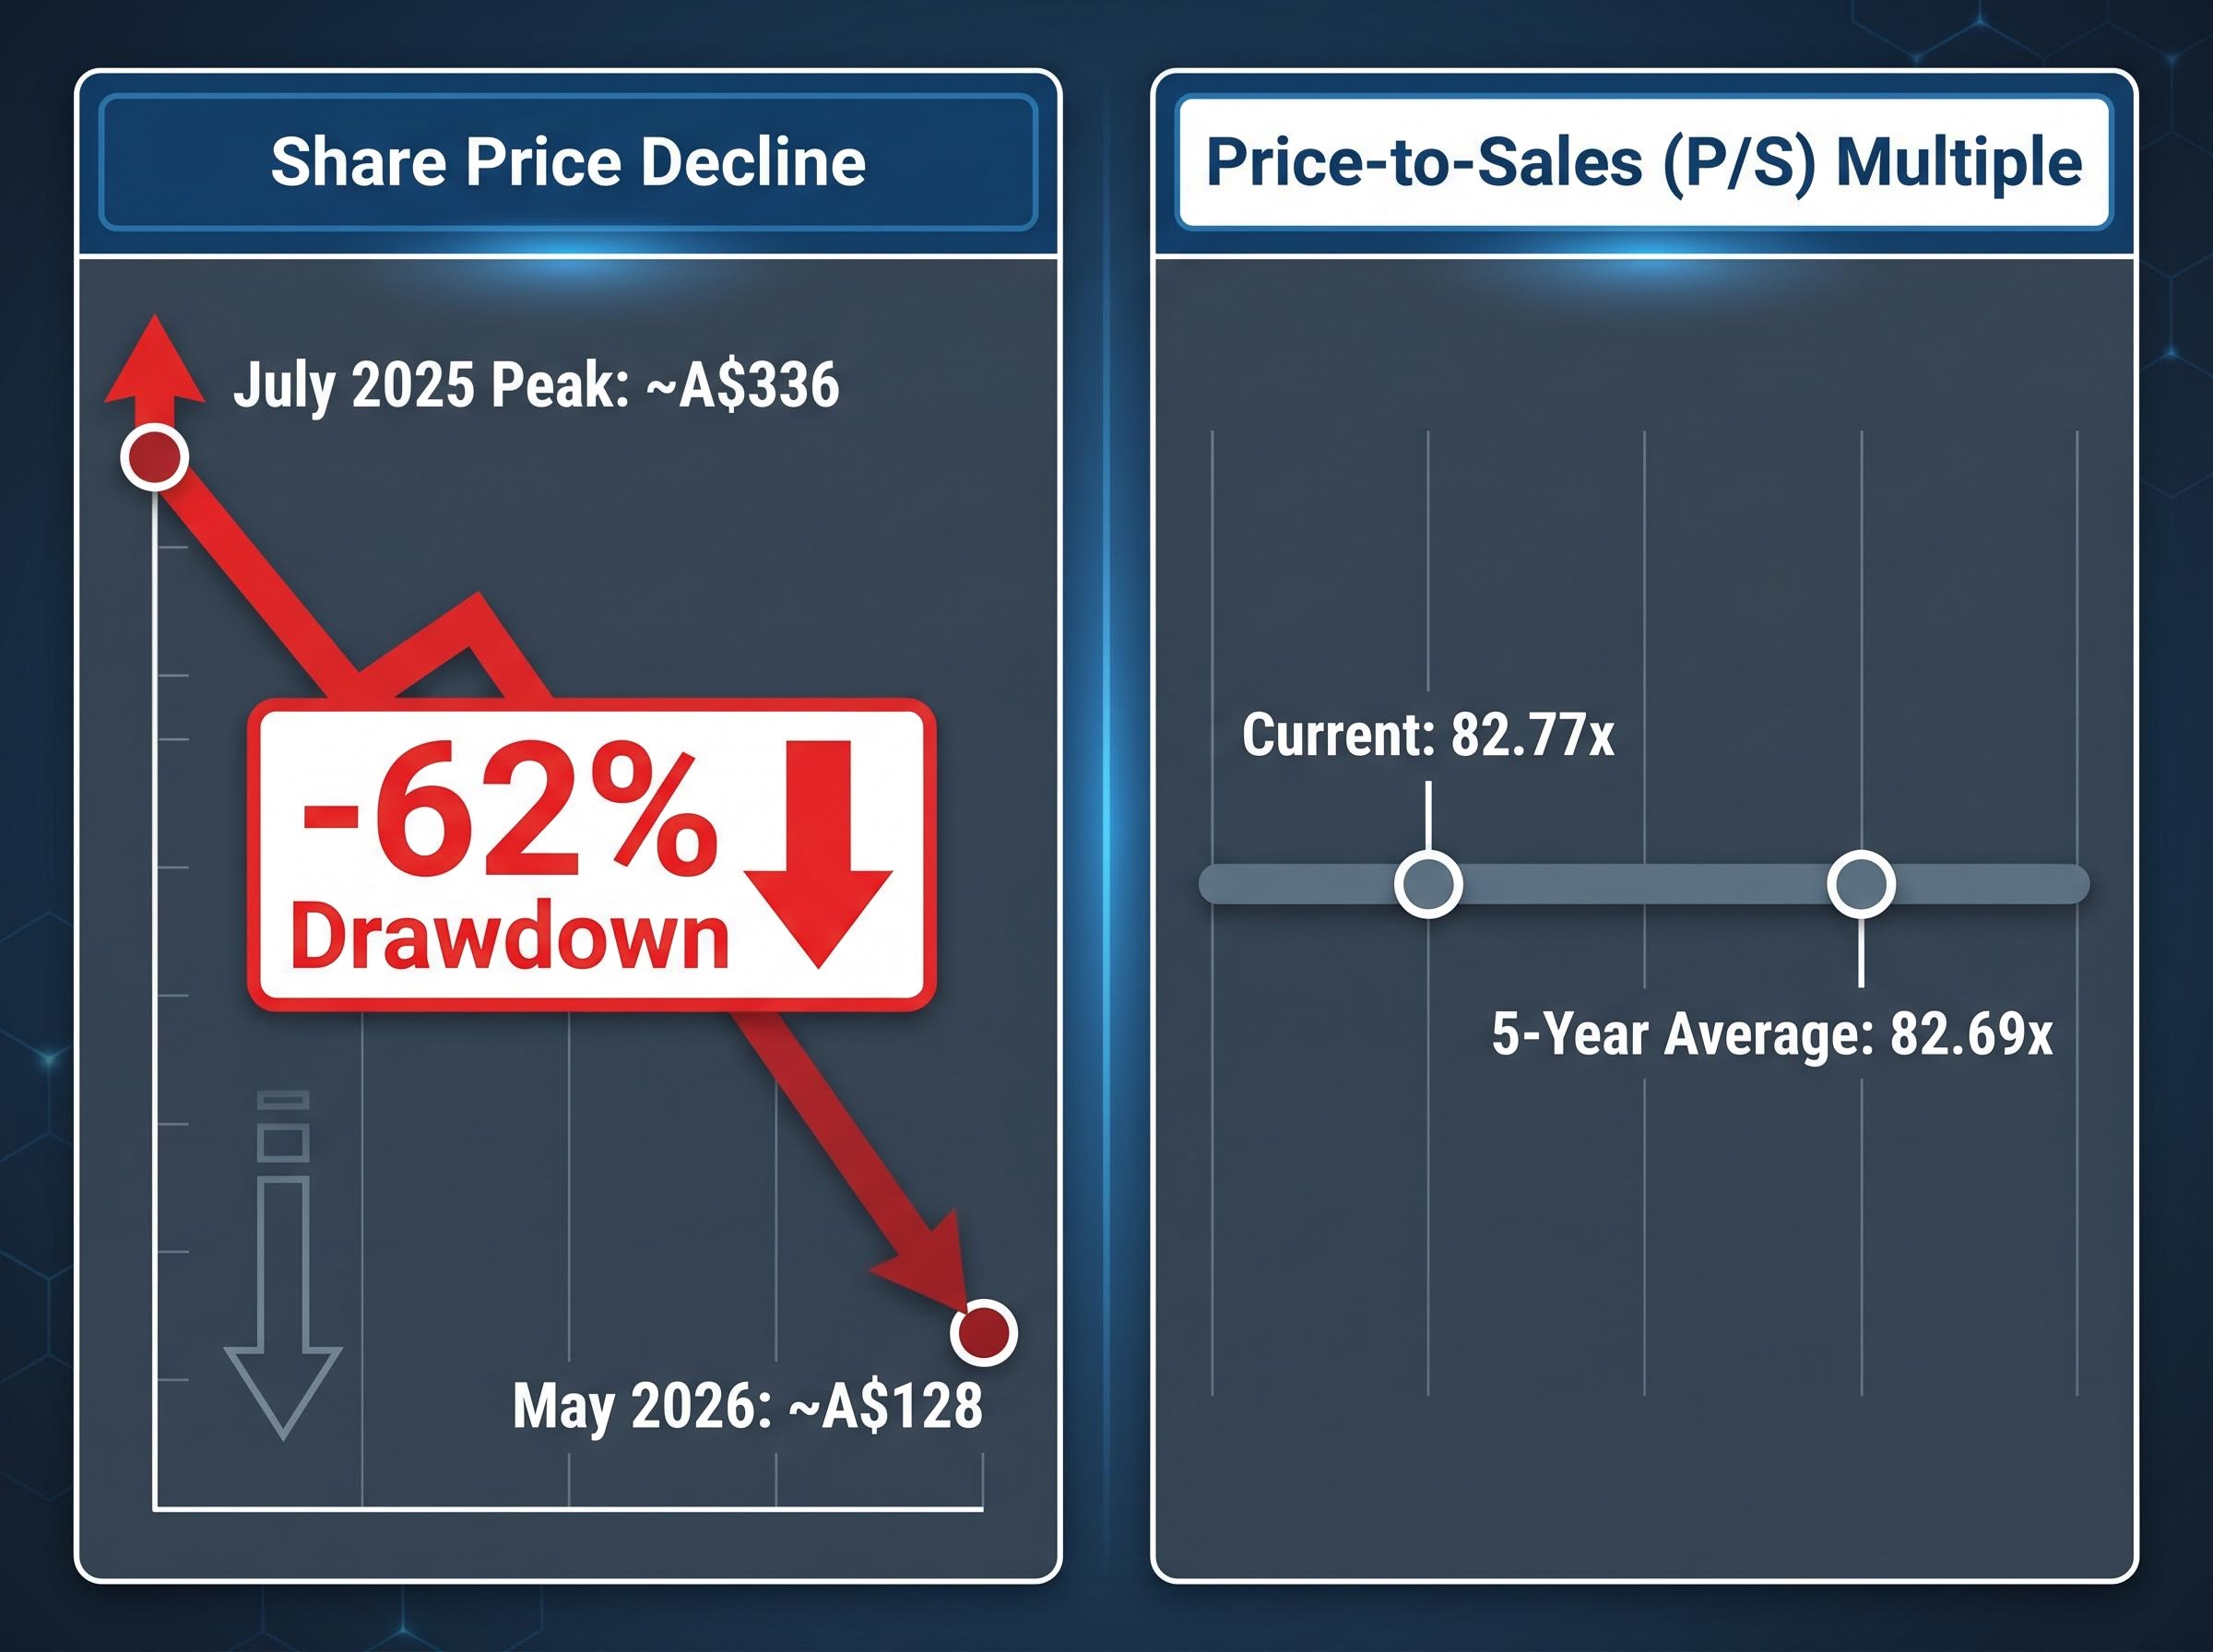
From a July 2025 peak of approximately A$336, Pro Medicus shares have fallen to around A$128 as of late May 2026. That is not a dip. It is a repricing of roughly 62%, and it has reopened the question that follows every high-multiple ASX growth stock through a drawdown: does a lower share price mean better value, or does it simply mean the market has recalibrated what the business is worth?
For PME, the answer is complicated by one striking data point. The company’s price-to-sales ratio of 82.77x sits almost exactly on its five-year historical average of 82.69x. The share price has collapsed, but the valuation multiple has barely moved. This analysis examines what that multiple means for growth investors, how PME’s business model supports (or strains) an 80x-plus sales multiple, and what the current entry point represents relative to the company’s long-term opportunity.
The numbers tell the story in sequence.
Broker commentary from early-to-mid 2025, including notes from Morgan Stanley and Macquarie, referenced a 35-40% drawdown from the start of 2025. Those figures were accurate at the time. They have since been materially superseded by the deeper decline that followed the July recovery.
The PME valuation de-rating that began in early 2026 was driven primarily by AI disruption fears and growth stock multiple compression rather than any deterioration in contract momentum or earnings forecasts, a distinction that matters when assessing whether the subsequent recovery to a July peak and then a further sharp decline represents a single repricing cycle or two separate market events.
52-week trading range: A$107.75 to A$336.00. That spread, more than A$228 between the low and the high, is the sharpest illustration of the volatility embedded in this stock.
At current prices, PME carries a market capitalisation of approximately A$13.4 billion. Investors who entered at or near the July peak are sitting on losses of roughly 62%. Understanding which phase of the decline is being analysed changes how every valuation metric that follows should be interpreted.
Pro Medicus, founded in 1983 and listed on the ASX, develops and sells Visage 7, a cloud-native enterprise imaging platform used by hospitals and radiology facilities. The platform covers radiology information systems (RIS), picture archiving and communication systems (PACS), and advanced visualisation tools. Its primary differentiator is the ability to stream and process large medical imaging files remotely at speed, a capability that has enabled it to win contracts against significantly larger incumbents.
The revenue model is SaaS-adjacent: contracts are multi-year, transactional, and recurring. Revenue is recognised over the life of the contract rather than upfront, giving PME unusually high revenue visibility relative to most ASX technology companies. The primary customer base is US health systems, with significant North American revenue concentration.
Recent contract wins illustrate the scale of that momentum:

PME reported an EBIT margin above 60% as of 1H FY2025. That figure is unusual not just among ASX healthcare stocks but globally among enterprise software companies at this scale. Half-year revenue of A$71.5 million and net profit after tax of A$38.1 million (both figures sourced from Perplexity research and not independently confirmed in this audit) illustrate the cash conversion quality of the model.
At these margins, even moderate revenue growth produces meaningful earnings leverage. That is the financial characteristic that keeps growth investors engaged despite the headline multiple.
A price-to-sales (P/S) ratio measures a company’s market capitalisation relative to its annual revenue. It is commonly used for high-growth companies where earnings may not yet reflect the business’s trajectory, because revenue is harder to manipulate and provides a cleaner read on top-line momentum. Its limitation is that it says nothing about profitability; a company with 60% margins and one with 5% margins can carry the same P/S ratio while representing very different businesses.
ASX tech premium multiples across Pro Medicus, WiseTech Global, TechnologyOne, and Xero have held in the 56-68x trailing earnings range through May 2026, a sustained elevation that reflects embedded expectations of revenue consistency and switching cost depth rather than near-term earnings delivery.
The analytical surprise with PME is this: despite a roughly 62% fall from the July peak, the P/S ratio of 82.77x sits almost exactly on its five-year historical average of 82.69x. The market has not de-rated the stock relative to its own history. It has re-rated it to roughly the same demanding level, because revenue has also grown during the period of the price decline.
| Metric | Current (May 2026) | Five-Year Average | Delta |
|---|---|---|---|
| Price-to-Sales Ratio | 82.77x | 82.69x | +0.08x |
| Approximate Market Capitalisation | A$13.4 billion | ~A$35 billion (at peak) | -62% |
AFR’s Chanticleer column noted on 3 June 2025: “Investors paying more than 80 times sales are still banking on a very long period of uninterrupted high growth.”
At 82x sales, the market is implicitly underwriting many years of high-teens-to-mid-twenties revenue growth with very high confidence. According to broker research attributed to Morgans Financial, “we struggle to justify more than 70x sales on our base-case growth profile; any slowdown in contract momentum would likely trigger further multiple compression.” UBS has reportedly argued that P/S above 80x is only sustainable where revenue growth is “comfortably above 30% with a very long visibility runway and minimal competitive disruption risk.”
The stock is not obviously cheap relative to its own history. Investors considering an entry are not buying a discount on the multiple; they are buying the same multiple at a lower absolute price. Discounted cash flow and dividend discount modelling, rather than P/S alone, are the appropriate tools for determining whether that price is justified.
The US healthcare IT market, PME’s primary source of contract wins, is projected by GlobalData and IMARC to grow at a compound annual growth rate (CAGR) of approximately 14-16% between 2023 and 2030, from a base of approximately US$168.6 billion in 2023. The enterprise imaging niche specifically is forecast to grow at approximately 9-10% CAGR, according to estimates attributed to Frost and Sullivan.
The enterprise imaging IT market forecasts from MarketsandMarkets project a CAGR of 12.2% through 2030, reaching US$4.12 billion, a baseline growth rate that PME must comfortably exceed to sustain a multiple above 80x sales over the same horizon.
PME’s ability to sustain a multiple above 80x sales depends on growing well above the underlying market CAGR. The contract win cadence, A$270 million-plus in new deals signed since February 2025, is the primary evidence that this is occurring.
Competition, however, represents a structural test of that win rate:
PME’s revenue is recognised transactionally rather than upfront, meaning large contract signings translate to revenue over multi-year periods. This is a strength for visibility but creates a dependency: any pause in new contract flow takes time to appear in reported revenue, and by the time it does, the growth deceleration is already structural.
The ASX announcement on 30 April 2025 confirmed PME was tracking ahead of the prior year on revenue and NPAT. More recent data from the FY2025 full-year results (released approximately August 2025) and 1H FY2026 results (released approximately February 2026) carry greater weight for the current analysis and should be sourced directly from ASX filings.
PME’s decline has not occurred in isolation. The S&P/ASX 200 Health Care Index (XHJ) has delivered an annualised return of -11.87% over the five years to May 2026, compared with a 4.20% annualised gain for the broader ASX 200 over the same period.
| Index | Five-Year Annualised Return | Interpretation |
|---|---|---|
| S&P/ASX 200 Health Care (XHJ) | -11.87% | Structural de-rating, particularly affecting high-multiple names |
| S&P/ASX 200 | +4.20% | Broad market delivered positive returns over same period |
The gap between -11.87% and +4.20% is a 16-percentage-point annualised divergence. High-multiple healthcare growth stocks bore a disproportionate share of that underperformance.
The ASX healthcare de-rating has not been uniform: while pathology operators and domestic hospital groups faced genuine earnings pressure, high-multiple software and SaaS-adjacent names suffered a separate and more severe compression driven by long-duration risk repricing under higher interest rates rather than deteriorating fundamentals.
Healthcare IT and SaaS-adjacent businesses within the sector are caught between two competing narratives. On one hand, they carry defensive revenue characteristics: non-discretionary hospital spending, multi-year contracts, recession resilience. On the other, they attract growth-stock valuation sensitivity: long-duration risk, multiple compression under tighter monetary conditions, and elevated vulnerability to any deceleration in top-line growth.
According to a Morgan Stanley survey, more than half of surveyed investors planned to increase sustainable investment allocations during 2024, a structural tailwind for healthcare sector demand broadly. Whether that translates into re-rating support for individual names trading at 82x sales is a separate question entirely.
The tension at the centre of the PME story is not about business quality. EBIT margins above 60%, recurring SaaS-transactional revenue, and consistent contract wins against large incumbents are not in dispute. The debate is whether a P/S ratio of 82.77x, sitting on its five-year average, represents fair value or ongoing overvaluation given the depth of the price decline.
The bull case points to the contract win cadence: more than A$270 million in new contracts signed since February 2025 provides multi-year revenue visibility. According to research attributed to Bell Potter, the sell-off “largely reflects sentiment toward long-duration tech rather than any deterioration in fundamentals,” and the broker maintained a Buy rating.
PME earnings and margin data from the FY2025 full-year results, including revenue of A$213 million growing 31.9% and NPAT of A$115.2 million at a 54% net profit margin, provide the most current financial foundation for assessing whether the contract momentum cited by bulls is translating into reported results at the pace the multiple requires.
The bear case, articulated by Morgans and UBS (both unverified), centres on the observation that 82x sales prices in many years of high-growth execution with near-zero margin for error. Any contract slowdown or growth normalisation could trigger further multiple compression with limited floor.
Wilsons Advisory reportedly noted: “We prefer entry points closer to 60x sales on our forward estimates.”
For growth investors weighing the current price, the relevant questions form a sequential framework:
Discounted cash flow and dividend discount modelling, rather than P/S ratio analysis alone, are the appropriate tools for working through those questions with precision.
This article is for informational purposes only and should not be considered financial advice. Investors should conduct their own research and consult with financial professionals before making investment decisions. Past performance does not guarantee future results. Financial projections are subject to market conditions and various risk factors.
The share price has fallen dramatically, but so has the market’s implied revenue base, meaning the multiple has reset to PME’s own historical average rather than to a clear discount. Three takeaways stand out:
Pro Medicus remains one of the ASX’s highest-quality businesses by operational metrics. Quality and value, however, are not the same thing at 82x sales.
A price-to-sales ratio measures a company's market capitalisation relative to its annual revenue, and for Pro Medicus it currently sits at 82.77x, meaning investors are paying over 80 dollars for every dollar of annual revenue the company generates. It is commonly used for high-growth companies where earnings alone do not fully capture the business trajectory.
Pro Medicus shares fell roughly 62% from an all-time high of approximately A$336 in July 2025 to around A$128 by late May 2026, driven primarily by AI disruption fears and broad compression of high-multiple growth stock valuations rather than any deterioration in contract momentum or earnings forecasts.
Despite the 62% price decline, the P/S ratio of 82.77x sits almost exactly on its five-year historical average of 82.69x, meaning the entry point is not cheaper in relative terms because revenue has also grown during the period of the price fall.
Since February 2025, Pro Medicus has signed more than A$270 million in new contracts, including a A$140 million seven-year deal with a US academic health system, a A$40 million eight-year deal with a US regional health system, and a A$90 million contract with Beth Israel Lahey Health.
At over 80x sales, broker commentary attributed to UBS suggests a P/S ratio above 80x is only sustainable where revenue growth is comfortably above 30% with a long visibility runway and minimal competitive disruption risk, a threshold Pro Medicus must consistently meet to justify the multiple.