A VIX sitting quietly between 14 and 16 looks like a market that has stopped worrying. But roughly $7 trillion in options notional is set to expire today, Friday 16 October 2026, and some of that calm may be mechanical rather than a sign of confidence.
Around a large expiration, the hedging done by options dealers can absorb declines and invite bounces regardless of the economic story. This is a standard third-Friday monthly expiration, not a quarterly triple witching date. The scale still matters.
The risk for you is reading a temporary, flow-driven bid as fundamental strength.
You will come away with a working model of three things. First, why dips tend to get bought into expiry. Second, why the days after are better described as a window of non-strength than of weakness. Third, which volatility gauge deserves your trust when options expiration volatility distorts the usual signals.
How does dealer hedging turn expiration into a volatility seller?
Start with who sells protection when you buy it. Usually that is a dealer, meaning a bank or market maker that takes the other side of options trades and hedges the risk rather than betting on direction.
The insurer analogy
Hedging, structured-product and ETF-related positions push implied volatility slightly higher in the expiration month. Implied volatility is the level of future price movement baked into an option’s price. Dealers sell that richly priced protection, leaving them short the expiring month and long the months around it.
Because implied volatility is backed out of live option prices rather than historical data, you can read it on any options chain as the market’s real-time estimate of how far a price might move, though it says nothing about direction.
The insurer view Jim Carson of Kai Volatility describes dealers as acting like insurers: they collect premium on protection and hedge it elsewhere.
The scale of that selling has grown fast. US covered-call ETFs held about $75.2 billion as of May 2025, and buffered ETFs about $43.4 billion, up from $4.6 billion in August 2020 (ETF Database via Investopedia). Each of these products feeds more volatility supply into the system.
Why falling vol forces delta buying
Follow the chain of cause and effect:
- You and other investors buy downside puts, and dealers sell them, hedging by selling futures or stock.
- If the dealer book is long gamma, a falling market forces dealers to buy, creating a stabilising bid.
- Implied volatility drifts lower as protection premium decays into expiry.
- As premium decays, dealers become long vega, meaning they gain from volatility and want to sell more of it.
- With steep skew, falling volatility forces dealers to buy back short delta, mostly in the morning and near the close.
Long gamma means dealers sell strength and buy weakness. That makes declines hard to sustain, and Carson points to the COVID-era stretch from December and January into February as an example of sell-offs reverting.
Today’s expiry is large. Citadel Securities called it the second-largest on record, estimating about 60% of positions resolve at the open; that is Citadel’s estimate, not an OCC table. When a sell-off runs into an expiration this heavy, part of the buying you see is mechanical hedge reduction, not investors changing their minds. Discount it accordingly.
When big ASX news breaks, our subscribers know first
Veta, vomma, vanna and charm: the Greeks behind the bid
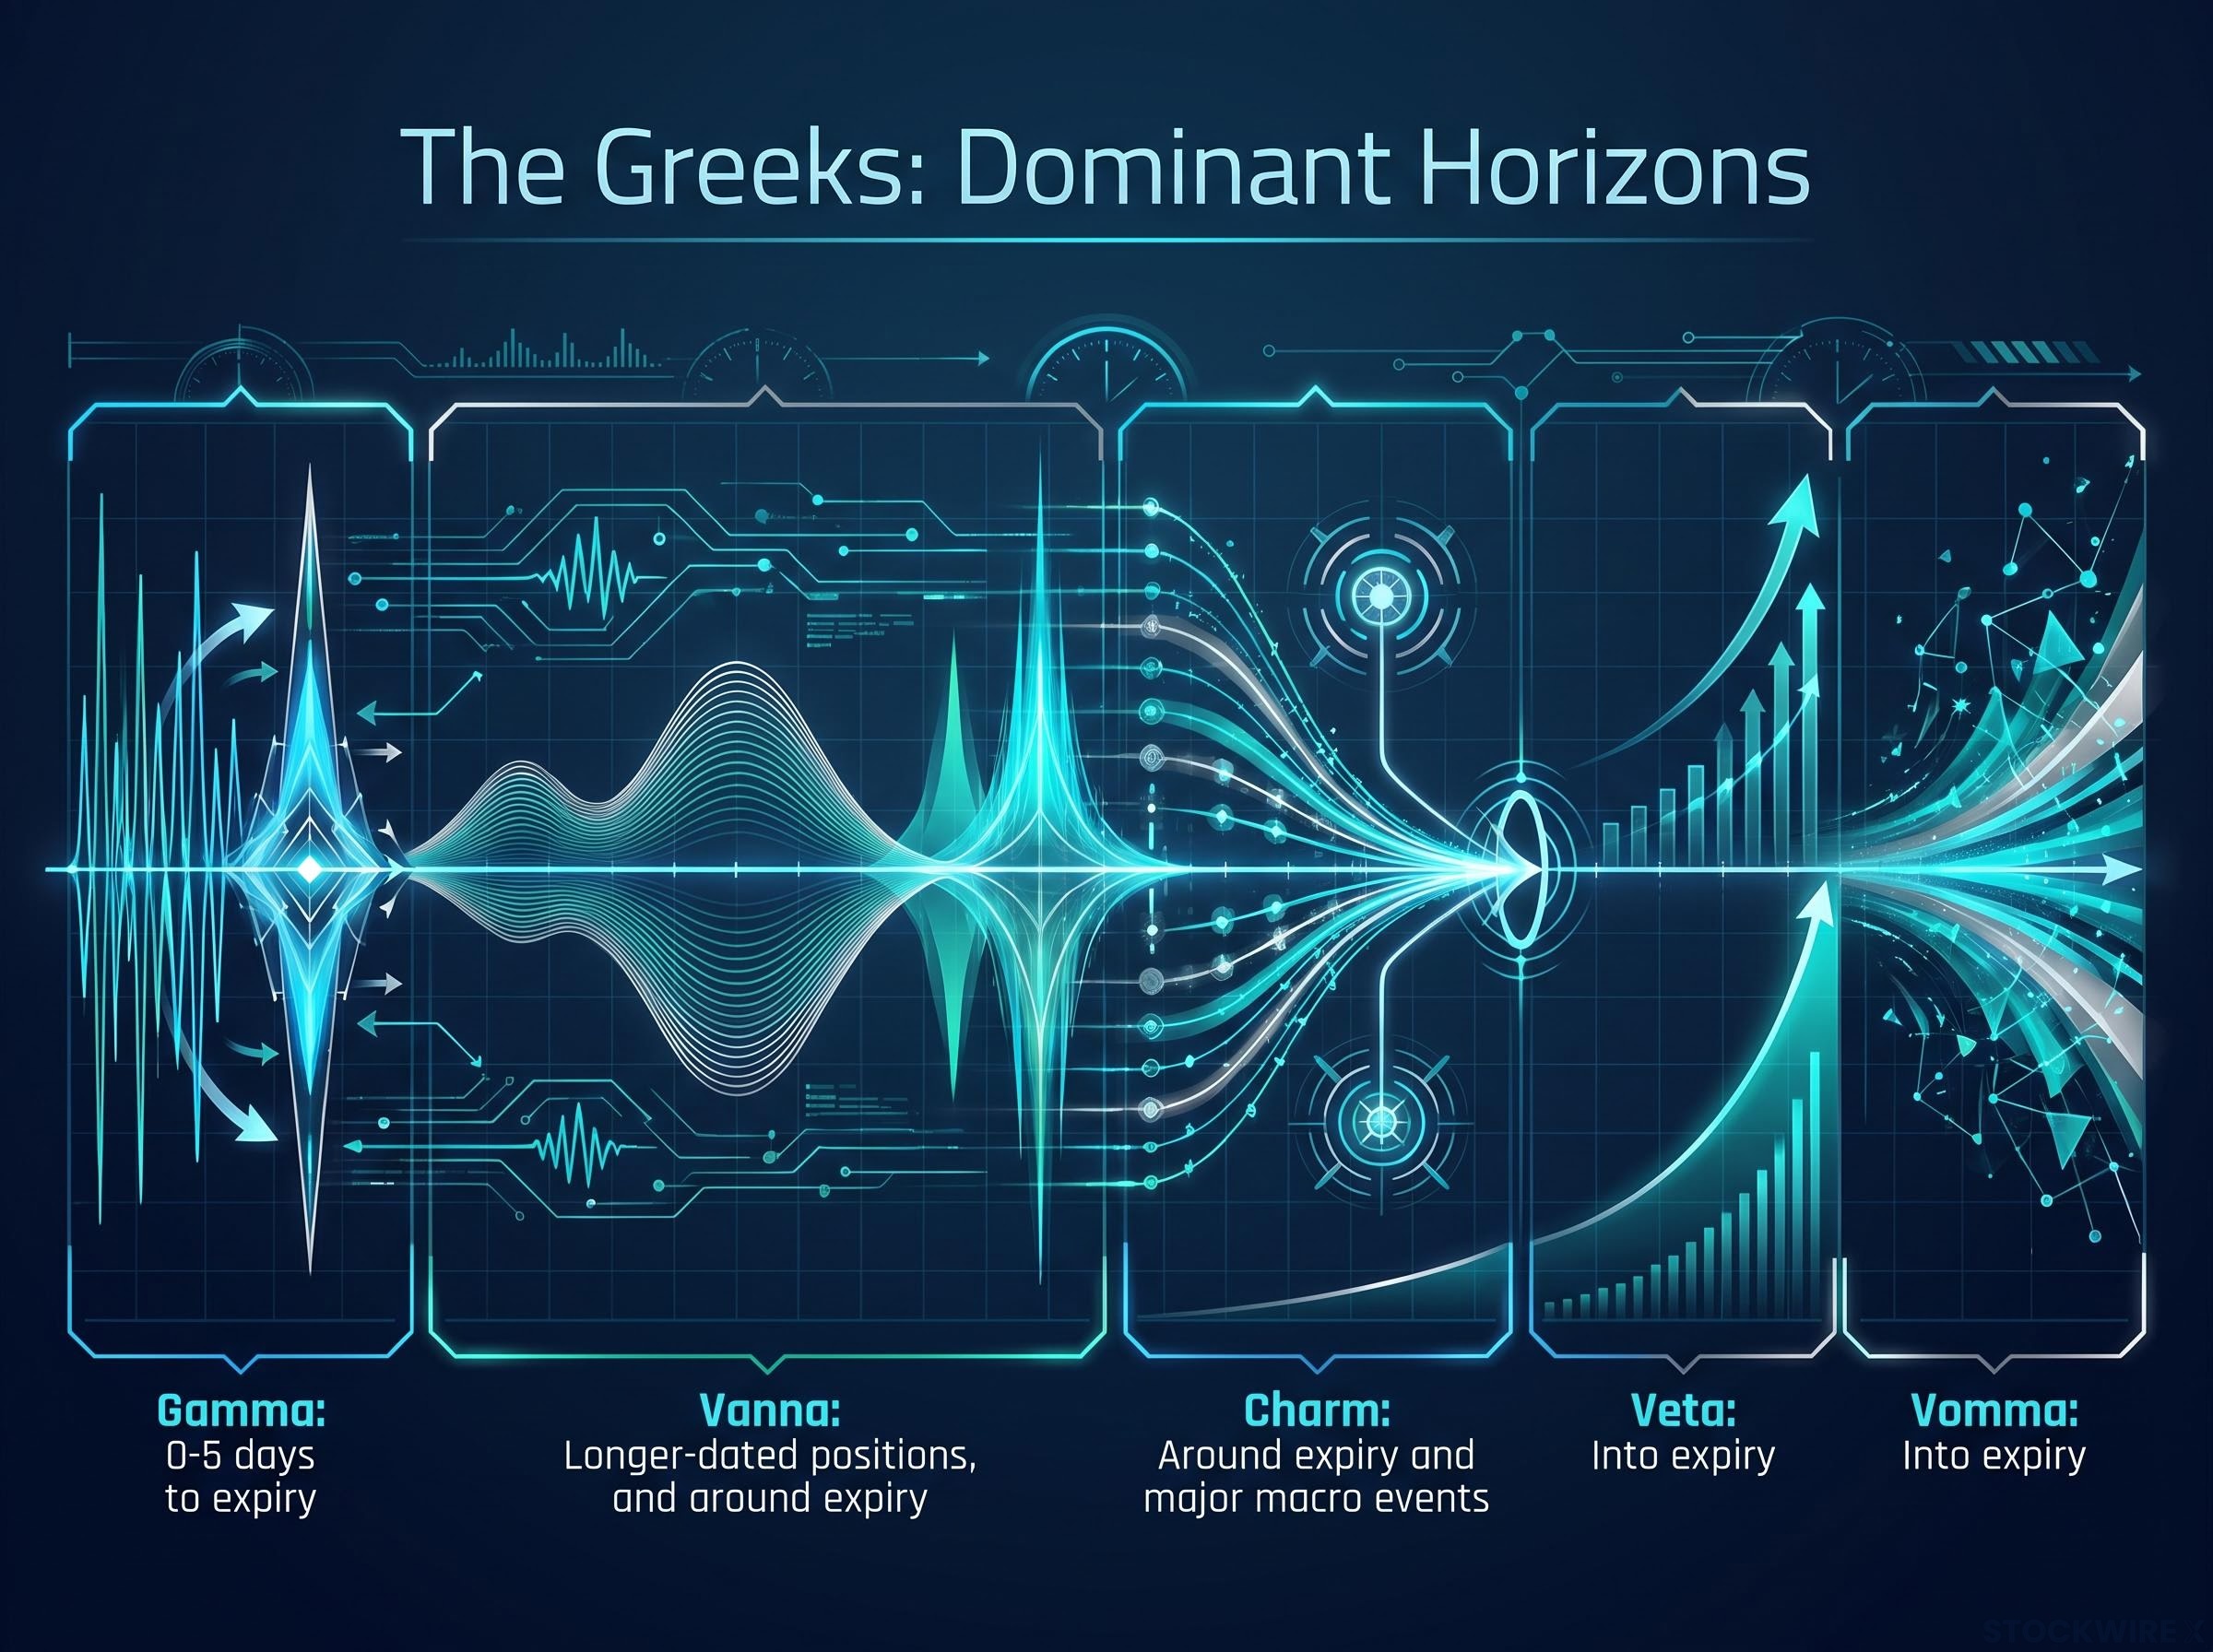
The plain-language version is simple: as days pass and volatility softens, dealers keep getting longer vega and keep selling it. The Greeks are the measurements that describe how that happens. Each one is a sensitivity, telling you how one part of an option’s risk changes when something else moves.
| Greek | What it measures | Dealer effect near expiry | Dominant horizon |
|---|---|---|---|
| Gamma | How fast delta changes as the price moves | Long gamma makes dealers buy dips and sell rallies | 0-5 days to expiry |
| Vanna | How delta changes as implied volatility moves | Falling volatility lets dealers buy back put hedges | Longer-dated positions, and around expiry |
| Charm | How delta changes as time passes | Decaying out-of-the-money options prompt futures buybacks | Around expiry and major macro events |
| Veta | How vega changes as time passes | Vega shrinks daily, adding to dealer vol selling | Into expiry |
| Vomma | How vega changes as implied volatility moves | Falling volatility shifts vega, prompting more selling | Into expiry |
Veta and vomma are the two drivers of the extra volatility selling. The horizon split comes from SpotGamma’s framework, and it is the practical part. Gamma-driven support tends to fade by the close, vanna works over days, and charm-related flows only disappear once expiry removes the positions.
Short-dated trading makes gamma louder. Cboe reported zero-days-to-expiry (0DTE) options above 20 million contracts a day in Q2 2026, up 46.2% year to date, and about 65% of SPX volume in May 2026. These figures are reported but not independently confirmed.
Flow-driven pinning shows up clearly in same-day contracts: on 12 December 2025 the S&P 500 closed one point above the heaviest zero-DTE strike at 6,900, a case of hedging flows overriding price discovery.
What the evidence supports
SqueezeMetrics describes volatility rising exponentially as aggregate dealer gamma falls below zero. Cboe-sponsored research finds gamma’s typical effect is to reduce volatility, consistent with mostly positive gamma in index options.
Treat both with care. Gamma estimates depend on models and assumptions about who owns what. Knowing which Greek is doing the work tells you whether the support is likely to fade by the close, by the weekend, or only after expiry.
Why the VIX can misread protection demand
Here is the puzzle this month. The VIX was about 14.8 on 12 October after spending most of October between 14 and 16. Yet Saxo Bank recorded skew at 149.19 alongside a VIX of 15.41, and Traders Magazine reported skew about 0.5 points firmer than the headline VIX.
The fear gauge is falling while the price of crash protection holds firm. Both readings cannot mean the same thing.
Part of the quiet in the headline gauge may reflect large short-volatility exposure from systematic strategies and structured products, which suppresses the VIX without reducing the underlying economic risk.
The reason is how the VIX is built. It is a model-free estimate of expected 30-day S&P 500 variance, calculated from a strip of out-of-the-money puts and calls. Because lower strikes carry higher implied volatility (that slope is skew), the VIX moves mechanically with the market: it tends to fall when stocks rise and climb when they drop, even if nobody’s demand for a specific hedge has changed.
Carson simplifies the VIX as “at-the-money floating volatility.” The technical picture is more complex, but his conclusion holds. Fixed-strike implied volatility, the volatility priced into one specific strike, tracks what traders actually pay for that protection, so it reflects real supply and demand. Cboe research supports the split, separating VIX changes into a sticky-strike component and a skew-gradient component.
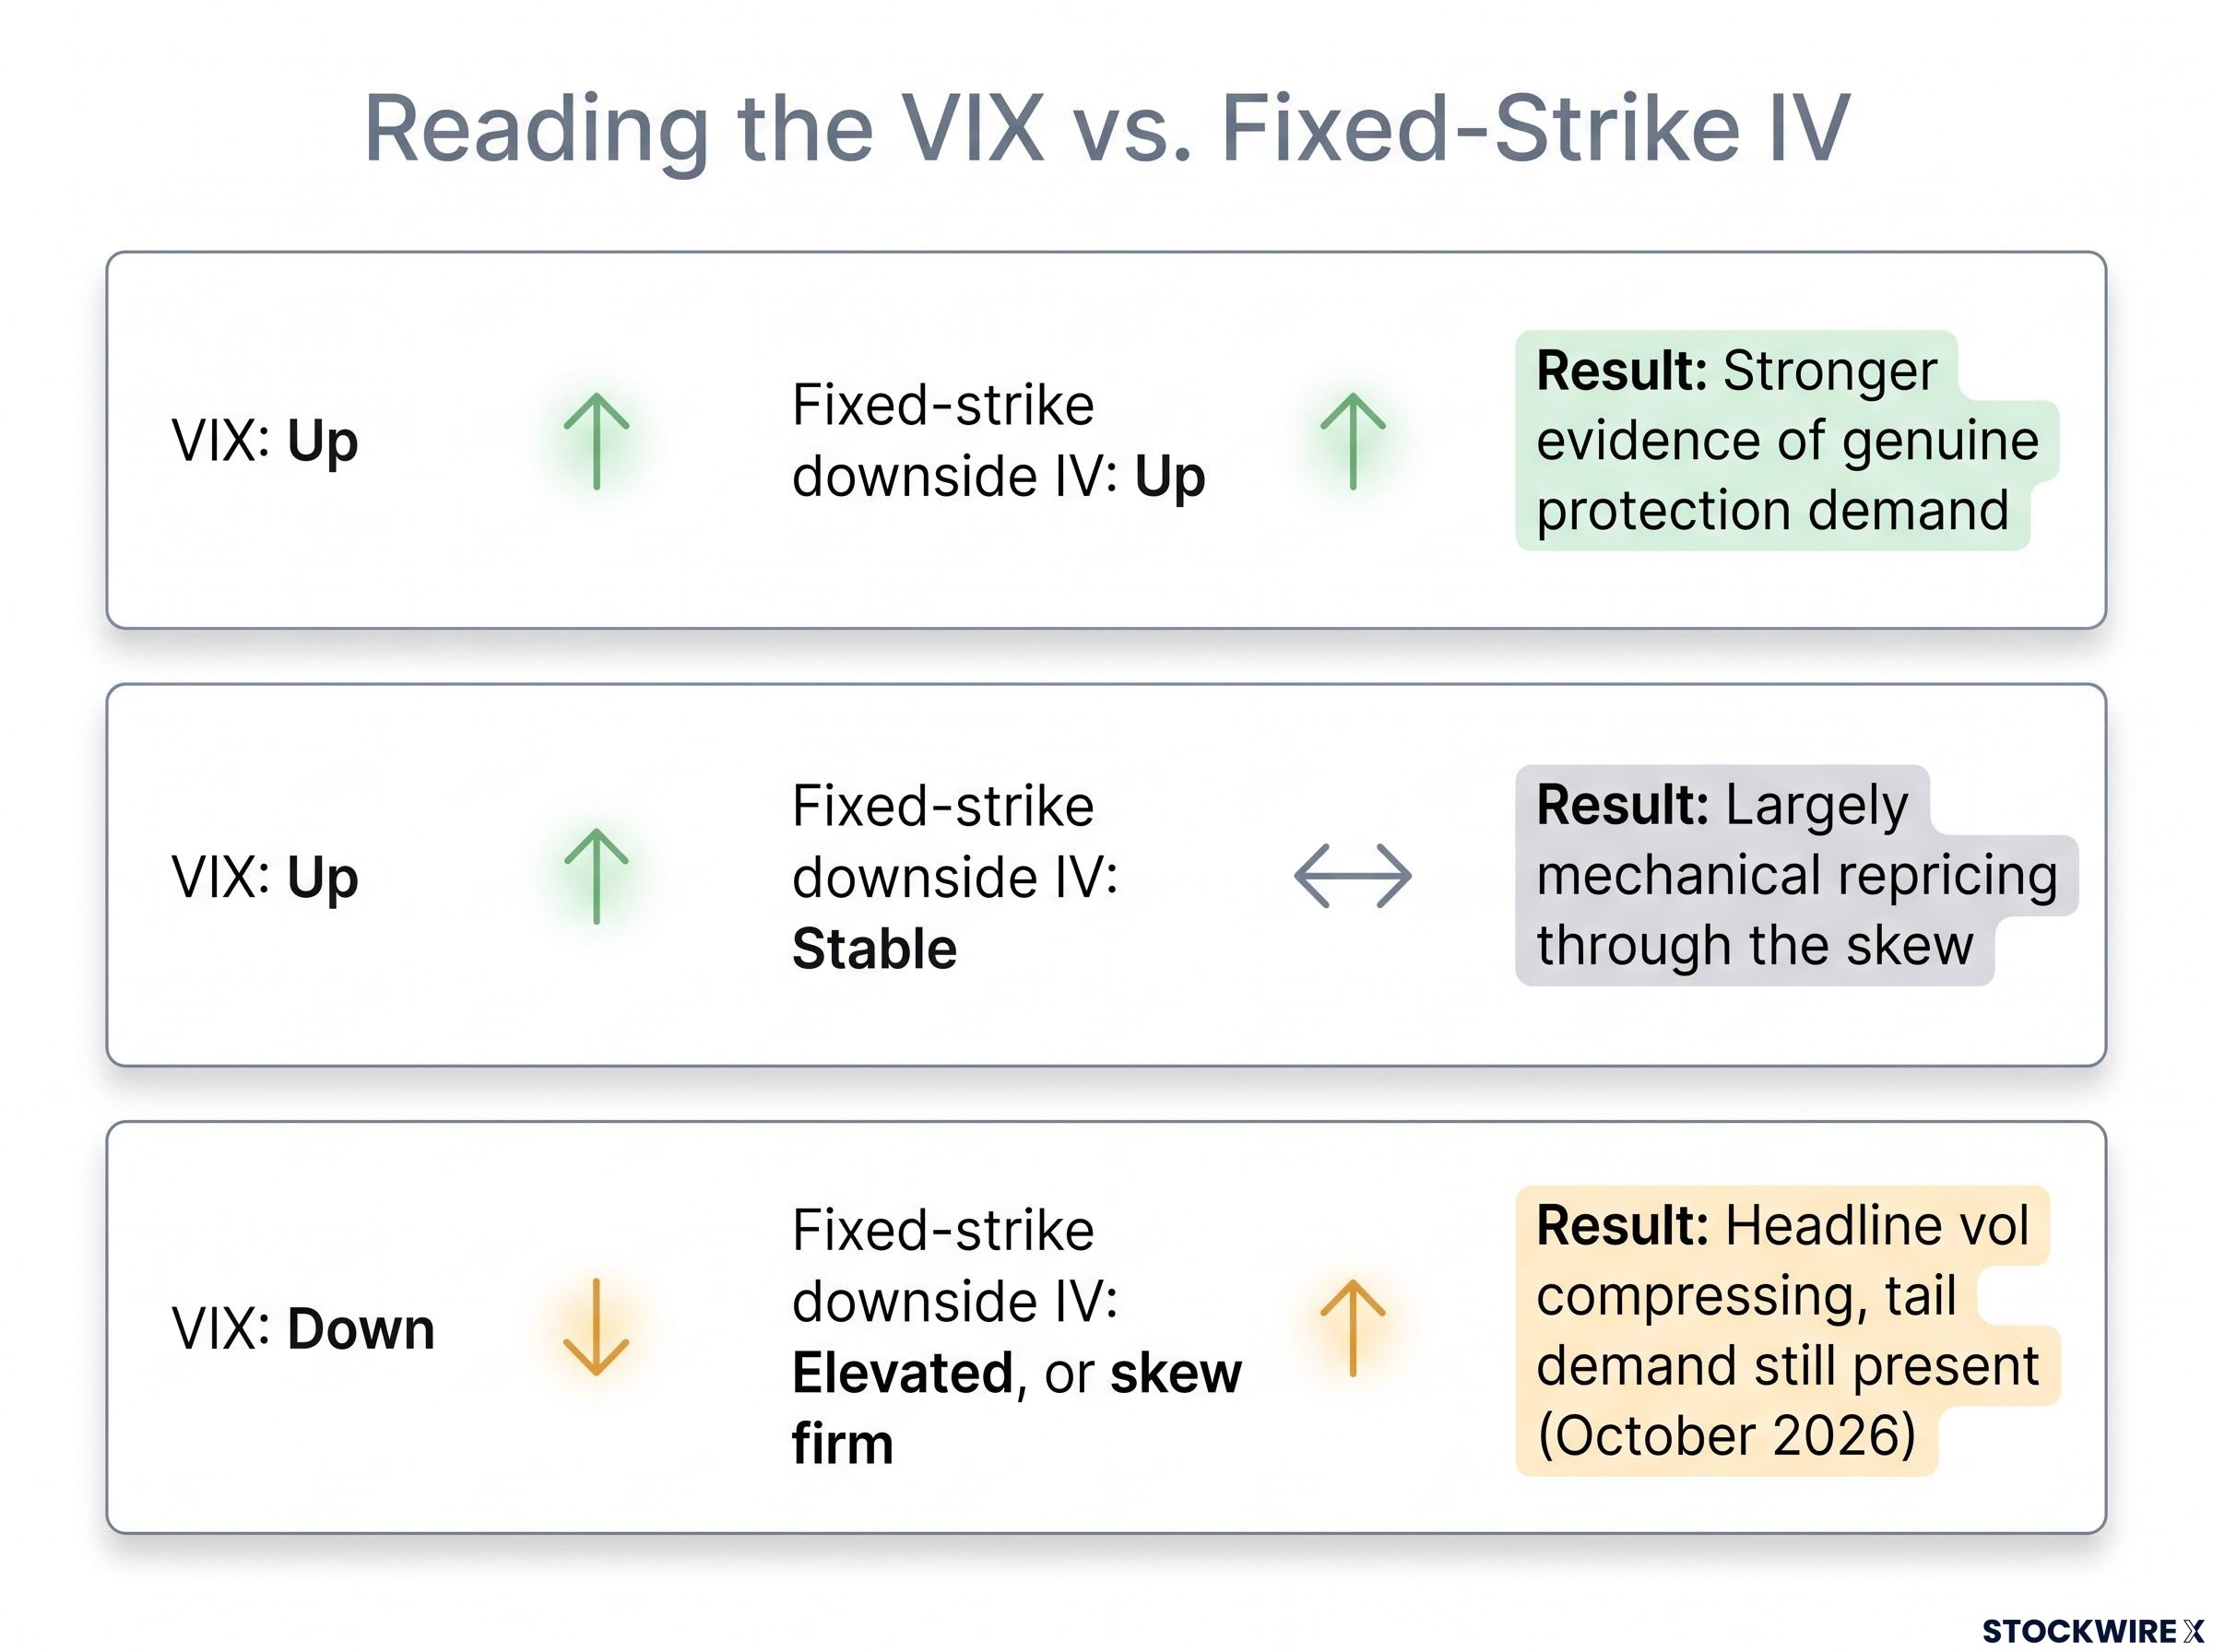
On one expiration-week day Carson discussed, the VIX fell about 2.39% while fixed-strike volatility fell roughly half that. Use this table to read the two gauges together:
| VIX move | Fixed-strike downside IV | Likely reading |
|---|---|---|
| Up | Up | Stronger evidence of genuine protection demand |
| Up | Stable | Largely mechanical repricing through the skew |
| Down | Elevated, or skew firm | Headline vol compressing, tail demand still present (October 2026) |
Carson’s read on current conditions Volatility is compressed, though less than the VIX suggests.
A falling VIX does not prove protection demand has gone. Check fixed-strike downside volatility before you conclude that fear has faded.
After expiry: a window of non-strength, and the limits of the effect
So what happens once the support expires?
The reset after expiry
Carson prefers “window of non-strength” to “weakness,” and the distinction matters. The mechanical buyback fades, but no new bearish force arrives in its place. The market simply loses its cushion.
With a large block of gamma removed, prices become more sensitive to fresh flows. Practitioner analysis suggests gamma takes roughly two to three weeks to rebuild. Treat those days as a period without the usual support, not a sell signal.
When the mechanism fails
The support only holds under the right conditions. It breaks down under:
- Short dealer gamma below the flip level, where dealers sell into declines and amplify moves
- Macro shocks from rates, jobs data, central banks or geopolitics
- Barrier-driven hedging in structured notes and buffered ETFs, which can intensify a breach
- Misread positioning, since open interest counts contracts and does not show which side dealers hold
Gamma exposure (GEX) estimates also differ by vendor. Covered-call products are no shield either: ProShares research via Investopedia found they historically captured about 84% of losses versus 65% of gains.
| Episode | Gamma/flow condition | What it shows |
|---|---|---|
| 5 August 2024 | Macro shock and thin pre-market liquidity; VIX briefly above 65 | Macro and market structure overwhelmed expiry support |
| 4-9 April 2025 | Estimated gamma from about +$2.1B to -$390M as the S&P 500 fell about 6% | Gamma is dynamic, not a fixed cushion |
| 16 October 2026 | About $7T expiring, low VIX, firm skew | Compression into expiry, possible reset after |
The 2024 and 2025 figures are reported estimates. They show why you should size your expectations to conditions rather than the calendar.
For investors weighing premium-selling products, our full explainer on selling options tail risk covers how negative gamma and forced margin closes turned the August 2024 spike into permanent losses.
Reading the next expiry: what holds and what does not
Three ideas should travel with you. Expiry flows depend on the sign of dealer gamma, so the support exists only when dealers are long it. The days after expiry are a window of non-strength, when the cushion is gone but no bearish force has been added. And fixed-strike volatility gives you a cleaner read on protection demand than the headline VIX.
Before the next monthly cycle, run three checks. Is dealer gamma positive or negative? Is fixed-strike downside volatility moving with the VIX or holding firm against it? Is a macro catalyst on the calendar that could override the flows?
Structural flows can dominate for days, but only temporarily. Macro realities reassert themselves, and your positioning should allow for that.
This article is for informational purposes only and should not be considered financial advice. Investors should conduct their own research and consult with financial professionals before making investment decisions. Past performance does not guarantee future results, and positioning estimates cited here are model-dependent and subject to change.