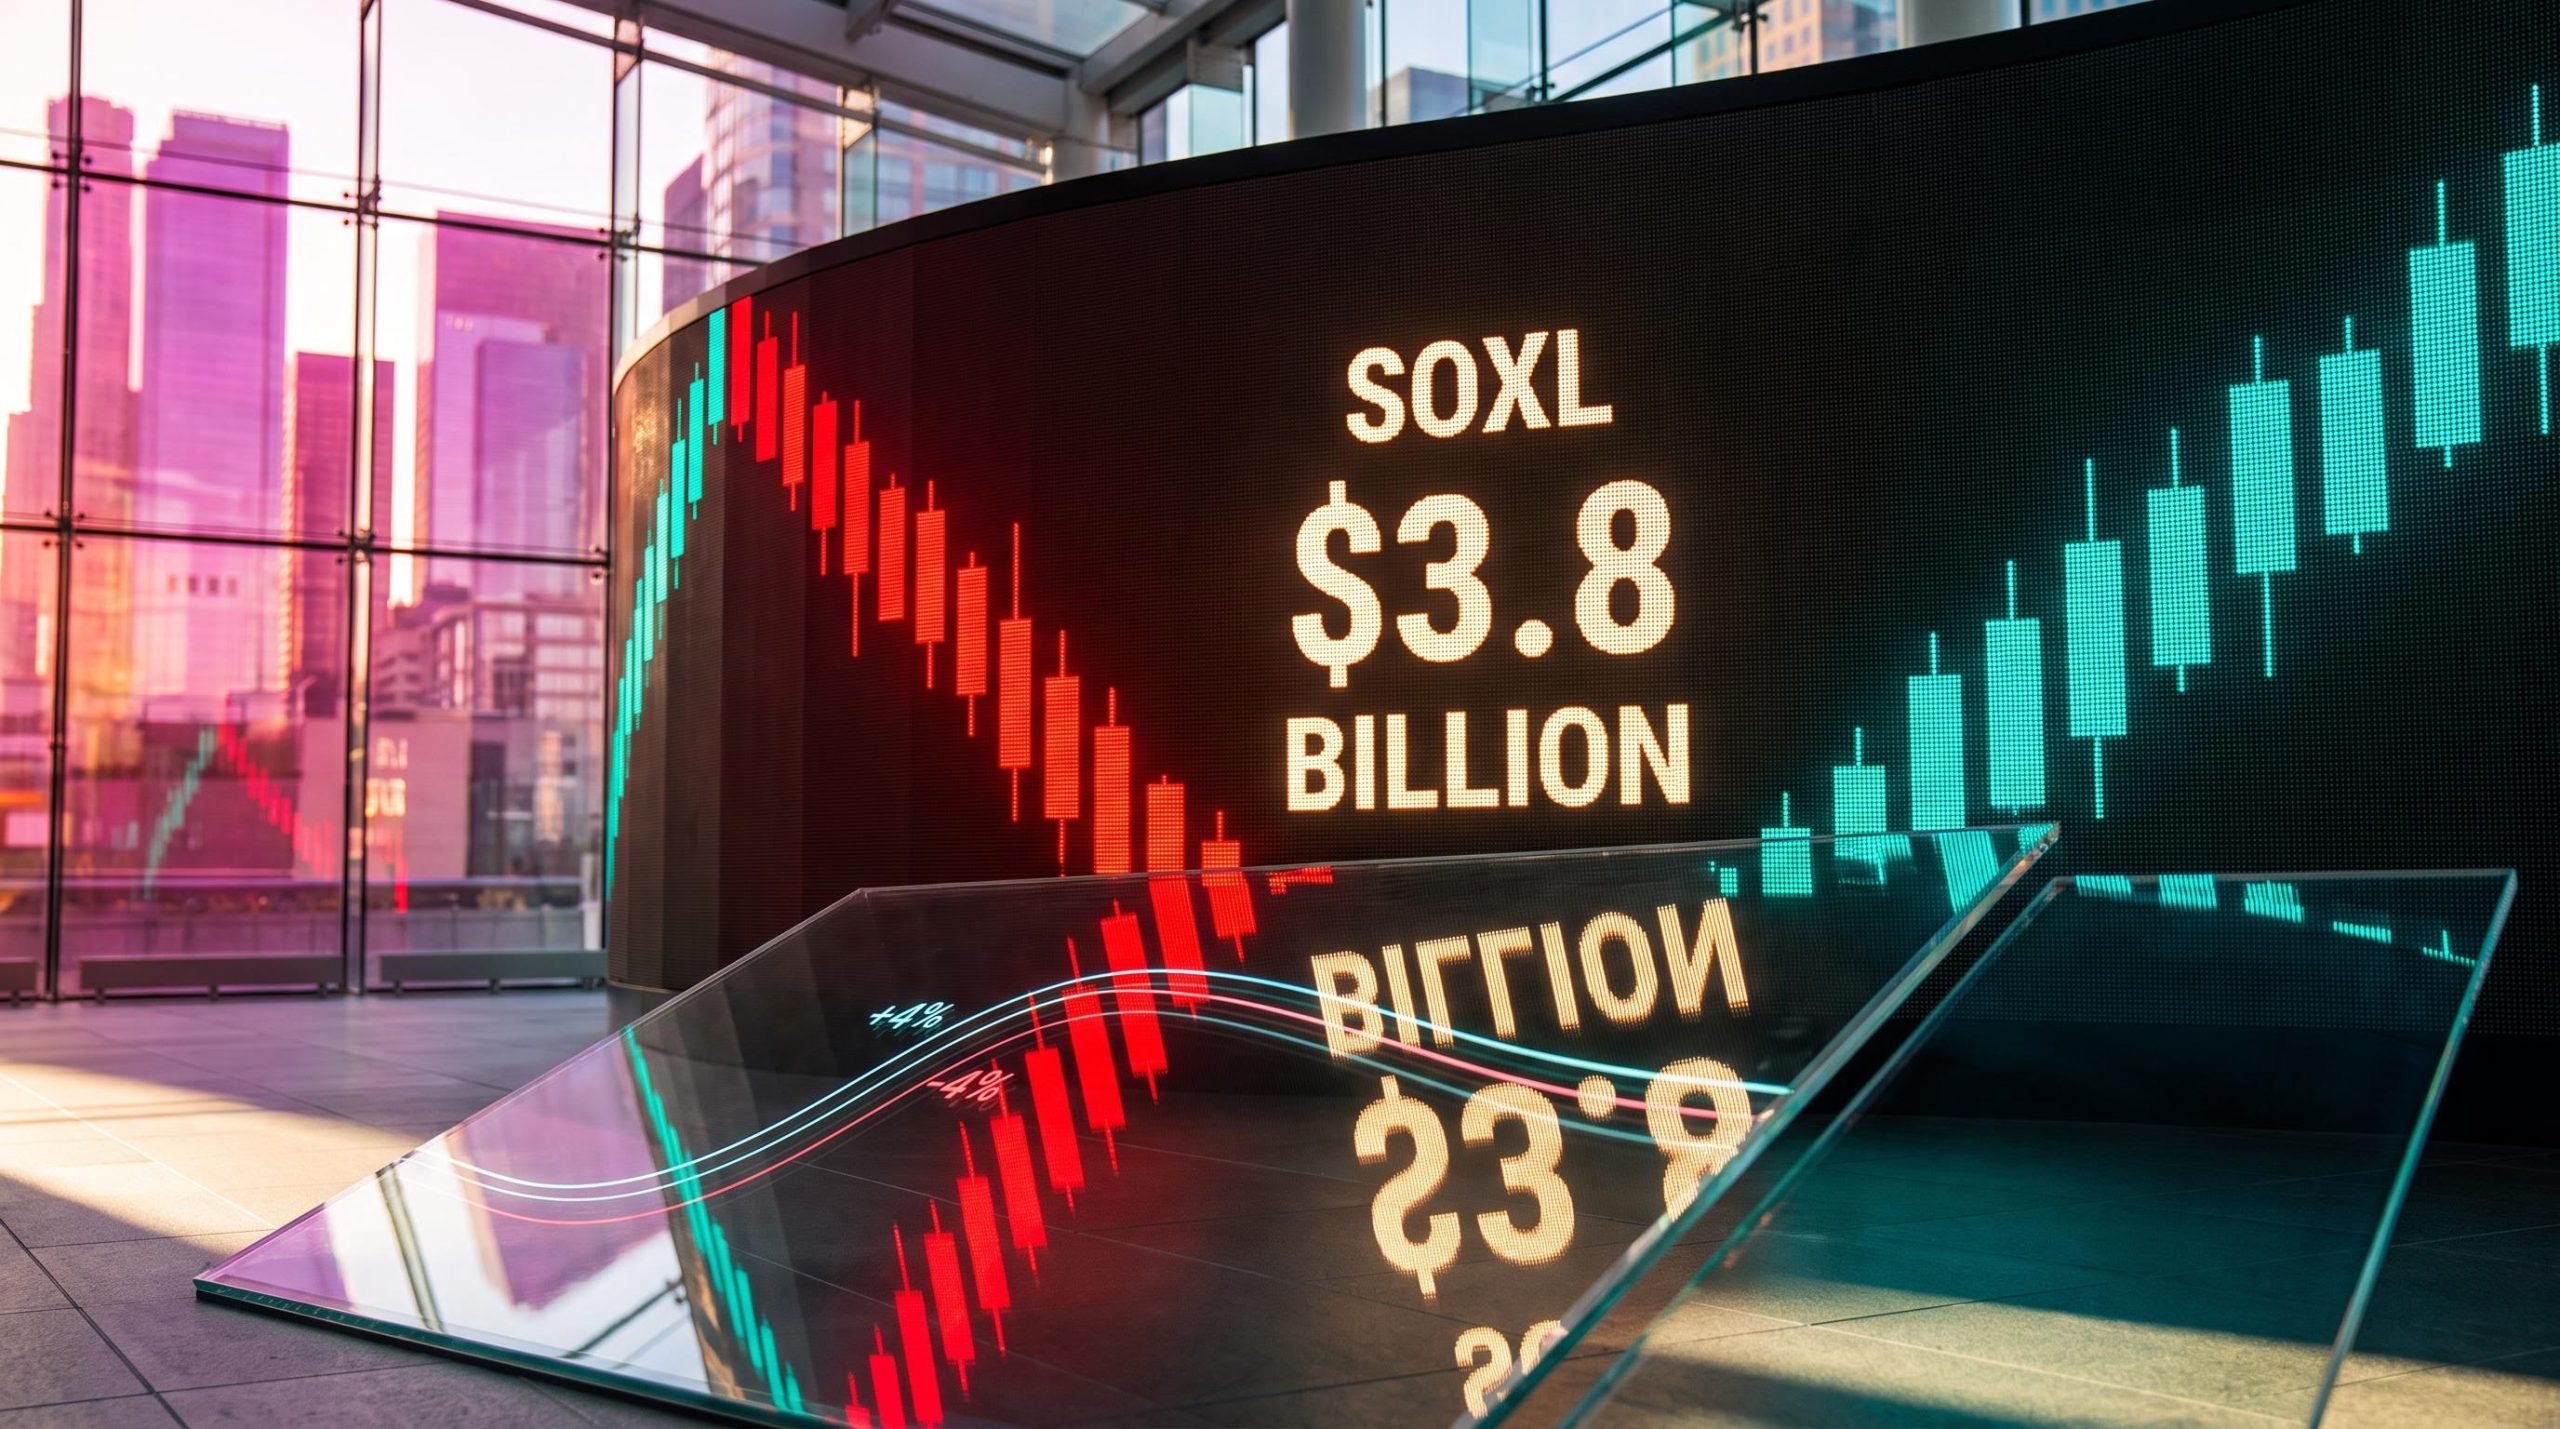
Investors put roughly $3.8 billion into the Direxion Daily Semiconductor Bull 3X (SOXL) in the same week the fund lost about 21-25%. Most readers would call that dip buying. Read alongside NASDAQ 100 earnings skew and the index’s recent slide, it may point to something more fragile in how money is positioned.
The Nasdaq-100 has just come through a five-day drop that MarketWatch put at -4.51% on 16 October 2026, with later reporting closer to -5.5%. That slide lands just before Meta, Tesla, Alphabet, Microsoft, Amazon and Intel report over the next two weeks.
The signals analysts use to read this setup are mechanical, not mystical. Each comes from a rule, a calculation or a price you can observe yourself.
This covers three stress signals: leveraged ETF rebalancing, rolling return bands and option skew. For each one, you will see what it can tell you, and the point at which it stops being useful.
Why do triple-leveraged semiconductor ETFs amplify the end-of-day move?
A leveraged fund has to sell after it falls and buy after it rises. That sounds backwards, but it follows directly from how these products are built.
The mechanics of a daily reset
A 3x fund aims to deliver three times the daily return of its underlying index. To do that, it resets its exposure every day. Here is how the cycle runs:
- The underlying semiconductor index moves up or down during the session.
- The fund’s exposure drifts away from exactly three times its assets.
- The fund trades to bring exposure back to 3x. It buys after an up day and sells after a down day.
- Most of that trading lands near the close.
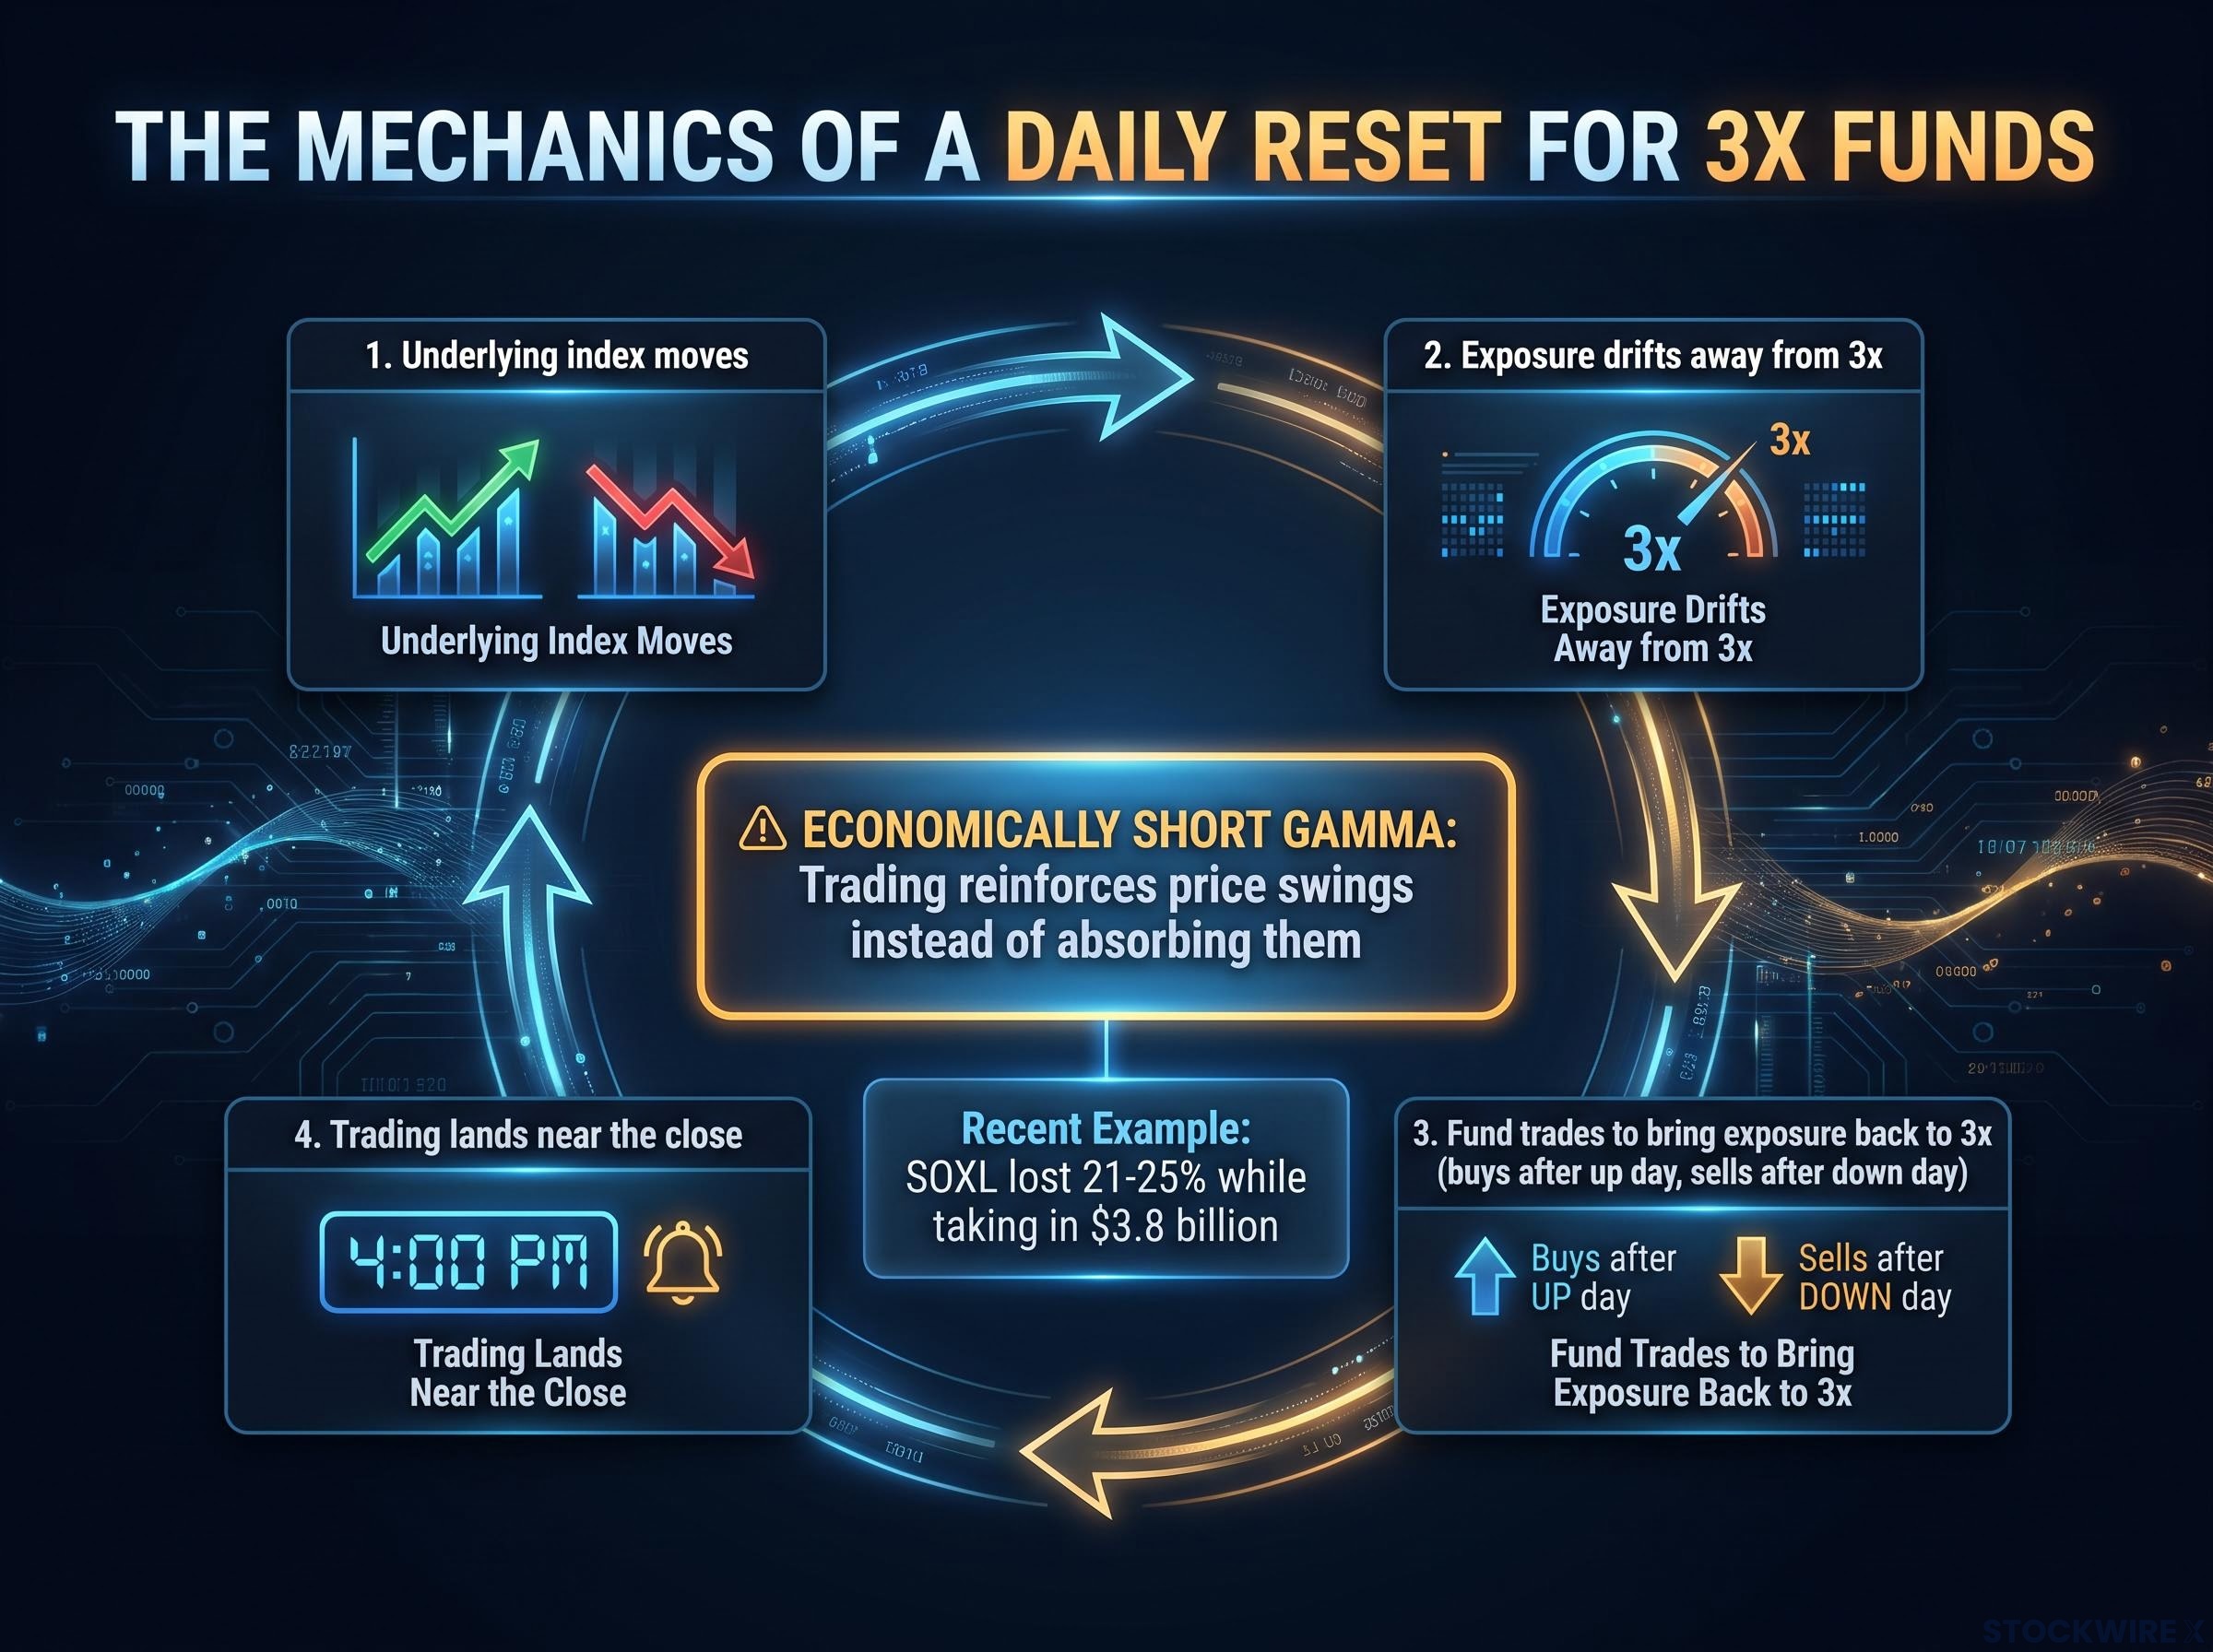
On a down day, the fund’s assets shrink, so its exposure is now too large and it has to sell. On an up day, the opposite happens and it has to buy. Because the trade always follows the move, the fund is described as economically short gamma. In plain terms, that means its trading reinforces price swings instead of absorbing them.
The banks that provide these funds’ swap exposure hedge in the same direction, which concentrates more flow in the final hour. Kevin David of Nasdaq said these forced flows have grown in recent days, though they remain below the levels seen when heavy inflows later reversed.
The $3.8 billion figure needs care. It measures net money entering the fund, not the size of its rebalancing trades. A fund can take in cash while its net asset value falls, and SOXL did exactly that this week.
That gap is where the tension sits. Retail demand is leaning against the fall while the fund’s mechanical selling leans with it. The closing hour is where you will see which side wins.
What limits the effect
None of this guarantees a cascade. The impact depends on the ETF’s size, the liquidity of the underlying stocks, swap exposure and dealer positioning. Dealers who are long gamma dampen moves, while dealers who are short gamma reinforce them. The mechanics also cut both ways: the same rebalancing turns into buying when semiconductors rise.
Rebound risk Brent Kachuba of SpotGamma cautioned that investors could miss a sharp rebound if favourable big-tech news revives the AI demand story.
The US Securities and Exchange Commission (SEC) has long warned that returns on leveraged ETFs held for more than a day can differ sharply from the daily multiple. When a market makes a sudden move around 3:30 pm on an extreme day, the cause may be the mechanics rather than any new information.
The SEC Investor Bulletin on leveraged and inverse ETFs explains that daily resets and compounding can push your multi-day returns far from the stated daily multiple, which exposes you to sudden and significant losses.
When big ASX news breaks, our subscribers know first
How do rolling five-day return bands show the NASDAQ 100 is stretched?
Rebalancing tells you about pressure. A return band tells you how far that pressure has already pushed the index.
You can build the band yourself. Calculate the index’s return over every rolling five-day window across the past year, then mark where the extremes tend to cluster. David drew loose bands at about +4% and -4% and described them as guides, not rigid rules.
This week the index tested the lower band on Wednesday, and a bounce followed the next day. Before that, the Nasdaq-100 had kept rising despite higher interest rates, until that pattern stalled over the previous 5-10 days.
The size of the breach depends on which source you use:
| Source | Reported five-day move | Close or date | Note |
|---|---|---|---|
| MarketWatch | -4.51% | 16 October 2026 | Just beyond the lower band |
| Later reporting | Approx. -5.5% | Close of 29,187.55 on 16 October | A deeper breach |
Semiconductors took the heavier hit. The PHLX Semiconductor Index (SOX) reportedly fell more than 12% over six to seven sessions, with sources differing on the exact count. Some reports describe an eight-session losing streak, but that claim has not been independently confirmed.
The difficult part comes next. The same reading can point to opposite conclusions:
- A trend can keep running outside the band, so a breach may mark the start of a move rather than its end.
- The band depends on your sample, including the start date, the volatility regime and whether you use closing or intraday prices.
- A breach can mean the index is oversold, or that deleveraging has further to run.
- The band describes current conditions. It does not forecast what comes next.
A move below the lower band tells you momentum is unusual. It does not tell you a bottom is in. Check it against positioning data before you draw any conclusion. The band costs nothing to build, but it should not be your only timing tool.
What the June-July semiconductor leverage unwind teaches about today’s setup
For a sense of how positioning can resolve, David points to a recent precedent in Korea.
It unfolded in stages. Korean leveraged-equity exposure built to about $50 billion by the end of June. The KOSPI then fell about 28.5% from a record close of 9,114.55 on 22 June to roughly 6,516 by 21 July. By then, leveraged exposure had fallen to $26 billion.
The selloff spread to US semiconductor funds. The iShares Semiconductor ETF (SOXX) fell about 25% from its 22 June peak, while SOXL fell nearly 63%. That gap shows what leverage does to a move.
The KOSPI was volatile in both directions. It rebounded 5.76% on 3 July. On 29 July it fell as much as 12.6% intraday, and trading was halted.
The Bank of Korea attributed the volatility to heavy semiconductor concentration, foreign investors rebalancing their portfolios, and leverage building and unwinding both at home and abroad. The recovery followed the same steps in reverse: forced selling eased, dip buyers stepped in, shorts covered and foreign buying returned. That is why unwinds can end as quickly as they start.
| Measure | June-July | October | Comparison note |
|---|---|---|---|
| Lead market | KOSPI | US semiconductors, Nasdaq-100 | Different lead assets |
| Leveraged exposure | $50B falling to $26B | Not reported | Flows growing, not described as comparable in scale |
| SOXL move | Nearly -63% | About -21% to -25% in one week | Different time windows |
| SOXL flows | $6.9B of inflows in July | About $3.8B in one week | Money arriving during declines |
Figures vary by date and definition across sources. Volmageddon on 5 February 2018 involved volatility products rather than equity funds, but it showed the same forced-rebalancing mechanism at work.
Systemic risk rises when:
- leveraged exposure is large relative to underlying liquidity
- many products reference the same concentrated stocks
- prices are already falling quickly
- funds and counterparties rebalance at the same time
- margin calls force additional selling
The precedent shows that concentrated semiconductor leverage can produce outsized falls and equally sharp rebounds. Prepare for both outcomes instead of assuming one direction. Use the comparison as a lens, not a forecast.
How does NASDAQ 100 earnings skew shift, and what does call-skew exhaustion look like?
Skew is the relative price of downside options compared with upside options. When put skew is high, investors are paying more for protection against a fall. When call skew is high, they are paying up to bet on a rise.
The Cboe SKEW index is a different measure. It tracks the pricing of far out-of-the-money S&P 500 puts, meaning options that only pay out if the market falls sharply. It is not the same as Nasdaq-100 put/call volume ratios. Saxo reported SKEW at 154.74 on 14 October and 157.30 on 15 October, with the VIX at 16.87. These readings have not been independently confirmed.
Why calls get bid before earnings
During Q2 reporting, David observed call skew being bid up both in single stocks and at the index level. Several forces drive that demand. Calls let you speculate on an upside surprise while limiting your loss to the premium paid. They also tap into crowded AI and mega-cap narratives. Dealers who sell calls buy stock as those options gain value, which can amplify a rally. Earnings events also carry their own volatility premium.
Positioning is not uniform. Schaeffer’s data from 13 October, which is also unconfirmed, showed Bank of America with a 10-day call/put ratio of 3.67 (99th percentile), while Goldman Sachs sat near 0.98.
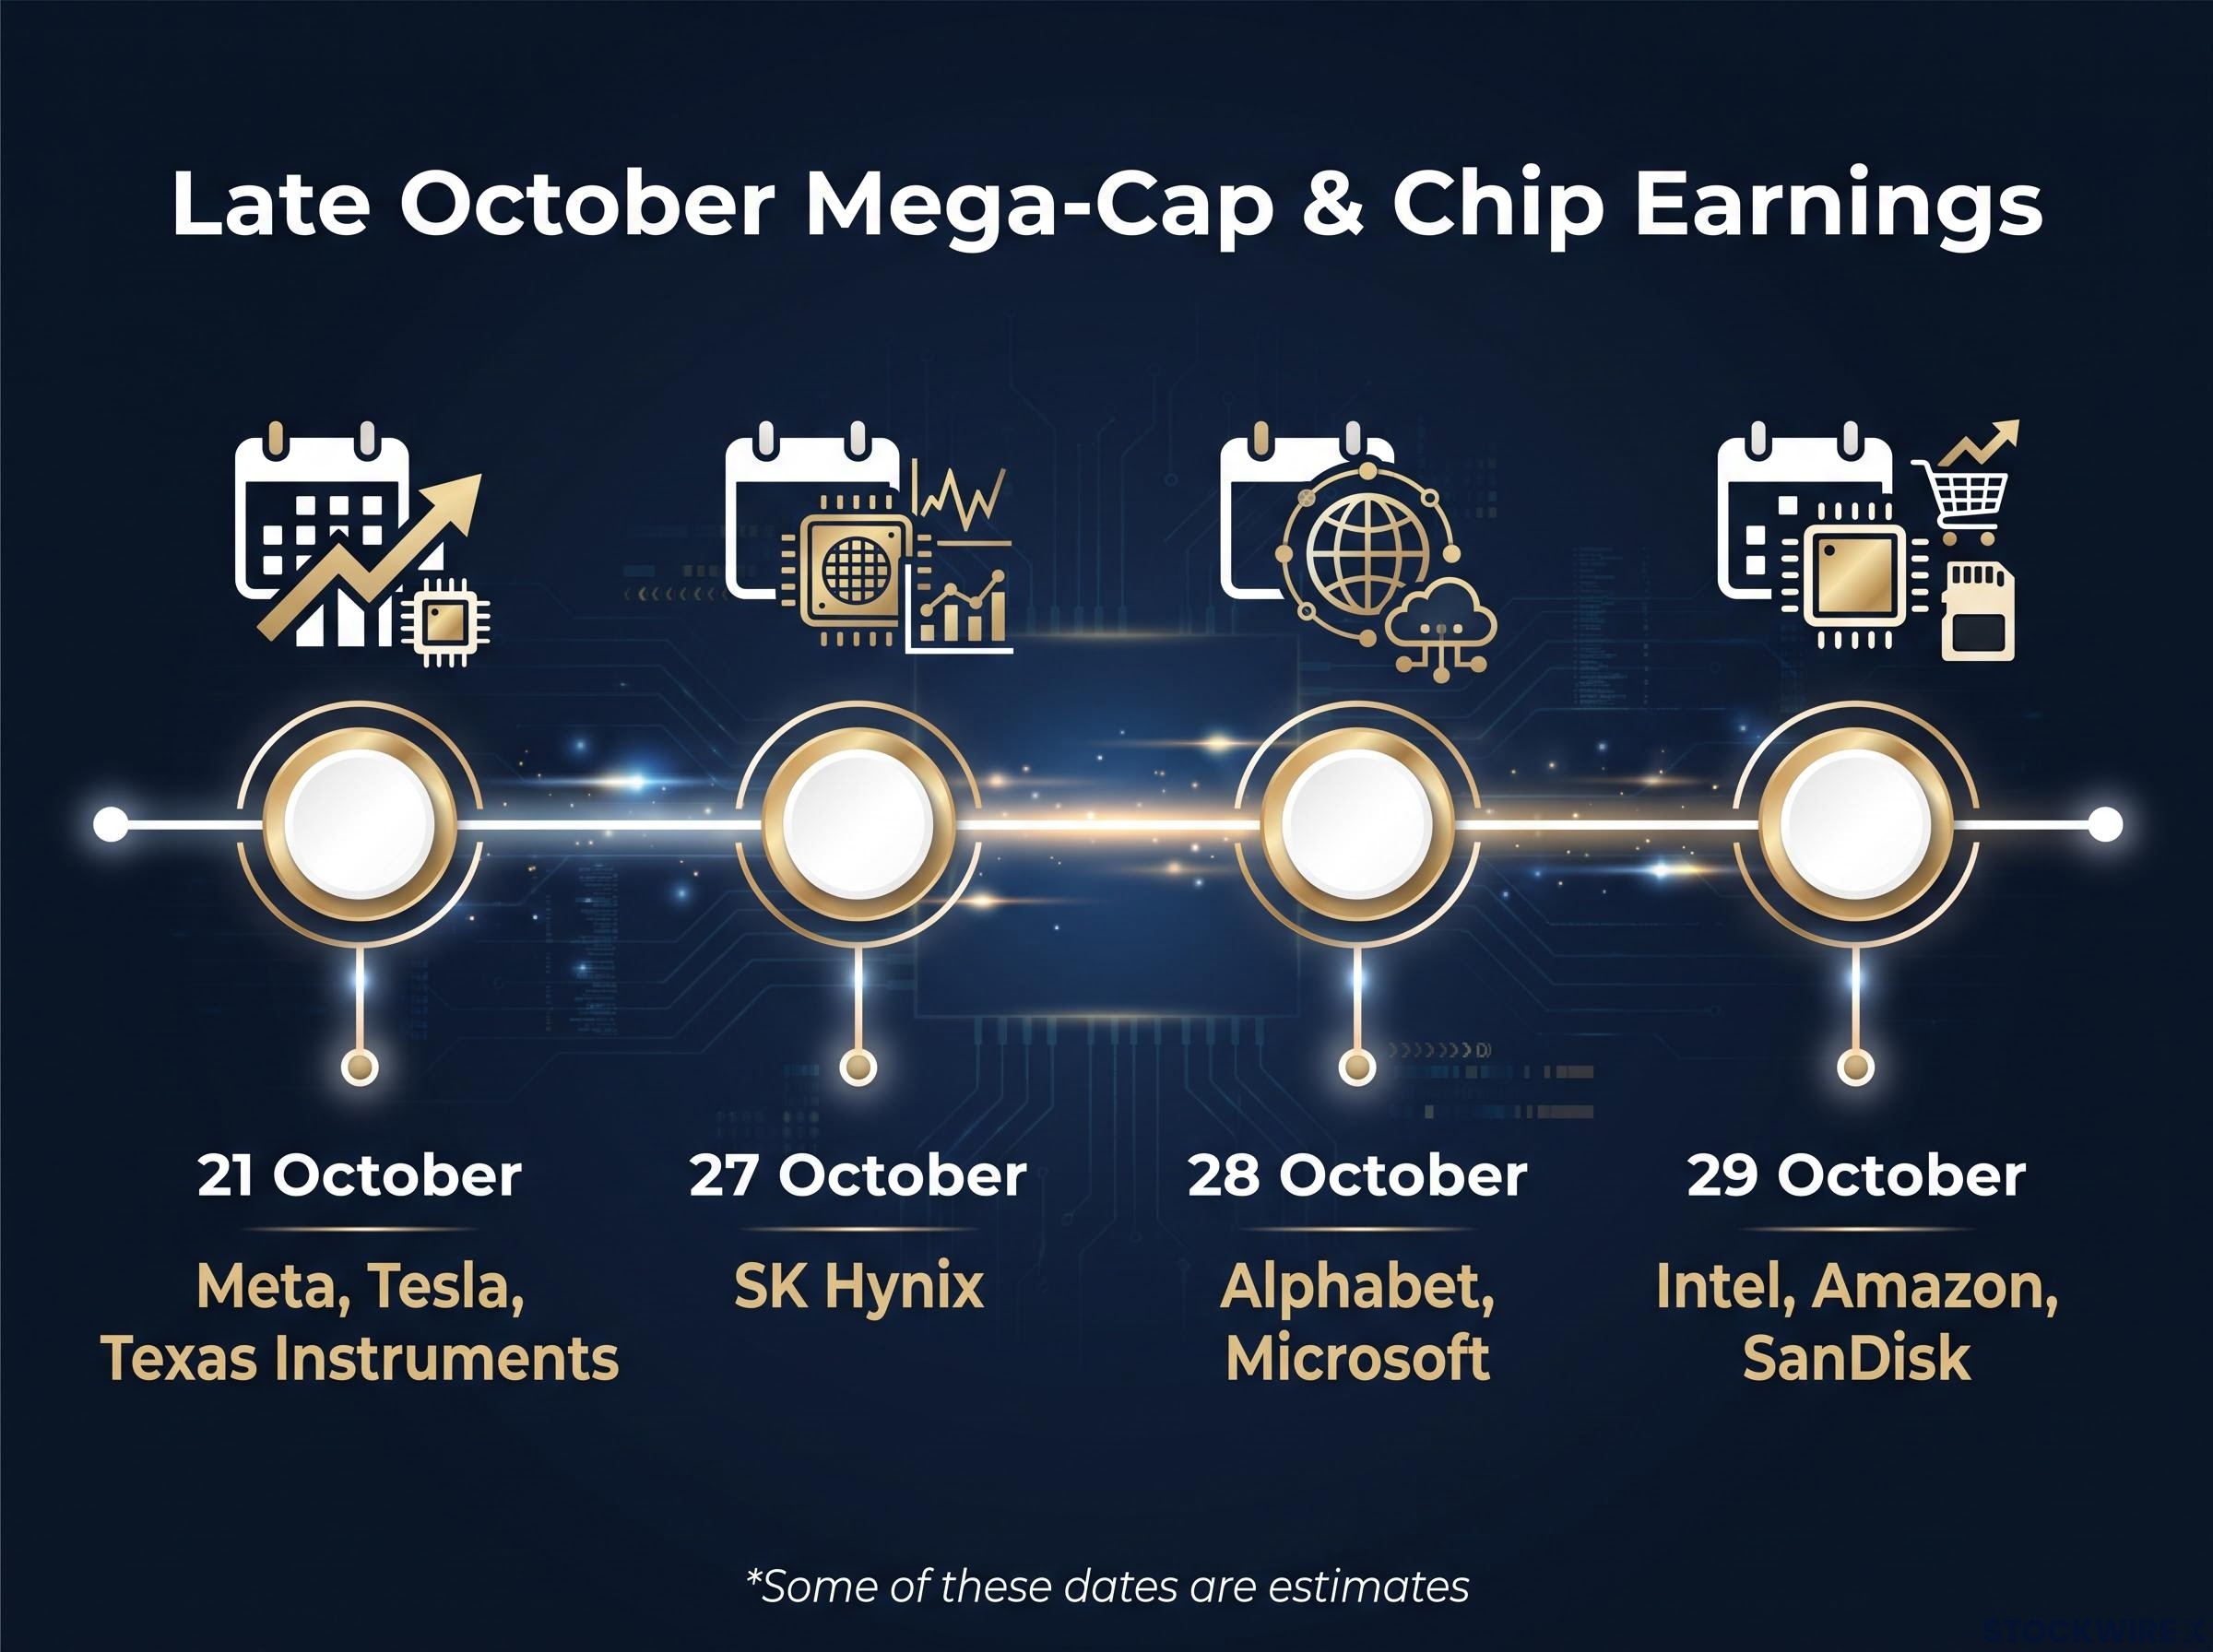
| Date | Company | Why it matters for NDX skew |
|---|---|---|
| 21 October | Meta, Tesla, Texas Instruments | Mega-cap and chip sentiment |
| 27 October | SK Hynix | Memory demand, Korea link |
| 28 October | Alphabet, Microsoft | AI spending signals |
| 29 October | Intel, Amazon, SanDisk | Chips and cloud |
Some of these dates are estimates.
What exhaustion looks like
David suggests call demand may be exhausting, and he plans to watch for inflections over the next two weeks. These are the signs to look for:
- call volume stays extreme while prices stop responding
- calls are sold to close rather than bought to open
- dealers turn long gamma after customers take profits
- post-earnings price gaps fail to hold
- demand shifts toward puts or put spreads
Elevated index SKEW and call-heavy single stocks are both documented. A market-wide call-skew exhaustion has not been established, and skew is not a directional forecast. Elevated skew tells you the market is paying up ahead of these reports. Judge each post-earnings reaction against that pricing, not against the headline numbers alone.
Options signals around earnings, such as elevated implied volatility and lopsided call pricing, describe positioning and risk economics, and past implied moves have frequently missed the realised result in both directions.
What these signals change, and what they do not
You now have three ways to read the tape. Leveraged flow shows mechanical pressure, return bands show how stretched the index is, and skew shows what investors are paying for protection and upside. None of them works as a standalone timing tool. Leveraged ETFs also carry compounding risk, which means their returns can drift well away from the daily multiple when you hold them for more than a day.
Held beyond one session, these funds also suffer volatility drag, which erodes value even when the index ends flat, so your result can sit far from the daily multiple you expected.
Through the earnings run, watch three things:
- how semiconductors behave in the closing hour
- whether the lower band holds on the next test
- whether skew reprices after the big-tech reports
When all three point the same way, your read is stronger. When they conflict, that disagreement is useful information too.
This article is for informational purposes only and should not be considered financial advice. Investors should conduct their own research and consult with financial professionals before making investment decisions. Past performance does not guarantee future results, and the statements above about market behaviour are speculative and subject to change based on market developments.