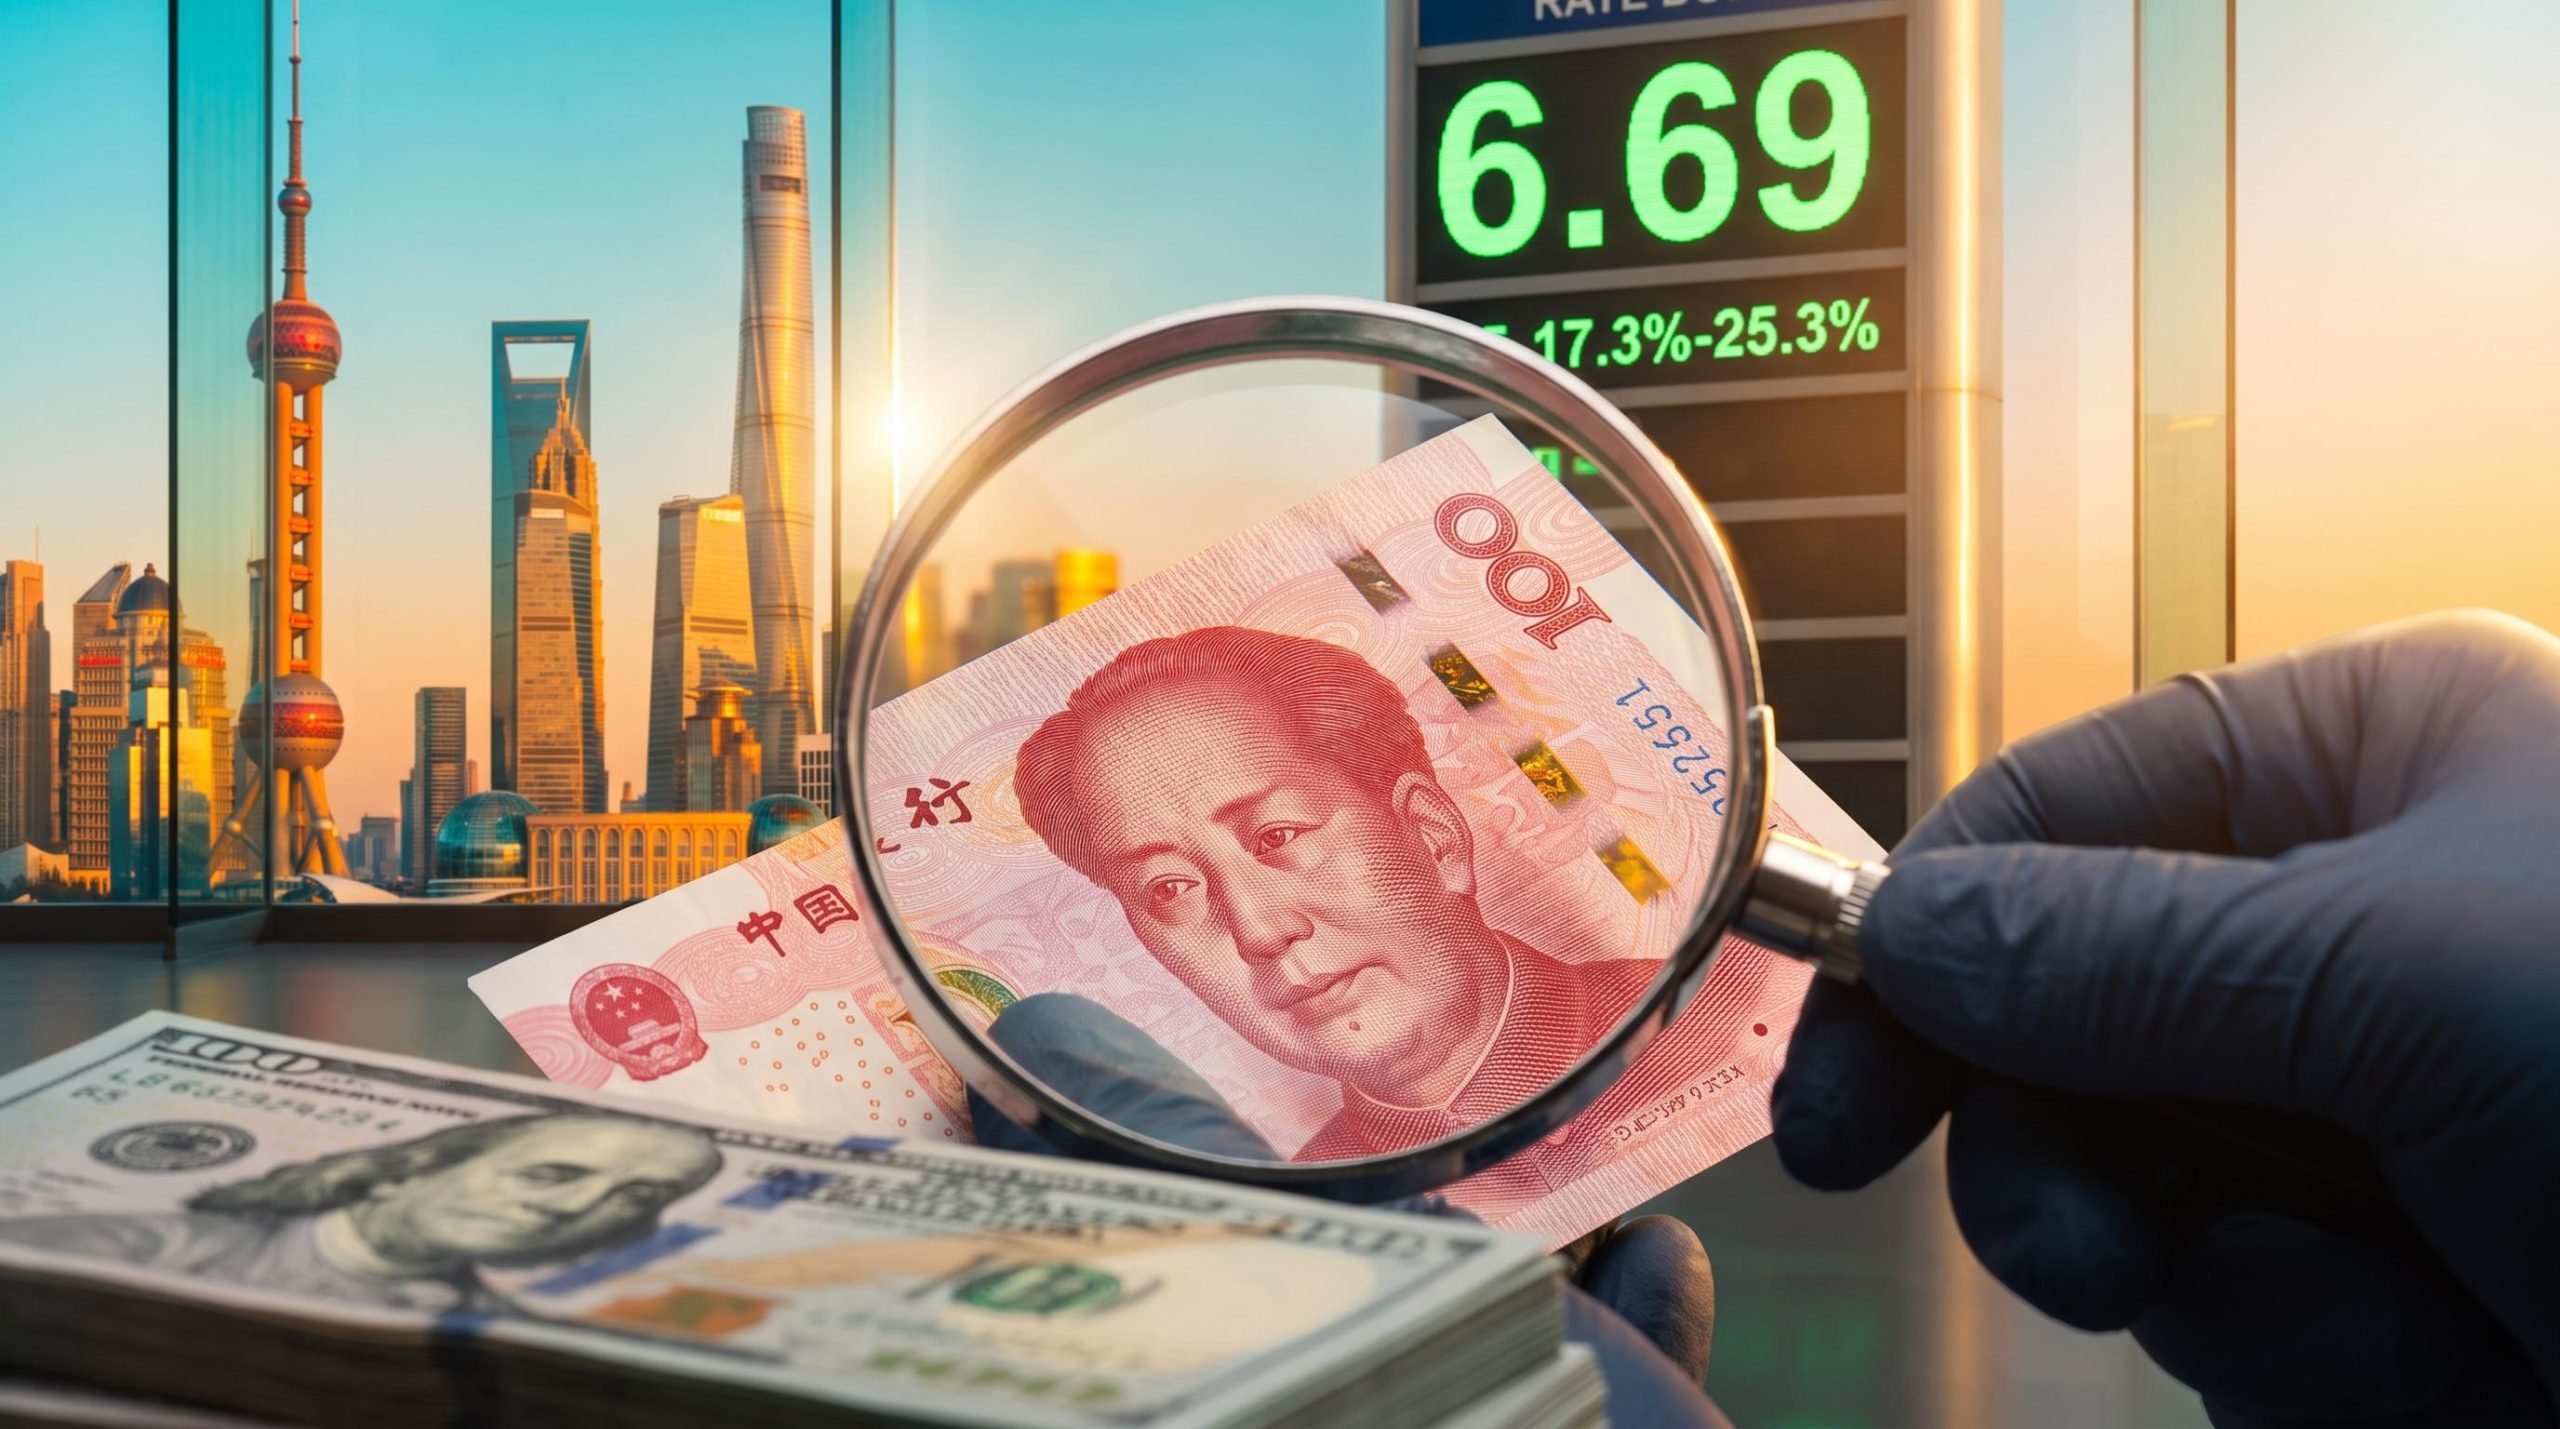
The offshore yuan is trading near 6.69 per dollar, its firmest level since July 2022. Yet the International Monetary Fund (IMF) still estimates the currency is undervalued by 17.3%-25.3% in real terms. That sounds like a contradiction, but yuan strength and IMF undervaluation can both hold at once. Many readers misread that signal.
One clarification on the headline level: the “strongest since 2022” description applies mainly to the offshore rate (USD/CNH). The onshore yuan’s comparable high is more recent, dating to early 2023.
The timing matters because two catalysts land next week. Q3 GDP and September activity data are due in the week of 19 October. The Financial Street Forum runs 19-22 October in Beijing, with keynotes from People’s Bank of China (PBoC) Governor Pan Gongsheng and National Financial Regulatory Administration head Ding Xiangqun.
Here is what the IMF number actually measures, what it leaves out, and which of next week’s signals could move the currency.
What the IMF’s 17-25% undervaluation estimate actually measures
The natural reading of a 21.3% undervaluation midpoint is that the yuan should rise by roughly that much against the dollar. That reading is wrong, and the reason sits inside the IMF’s methodology.
The figure comes from the IMF’s 2026 External Sector Report, published on 30 July 2026. It covers 30 major economies using 2025 data. It is a real effective exchange rate (REER) estimate. A REER measures a currency against a weighted basket of trading partners’ currencies, adjusted for differences in inflation.
The key distinction The IMF estimate concerns the yuan’s real effective exchange rate, not the nominal USD/CNY rate quoted on your screen.
How the IMF builds the number
The External Balance Assessment (EBA), the IMF’s model for judging whether a country’s external position is in line with its fundamentals, works in four steps:
- Estimate China’s cyclically adjusted current-account balance, meaning the surplus with temporary economic swings stripped out.
- Compare that balance with an estimated “current-account norm”, the level the model considers appropriate.
- Convert the gap into an implied exchange-rate adjustment using the model’s sensitivity of the current account to the REER.
- Express the result in real effective terms.
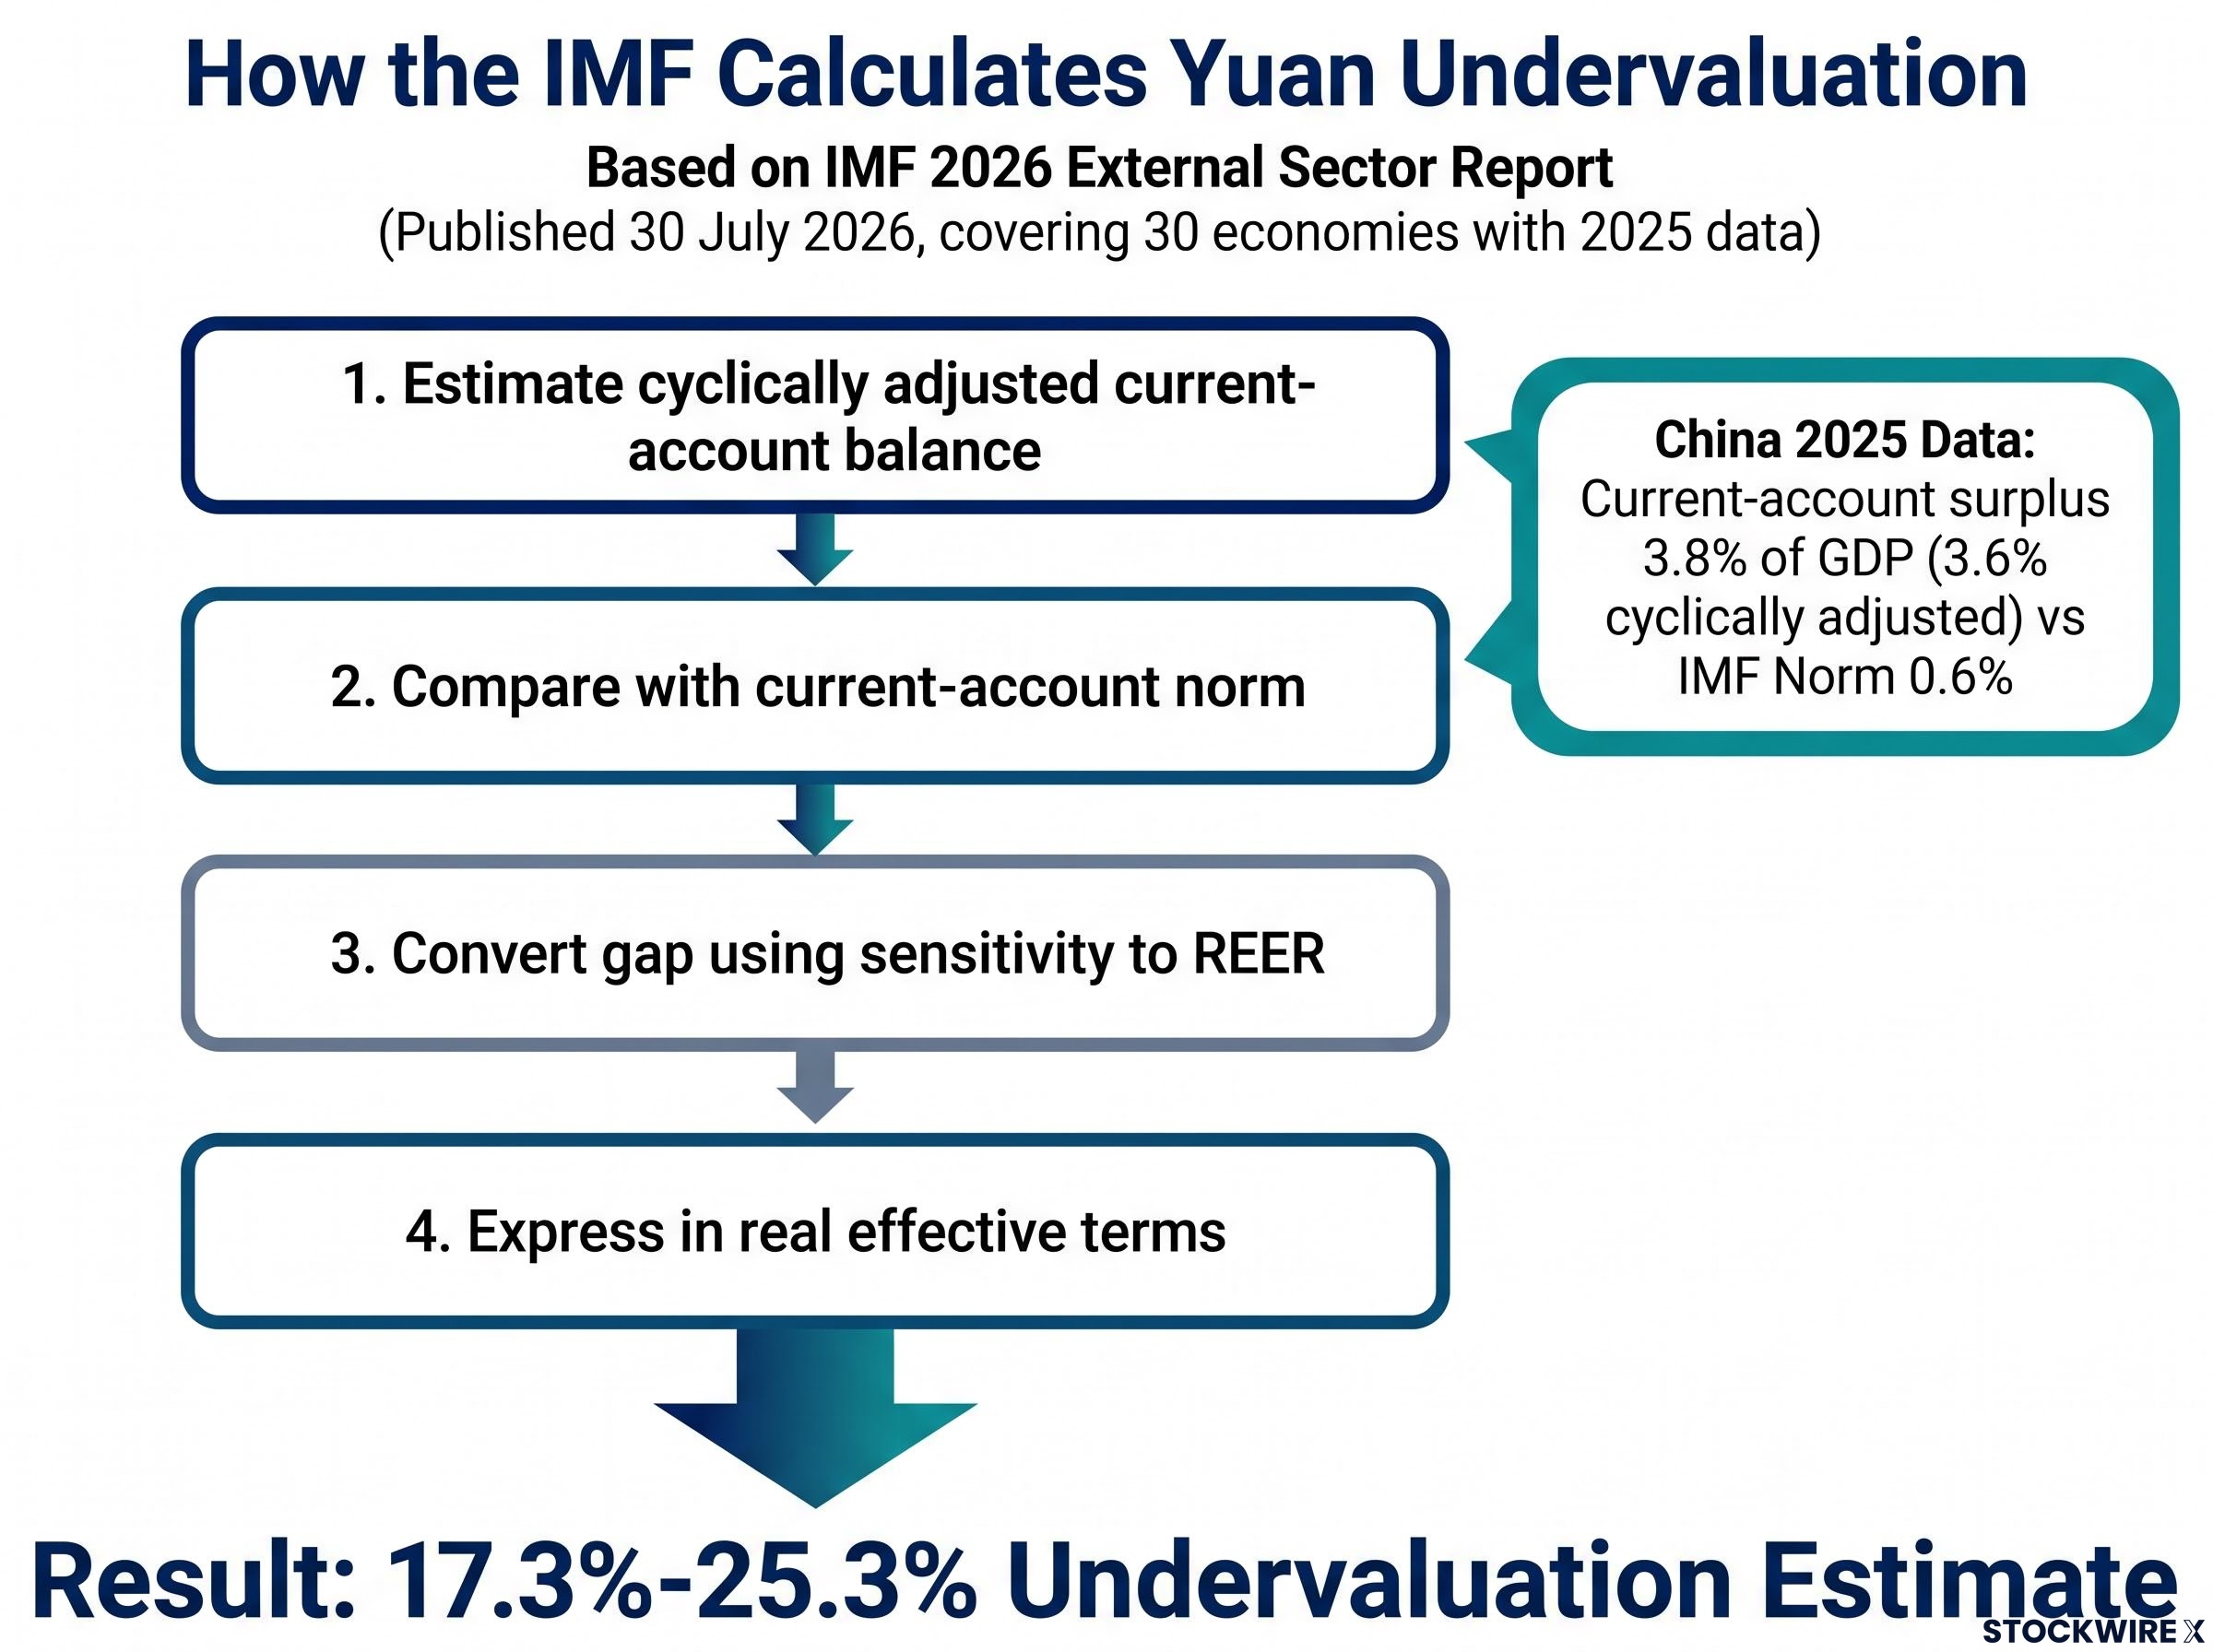
China’s 2025 current-account surplus was 3.8% of GDP, or 3.6% after cyclical adjustment. The IMF’s norm sat at about 0.6%. The undervaluation figure is essentially that three-point gap translated into currency terms.
Why the PBoC and others push back
According to UOB Group, the PBoC argues the assessment describes external balance and is not a direct verdict on where the nominal rate should be. It also disputes treating EBA output as a measure of equilibrium, since different models produce materially different answers.
The PBoC argues manufacturing competitiveness, not the currency’s level, drives the surplus, and even analysts who see a cheap yuan concede that appreciation alone cannot close the gap with the IMF’s estimate.
The model is sensitive to its assumptions about the current-account norm, fiscal policy, demographics, reserves, capital controls, productivity and trade elasticities. The IMF’s own main recommendation is to raise domestic demand and rebalance growth, not to force the currency higher.
For you, the estimate works as a gauge of how lopsided China’s external position is. Read it as a USD/CNY forecast and you misjudge both the size and the timing of any move.
When big ASX news breaks, our subscribers know first
Why a K-shaped recovery can lift the yuan while domestic demand lags
If the imbalance is the story, September’s data shows where it comes from. Two economies appear in the same set of numbers.
What September’s data shows
| Indicator | September 2026 | Expectation | Prior month |
|---|---|---|---|
| CPI y/y | +0.9% | +1.0% | +0.8% |
| Core CPI y/y | +1.0% | Not reported | Not reported |
| PPI y/y | +5.0% | +4.4% | +3.8% |
| Exports y/y | +36.3% | About +25%-26% | Not reported |
| Imports y/y | +31.0% | Well below actual | Not reported |
| Trade surplus | About US$133.53bn | Not reported | About US$119.1bn |
Sources: National Bureau of Statistics; China Customs.
The external side is running hot. Exports beat forecasts by about ten points and the surplus widened.
Inside the country, the picture is quieter. Producer prices (PPI) jumped to 5.0% while consumer prices (CPI) rose just 0.9%. That gap tells you cost pressure is not reaching households, which points to weak demand. Currency strength here reflects export and capital flows, not a healthy domestic economy.
How banks explain the gap
Societe Generale calls this a K-shaped recovery, where some parts of the economy rise while others decline. Export manufacturing and technology are strong. Consumption, property and employment are weak. The external sector can carry the currency without broad domestic support, and the IMF gap reflects that imbalance.
The K-shaped split is now treated by institutional research teams as a structural condition entering its sixth year, with technology exports surging while property and consumption stay weak.
The bank forecasts sharpen the mechanics:
- Societe Generale: strong exports and tech explain how a firm currency coexists with an undervaluation gap.
- Goldman Sachs: estimates undervaluation at 20%-25% and forecasts USD/CNY at about 6.40 in 12 months, citing the trade surplus, corporate FX receipts and greater official tolerance for gradual gains.
- UBS: forecasts 6.60 by end-2026 and 6.50 by mid-2027, driven by surplus receipts, higher conversion and PBoC fixing guidance.
A summary from Finvaulta adds that exporter FX conversion reached about 63% in August, against roughly 45% in normal years. The same summary says the daily fixing was guiding appreciation at about 15 pips a day.
Most of this is cyclical, policy-tolerated appreciation. Goldman’s 6.40 call is the clearest structural reading, a bet that a large surplus and rising competitiveness keep pushing the yuan higher.
What could cut against the rally: exporter margins, deflation and two-way risk
The momentum case is easy to follow. The fragilities beneath it get less attention.
- Exporter margins: a stronger yuan shrinks the renminbi value of dollar revenue, hitting low-margin firms with little pricing power hardest.
- Pass-through: BBVA Research flagged on 29 September 2026 that weak PPI-to-CPI pass-through is characteristic of China’s deflationary environment.
- Deflation: a firmer currency makes imports cheaper, which could reinforce disinflation.
- Capital-flow instability: appreciation can draw speculative money and one-way bets that reverse quickly.
- Property: Bloomberg reported on 15 October that the property downturn and weak job creation continue to weigh on confidence. A stronger currency fixes neither.
ING’s 12 October “Asia FX Talking” note warned that two-way risk is rising. It said positioning is vulnerable to a change in fixing signals, a weaker global tech cycle, renewed dollar strength or a shift in US-China conditions.
The daily yuan fixing is published each morning before trading opens and caps onshore moves within a 2% band, which is why gaps between the fix and spot are read as the closest real-time signal of Beijing’s priorities.
History supports caution. When China exited the dollar peg in July 2005, appreciation over the following years was gradual and managed, interrupted by the global financial crisis. It tended to come when large surpluses, strong inflows, rising productivity, trading-partner pressure and a financial-stability judgment lined up.
The PBoC’s stance: managed flexibility Exchange-rate policy stays market-based, the central bank will prevent excessive one-way expectations, and China does not intend to devalue for competitiveness.
If you hold yuan exposure or trade with China, the likely path is gradual and policy-shaped, with reversals possible. It is not a straight line toward the IMF’s number.
What to watch next week: Q3 GDP and the Financial Street Forum
Next week turns these readings into something testable.
Q3 GDP and activity data
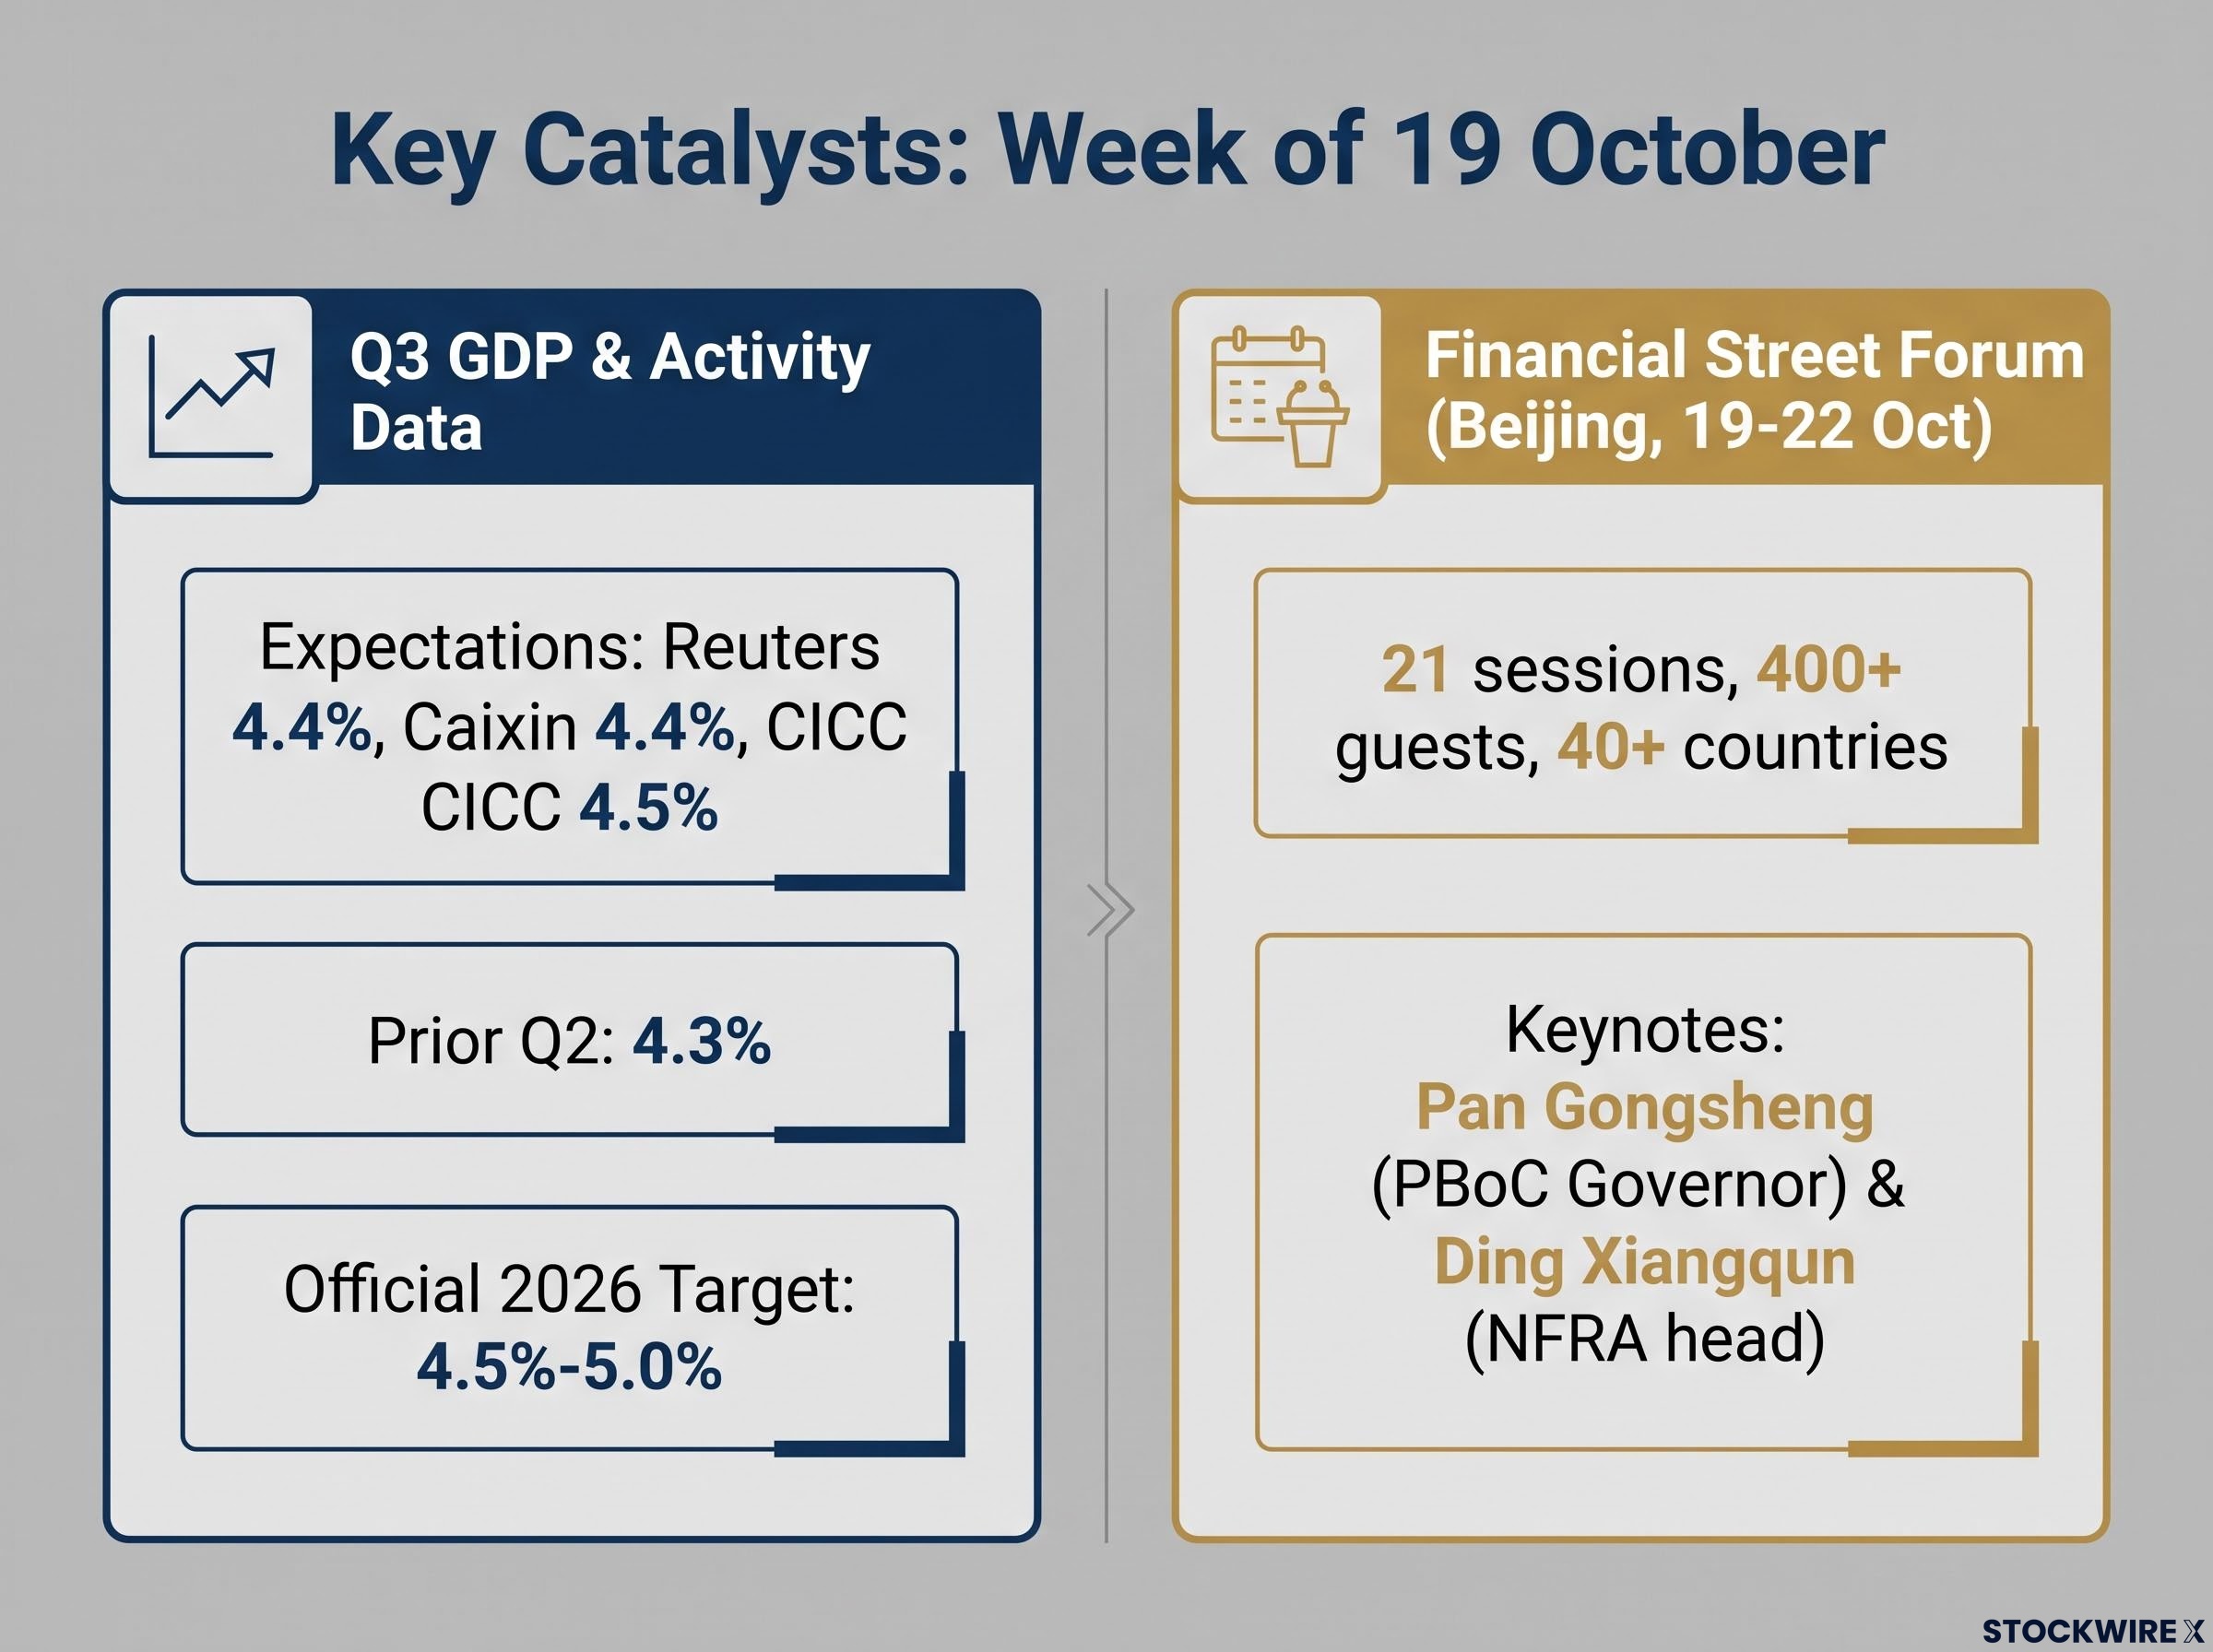
Q3 GDP and September activity data are due in the week of 19 October, though no precise release time was reported. A Reuters poll expects 4.4% year-on-year growth, up from 4.3% in Q2. The Caixin average is also 4.4%, and CICC expects 4.5%.
The official 2026 target is 4.5%-5.0%. Societe Generale economists think it is reachable with modest incremental easing. A print near 4.4% with weak retail sales would tell you the K-shaped pattern persists.
Financial Street Forum speeches
The forum runs 19-22 October under the theme of openness, cooperation and inclusiveness in global finance. It spans 21 sessions and 400+ guests from 40+ countries and regions. Pan Gongsheng and Ding Xiangqun give keynotes, alongside CSRC Chairman Wu Qing and Zhu Hexin, PBoC deputy governor and head of SAFE, the State Administration of Foreign Exchange.
The phrases worth tracking:
- Any explicit tolerance of further appreciation
- Whether “two-way fluctuations” remains the preferred wording
- Priority for domestic demand over export-led growth
- Treatment of property and financial-stability risk
- Signals on fiscal, monetary or targeted credit easing
| Catalyst | What to watch | Bullish yuan signal | Cautious signal |
|---|---|---|---|
| Q3 GDP | Headline versus 4.4% consensus | Beat with firmer retail sales | Miss or weak consumption |
| Activity data | Retail sales, fixed-asset investment, industrial output, property | Demand broadening beyond exports | Property and consumption still sliding |
| PBoC fixing | Daily fixing versus expectations, FX conversion ratios | Continued gradual stronger fixings | Fixings leaning against gains |
| Forum language | Pan Gongsheng on exchange rates | Comfort with appreciation, demand focus | Heavy stress on “two-way fluctuations” |
Watch core CPI and export growth alongside these. The words from Pan Gongsheng will show whether policy lets the yuan keep climbing.
Past performance does not guarantee future results. Forecasts cited here are subject to market conditions and various risk factors.
What the gap tells you, and what it does not
The yuan’s strength is externally supported, policy-tolerated appreciation during an uneven domestic recovery. Exports, surplus receipts and steady fixings are doing the lifting, while households lag behind.
The IMF estimate flags a long-run external imbalance. It does not mean the yuan must rise by 17%-25% against the dollar, and certainly not quickly.
Hold both facts together. Next week’s GDP print and forum language will show whether demand is broadening or whether the K-shaped split, and the managed pace of gains, remains the better read.
This article is for informational purposes only and should not be considered financial advice. Investors should conduct their own research and consult with financial professionals before making investment decisions.