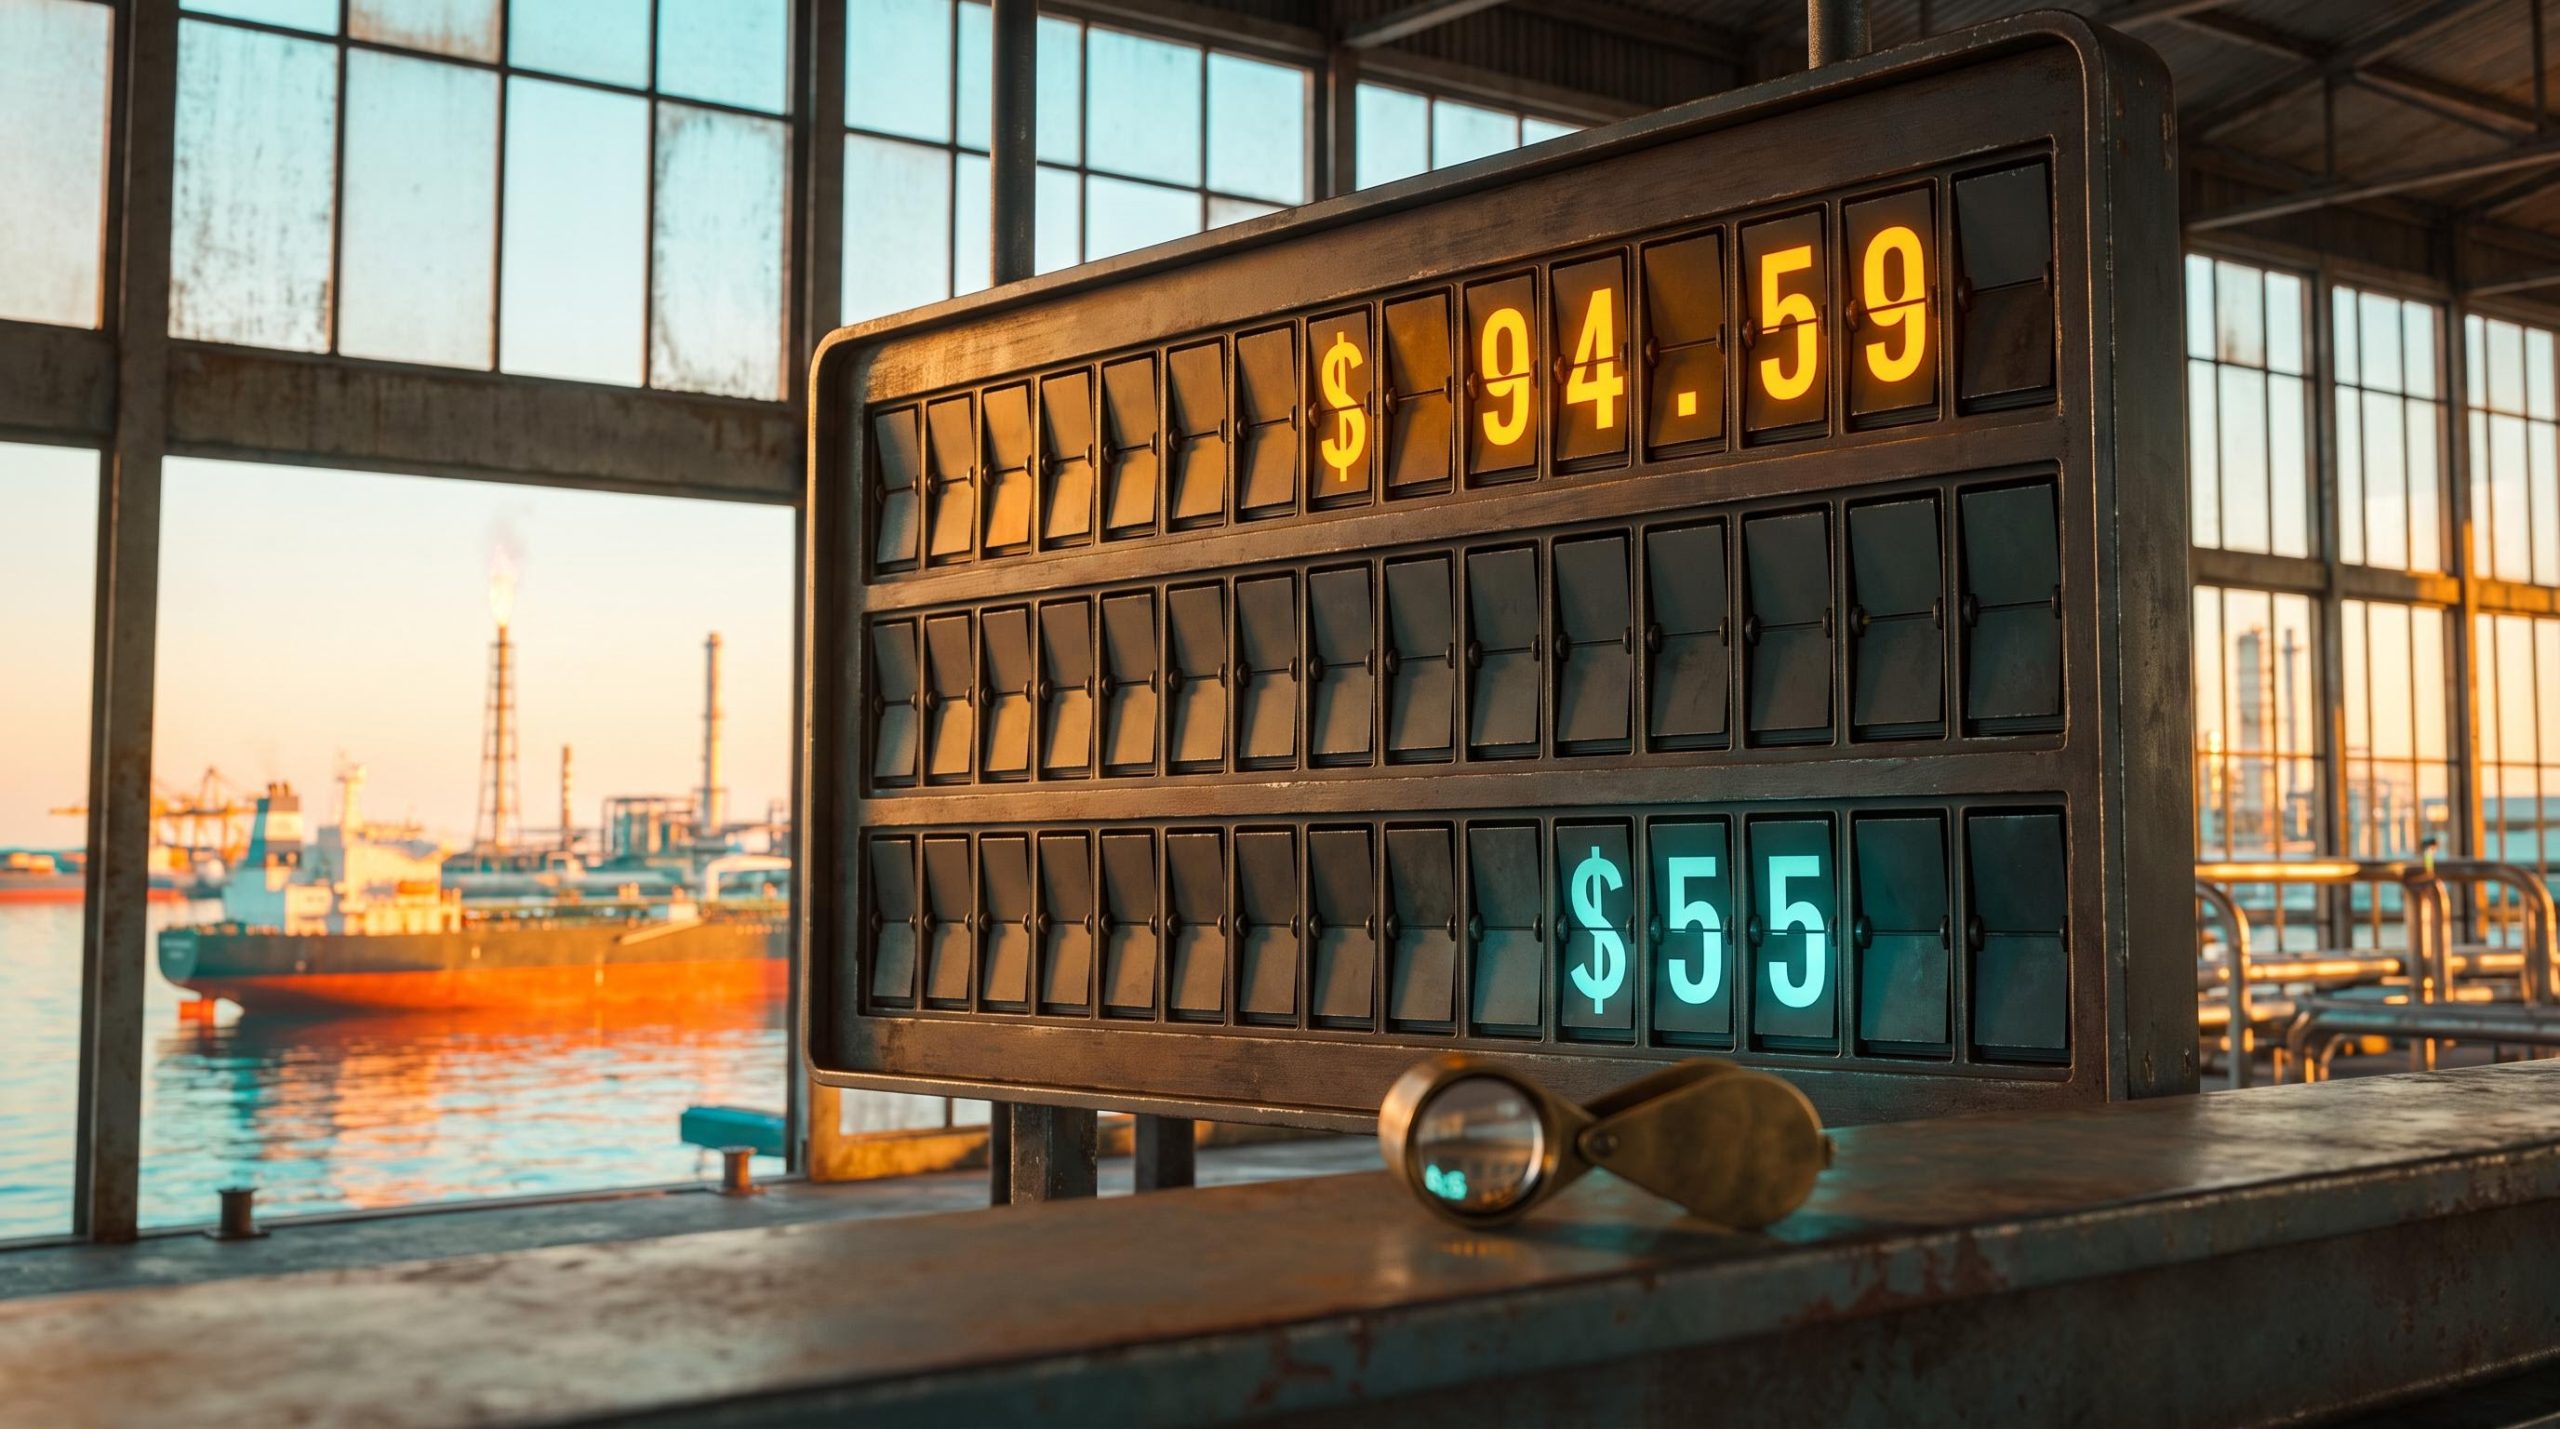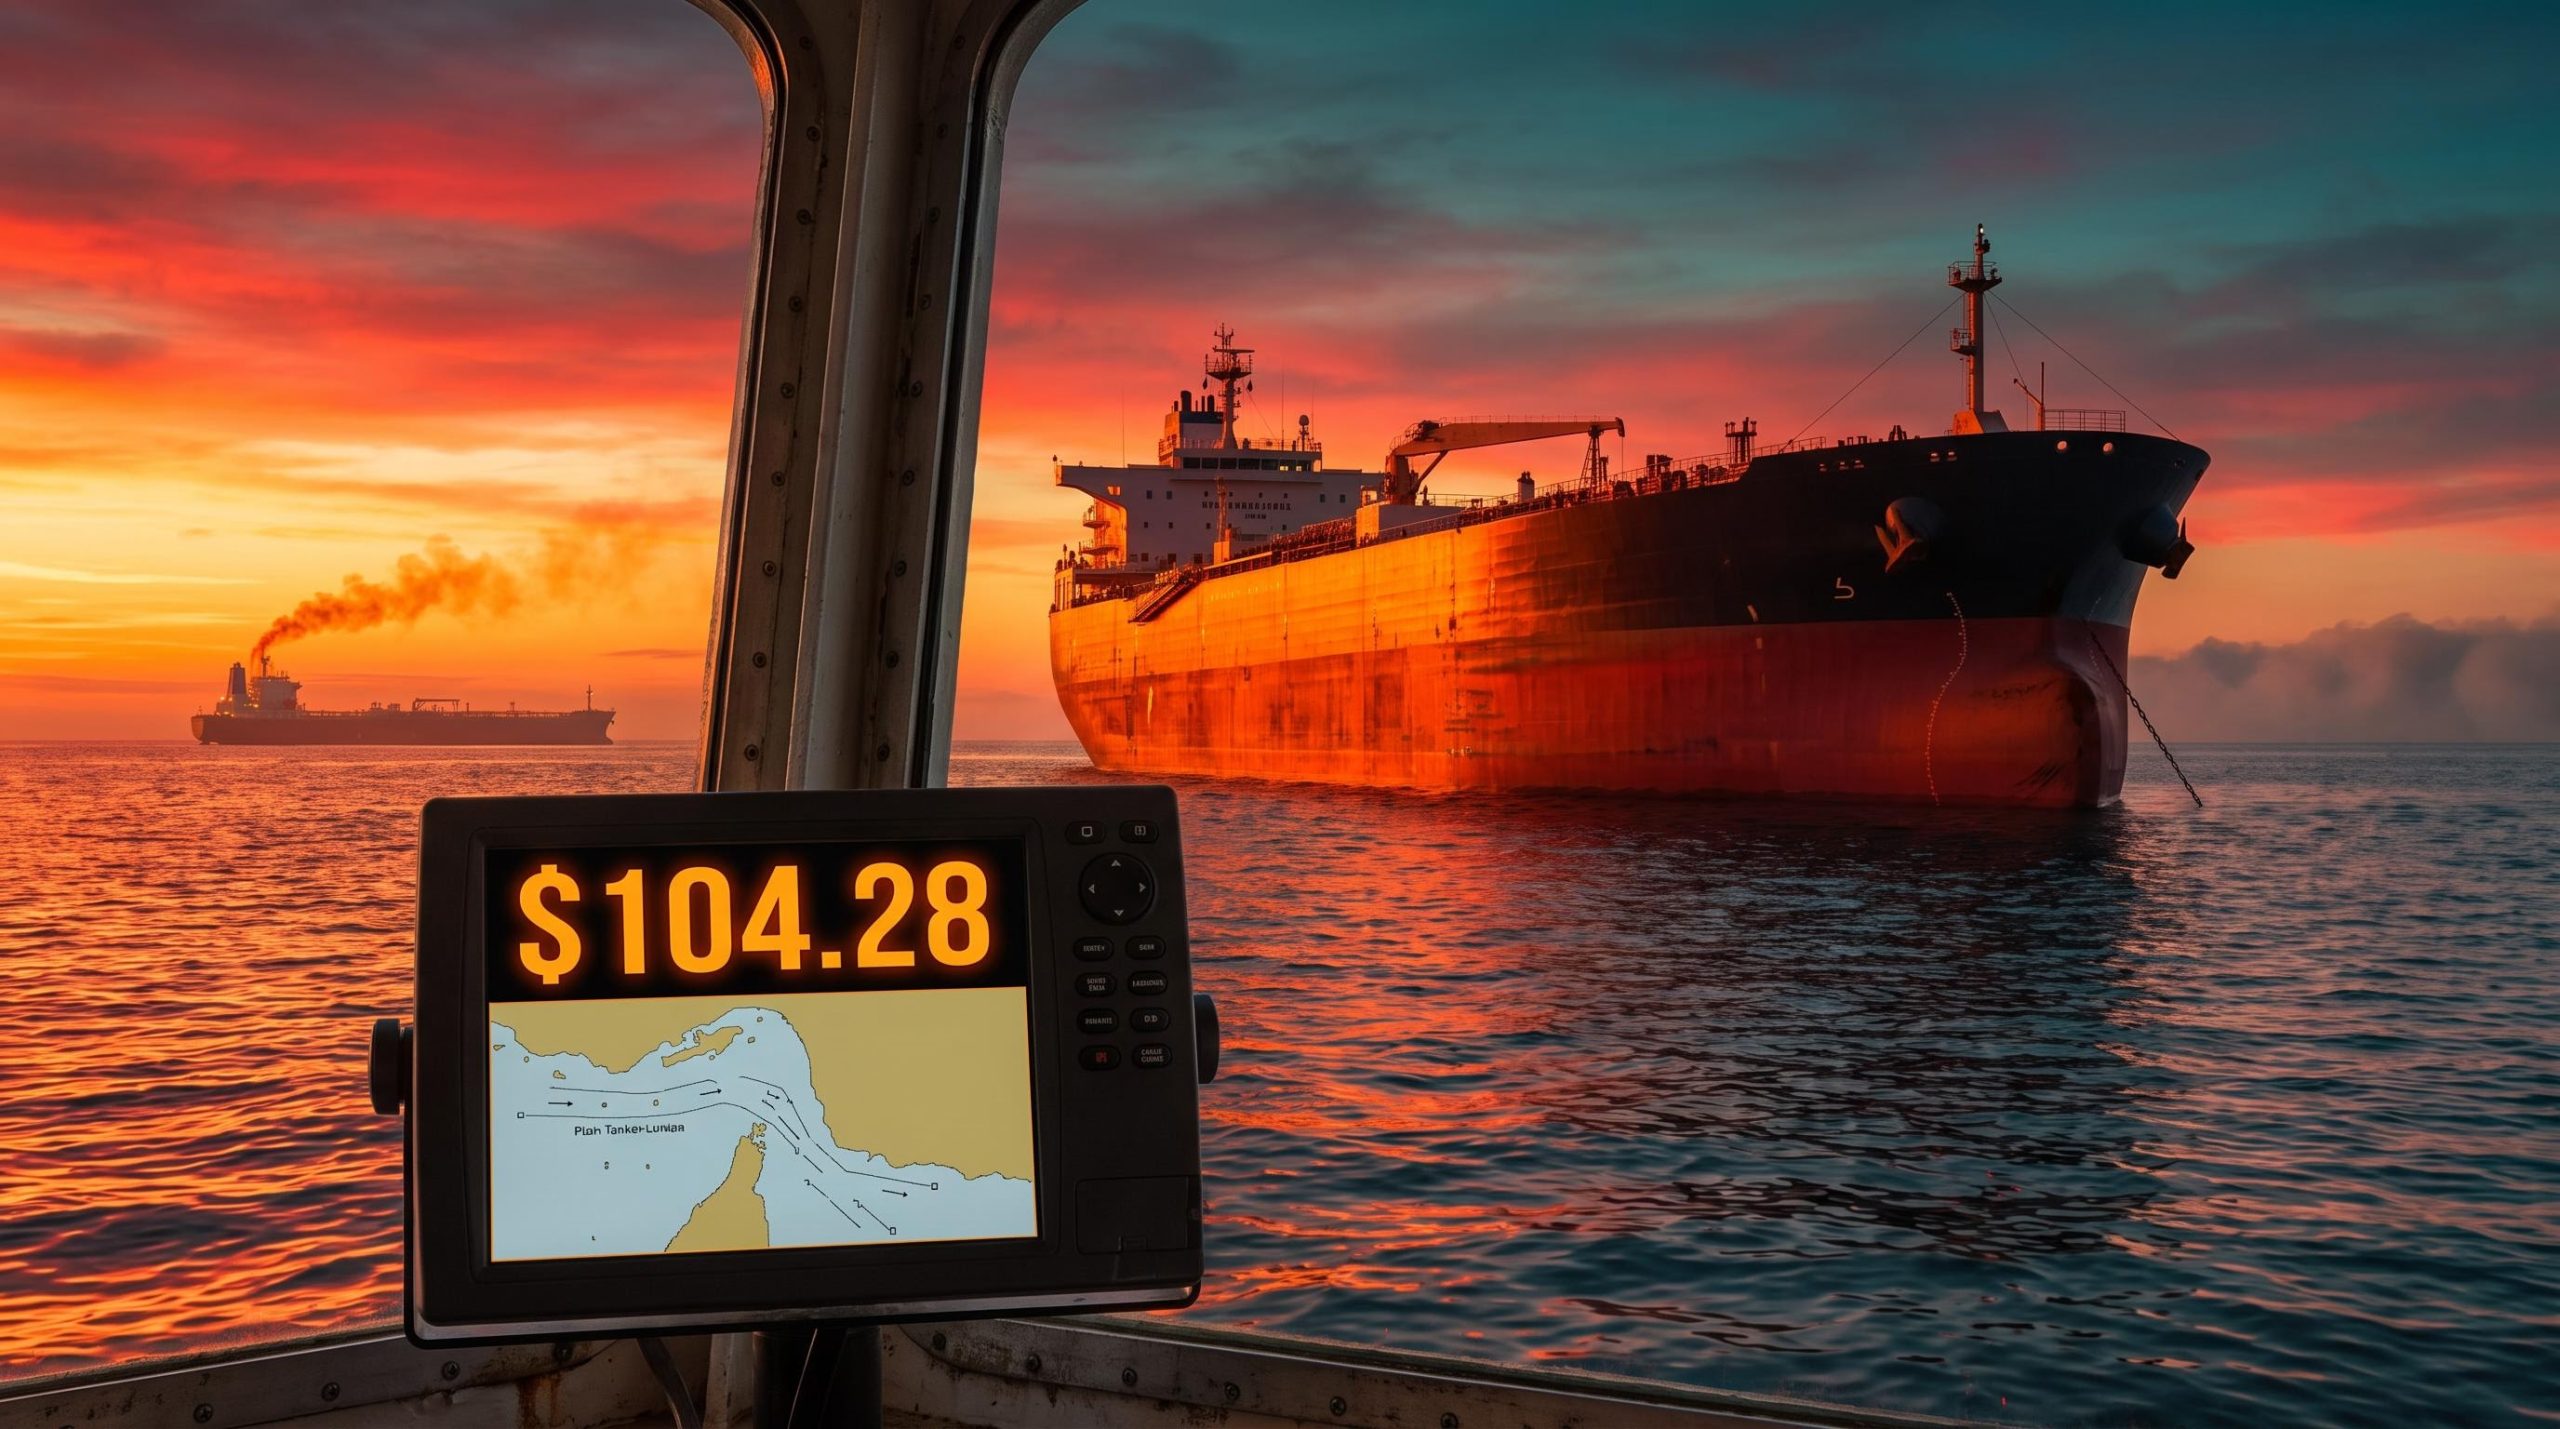
Brent crude settled near $104 a barrel on Thursday after touching about $105.92, its highest level since 29 September. On the screen, that looks like a market running short of oil. The supply data tells a more awkward story: Gulf oil exports excluding Iran recovered to more than 81% of pre-war levels in September, according to Kpler.
That gap is where this oil price spike, and its market impact, gets interesting.
Three pressures hit at once. Tanker attacks around the Strait of Hormuz intensified, fears of US strikes on Iran built, and Hurricane Isaias forced roughly 63% of US Gulf offshore output offline. Prices then pulled back from their peaks after President Donald Trump said the US would not attack Iran before the 3 November midterm elections.
Separating fear from physical scarcity is the most useful thing you can do with a move like this. Here is how a single oil shock travelled through gold, industrial metals, equities, bonds and the ASX, and which signals will tell you whether the premium holds.
Is $100 oil about scarcity or fear?
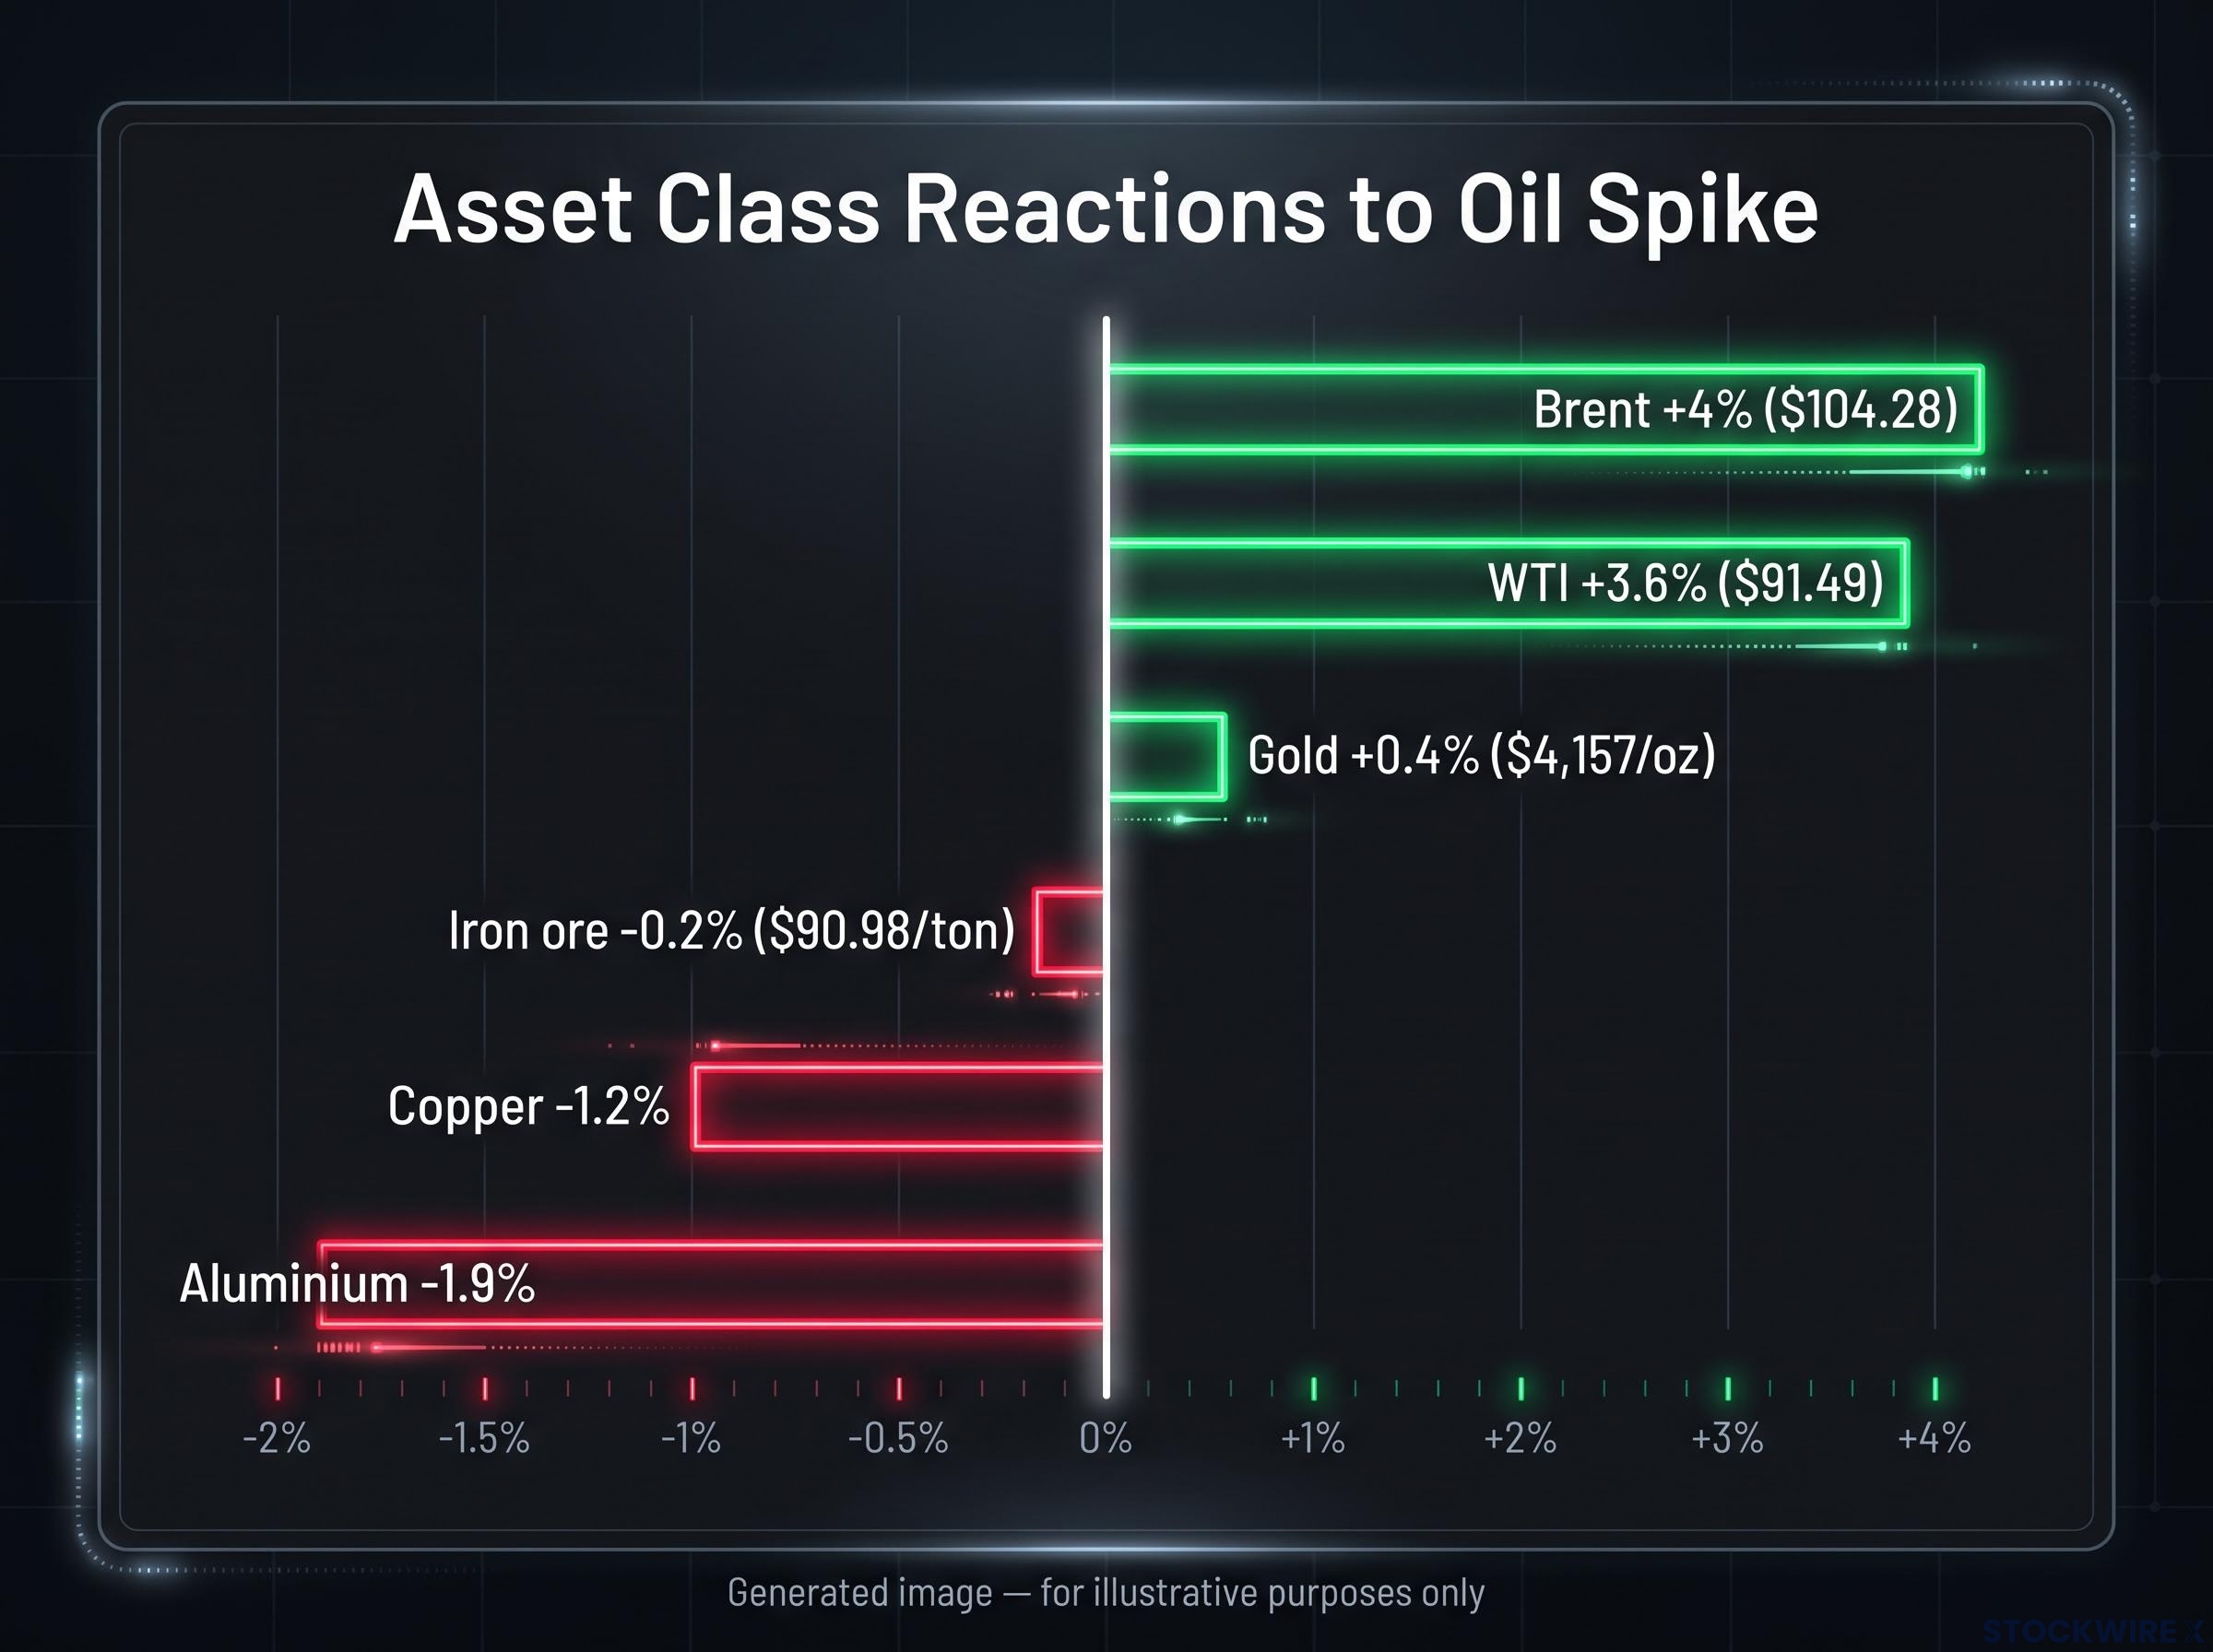
Start with the numbers. Brent futures settled at $104.28, up about 4%, although some reports put the close between $103.77 and $104.11 given the volatility. West Texas Intermediate (WTI), the US benchmark, finished at $91.49, a gain of 3.6%.
| Benchmark | Settle | Intraday high | Change |
|---|---|---|---|
| Brent | $104.28 | $105.92 | About +4% |
| WTI | $91.49 | $93.20 | +3.6% |
| Brent-WTI spread | About $12-13 | Not specified | Widened |
That widening spread matters. Brent prices seaborne crude, so when shipping lanes become dangerous, it pulls away from landlocked US oil.
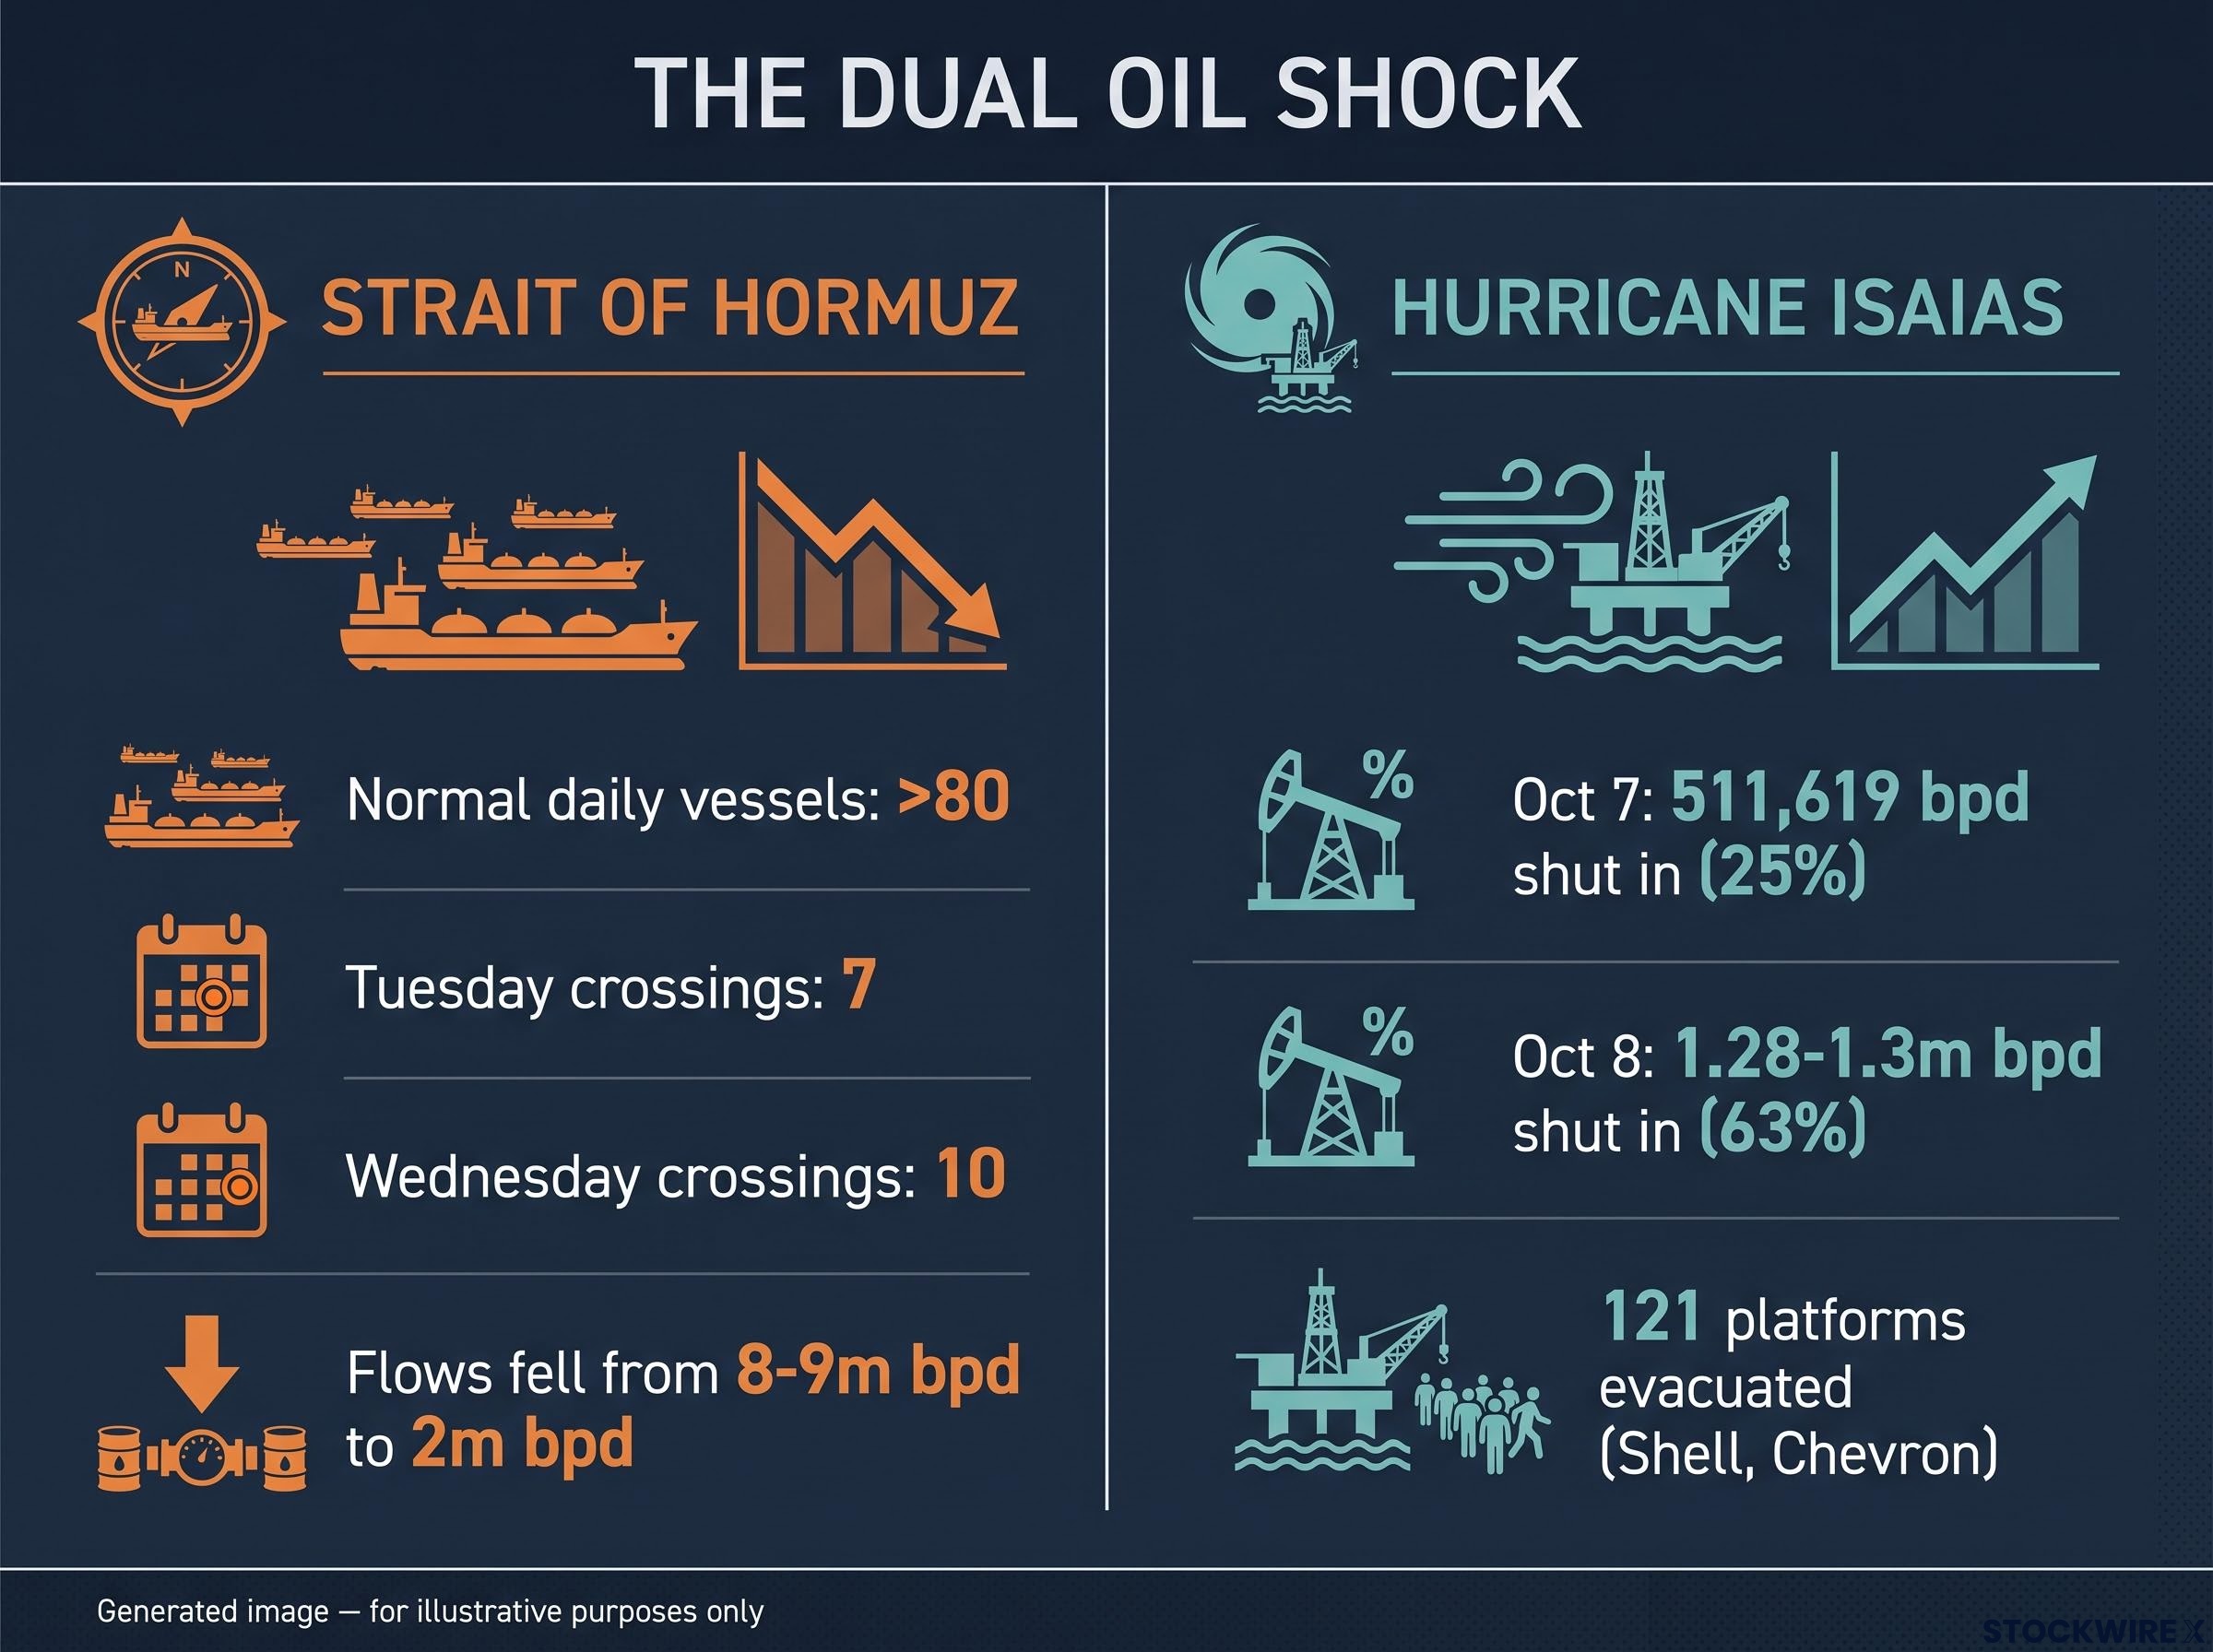
The disruption evidence is stark. Only 7 vessels crossed the strait on Tuesday and 10 on Wednesday, against a normal of more than 80 a day.
Flow collapse Rystad Energy’s Claudio Galimberti said Hormuz flows fell as low as 2 million barrels per day (bpd) after fighting resumed on 30 August, down from 8-9 million bpd the week before.
Attacks have also hit record territory. Marisks, cited by NBC, counted at least 7 tanker incidents in the week to about 5 October, while other maritime intelligence put the figure at 9-13. The VLCC (very large crude carrier) Kazimah III caught fire after being struck by an unknown projectile in the strait.
What the supply data actually shows
Then the resilience evidence arrives. Kpler data show Gulf flows ex-Iran above 81% of pre-war levels in September, with wider Middle East crude exports beating pre-war levels on 14 days. Saudi Arabia kept loading from both its Red Sea and Gulf coasts. The research does not quantify Hormuz’s share of global flows in this episode.
The Wall Street Journal framed the premium as a blend of real interruption risk and doubt over whether restored flows can last. Trump’s pledge only covers the pre-midterm window, and the naval blockade of Iranian exports stays in force.
The retreat after his Truth Social post is your best evidence of how much of the price was premium. A price built on fear can unwind on a single headline.
One way to measure how much of a price is fear is forward curve backwardation, where spot crude trades far above contracts for delivery a year out; a wide gap implies the market expects the premium to fade.
When big ASX news breaks, our subscribers know first
Why a hurricane and a chokepoint hit the same barrel
On a trading screen, both shocks look identical: a green candle on Brent. Underneath, they work on completely different clocks.
What the Hormuz chokepoint is
A chokepoint is a narrow shipping passage that large volumes of trade must pass through, with few alternative routes. The Strait of Hormuz links Gulf producers to world markets, so any threat there affects tankers carrying oil from several countries at once.
Attacks raise prices even when cargo still arrives. Shipowners delay sailings, insurers lift premiums, and buyers pay more to secure barrels they fear may not come. Citing the International Maritime Organization (IMO), CNBC reported 61 commercial ships attacked since 1 March, with at least 17 deaths.
That risk has no end date. It persists as long as the conflict does.
Why storm losses are different
Hurricane Isaias, the first named hurricane of the 2026 Atlantic season, escalated quickly:
- 7 October: 511,619 bpd shut in, about 25% of Gulf of Mexico output, per the Marine Minerals Administration (MMA).
- 8 October: about 1.28-1.3 million bpd shut in, roughly 63% of offshore output, with gas shut-ins near 57%.
- 121 platforms evacuated, including facilities run by Shell and Chevron.
The two figures are not a conflict; they capture different stages of the same storm. Earth Science Associates estimates total losses of about 9-11.2 million barrels, compared with 7.1 million for Tropical Storm Bertha in July.
Once the storm passes, operators return crews and restart wells. The loss is real but bounded. For you, that means the hurricane deserves less weight in any longer view than the Hormuz risk, which is the part capable of keeping a premium alive.
How the shock rippled through gold, metals and the inflation story
Oil did not move alone. The other assets reacted in ways that reveal what investors actually feared.
| Asset | Move | Level | Likely driver |
|---|---|---|---|
| Gold | +0.4% | $4,157/oz | Fed path uncertainty, US debt concern |
| Copper | -1.2% | Not specified | China’s return from holiday, demand worries |
| Aluminium | -1.9% | Three-month low | Industrial demand outlook |
| Iron ore | -0.2% | $90.98/ton | Industrial demand outlook |
| US 10-year yield | Down 5 points | 5.23% | Easing from 24-year highs |
Gold recovered from a two-month low as traders balanced doubts about where the Federal Reserve will take rates against anxiety over the size of US debt. Copper erased earlier gains as China returned from its national holiday, and aluminium touched a three-month low.
Falling industrial metals alongside rising oil is the key signal. Markets were not pricing a growth boom; they were pricing the risk that expensive energy chokes demand.
The bond market sits at the centre of that worry. Standard macro analysis describes the chain like this:
- Higher oil lifts headline inflation and short-term inflation expectations.
- Long-dated yields reprice for expected inflation and a higher term premium (the extra return investors demand for holding longer bonds).
- If central banks look unable to cut rates, policy expectations shift and 2-year yields can rise.
- In Europe, higher energy costs weaken growth and widen deficits in stretched governments, which pressures banks.
That framework is general analysis; the research found no named commentators tying this specific spike to yields. On Thursday, the US 10-year eased to 5.23% and the 2-year slipped 1 point to 4.75%. Both remain high, which tells you the inflation channel is still a live constraint even on a day when yields fell.
Analyst estimates suggest 40-60% of oil price inflation feeds into core CPI over three to six months, which is why elevated yields can persist even on days when bond prices rally.
Stocks, banks and the ASX: who gained and who paid
If oil were a single story, equity indices would have agreed. They did not.
Wall Street
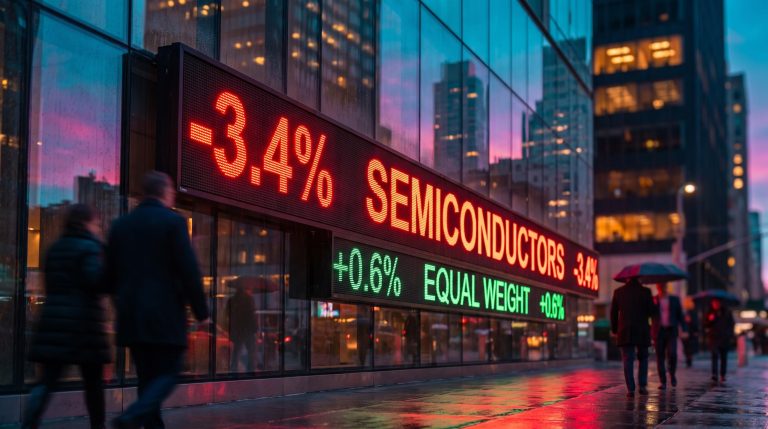
- The Dow rose 0.1%, the S&P 500 fell 0.5% and the Nasdaq dropped 1.3%.
- Energy and consumer staples led; tech and consumer discretionary lagged.
- Oracle fell more than 5%, Nvidia 2.8% and AMD 4%, after unlisted OpenAI said annual revenue to September missed expectations.
- Chipotle rose 6.5% on reports Starbucks explored buying it; Starbucks fell 3.3%.
- PepsiCo gained more than 3.7% on a third-quarter beat, though it flagged slower North American recovery and more cost cuts.
Much of the US divergence came from tech-specific news rather than oil, a reminder that one headline rarely explains a whole session.
Europe
The stress was sharper here. The Euro STOXX 600 fell 0.7% and the FTSE 100 slipped 0.2%.
Where the pressure concentrated French equities lost 0.5%, with the benchmark touching a low not seen for over six months, while European lenders sank to their weakest point in more than three months. Renewed bond selling and costly oil sharpened worries about growth and the swelling French budget deficit.
Australia
- The ASX 200 fell 0.8% on Thursday to about 8,660.90, its second straight decline, with miners and banks weighing.
- Energy stocks hit a two-week high as oil climbed.
- Futures pointed 0.2% higher early on Friday, with no major local data scheduled.
- The Australian dollar sat around 69.6 US cents.
Interpreting this through standard dynamics (no named Australian commentators were found), higher realised prices support producers, while the currency faces a tug of war between terms-of-trade support and risk aversion. Higher fuel costs also feed into CPI, making it harder for the Reserve Bank of Australia (RBA) to separate a temporary energy shock from underlying inflation.
Across all three regions, oil rewarded producers and squeezed rate-sensitive and growth-exposed holdings. Your portfolio’s tilt mattered far more than which way the index closed.
What history and the calendar say about what comes next
Precedent offers two very different endings, and duration decides which one applies.
| Episode | Trigger | Price behaviour | Resolution |
|---|---|---|---|
| 2019 | Gulf tanker incidents | Sharp, episodic spikes | Supply proved resilient; signalling calmed the outlook |
| 2022 | Russia’s invasion of Ukraine | Larger, sustained; Brent well above $100 | Rerouting, demand response, reserve releases, policy action |
| Now | Hormuz attacks, Iran risk, Hurricane Isaias | Above $100 since breaching it on 9 September | Unresolved |
This episode sits between the two, with caveats. Flows have recovered more than in a true 2022-style shock, yet attacks peaked only between 28 September and 4 October, and the blockade remains in place.
Precedent for stocks after oil shocks in 2008, 2011 and 2022 shows below-average S&P 500 returns over the following year, which sharpens the question of how long the current premium lasts.
Offsets exist over time: demand destruction in price-sensitive markets, OPEC spare capacity whose size and speed are debated, and bypass pipelines that limit but do not remove blockade risk. Recent 2026 commentary on these specifics was not found in the research.
Near-term events to watch:
- The preliminary University of Michigan consumer sentiment survey on Friday, which tracks confidence and inflation expectations.
- Delta Air Lines quarterly results, a direct read on fuel costs.
- The start of US earnings season next week, testing record highs set earlier this week.
- EQT Holdings trading ex-dividend; buyers on or after that date miss the upcoming payment.
Specific readings and results were not yet available. The single variable to track is whether Gulf export recovery holds, because that decides whether the premium deflates or hardens.
Past performance does not guarantee future results. Forward-looking views are speculative and subject to change based on market developments.
What the oil shock changes, and what it leaves unsettled
The week’s clearest lesson is that $100 oil was built on fear as much as scarcity. Each asset class responded to a different slice of it: gold and bonds to inflation, industrial metals to growth, and equities to sector exposure.
Four variables now decide the next move. Watch whether Gulf export recovery survives continued attacks, how the blockade and post-midterm policy evolve, how quickly Gulf of Mexico production restarts after Isaias, and where yields settle.
If you are weighing your exposure, the question is less whether oil stays high this week and more which part of the shock your holdings are sensitive to. That answer should guide how much weight you give the next headline.
This article is for informational purposes only and should not be considered financial advice. Investors should conduct their own research and consult with financial professionals before making investment decisions.