On 8 October 2026, the Nasdaq fell 1.25% and the Philadelphia Semiconductor Index dropped about 3.4%. Yet the equal-weight S&P 500, which gives every company the same slice of the index, finished roughly 0.6% higher. The AI chip stock selloff hit the biggest names hard while the typical stock quietly gained.
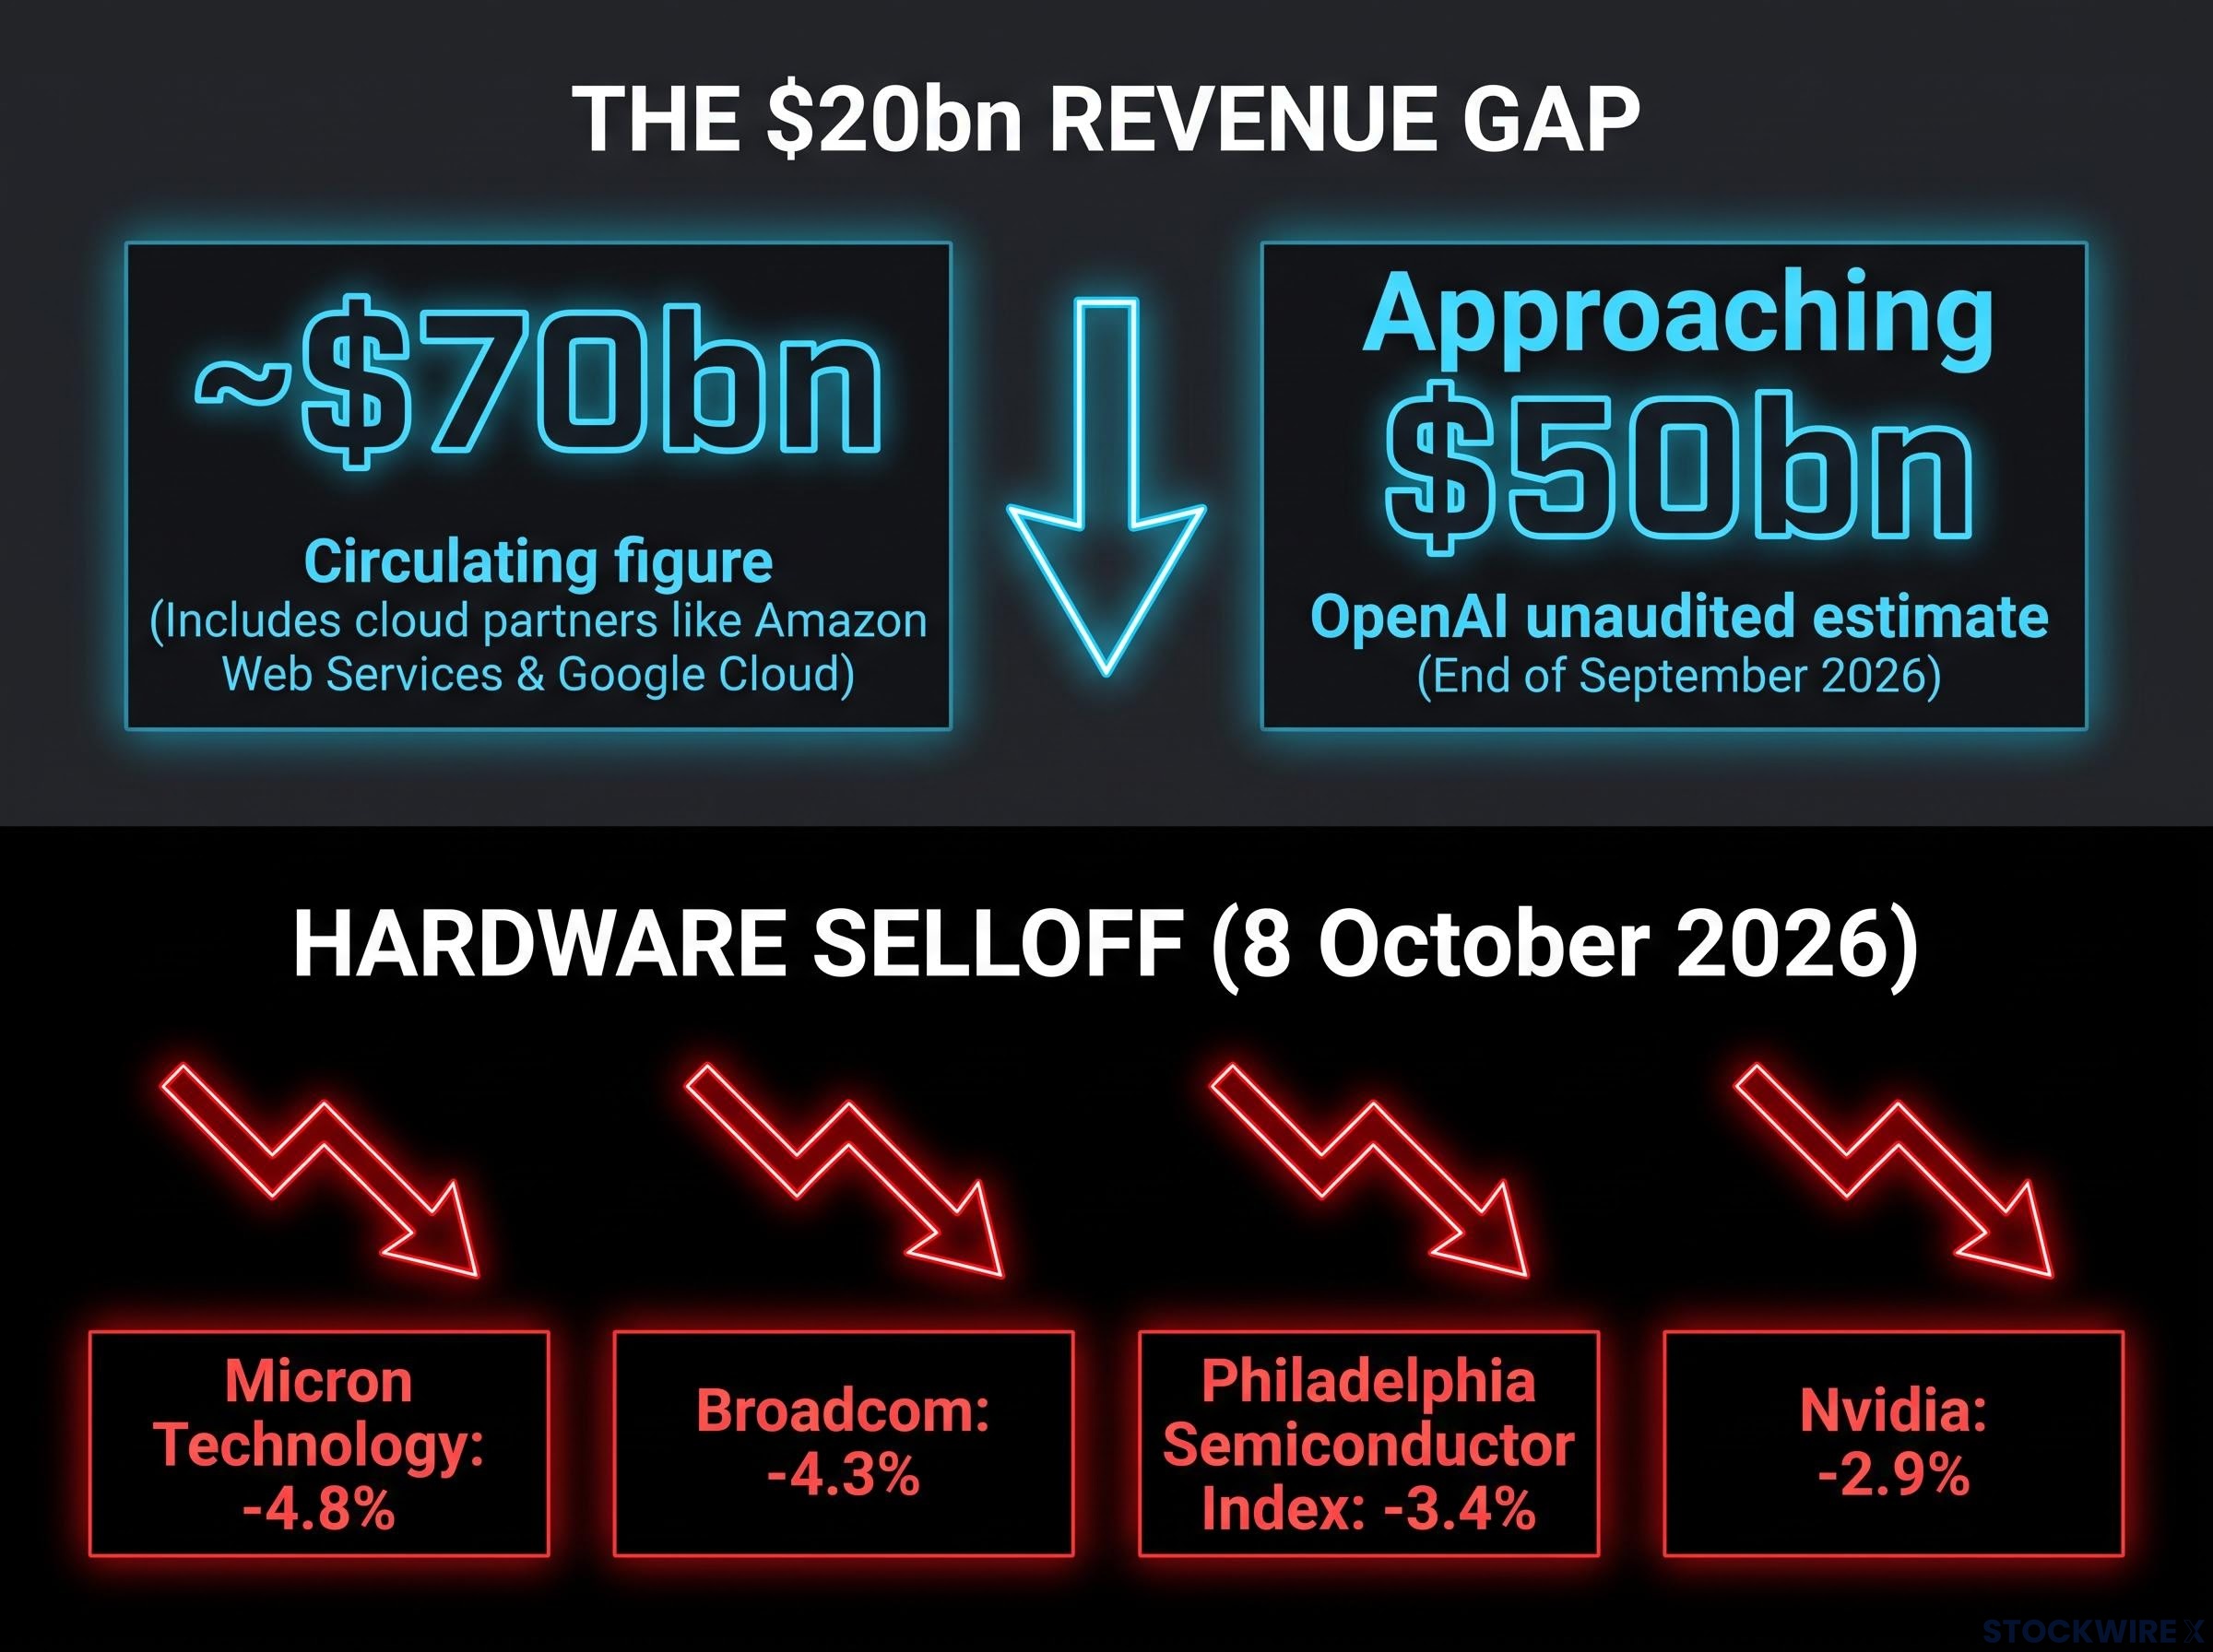
The trigger was a Financial Times report that OpenAI told investors its annualised revenue was “approaching $50bn”. A figure closer to $70bn had been circulating only days earlier.
A private company’s unaudited sales estimate should not, in theory, move public chipmakers by billions of dollars. It did, because a large share of the AI trade rests on assumptions about how fast labs like OpenAI can turn spending into revenue. If your portfolio leans on a handful of AI names, that chain of assumptions is your risk.
Here is why one revenue figure hit semiconductors so hard, and what the gap between the Nasdaq and the average stock says about your own exposure.
Why did a $20bn revenue revision hit chip stocks so hard?
The headline sounds brutal. According to the FT, OpenAI’s annualised revenue was “approaching $50bn” at the end of September 2026, roughly $20bn below the near-$70bn number that had spread through markets. Sources differ on exactly when that higher figure first appeared.
The reported figure TechCrunch, relaying the FT, wrote that the company told investors its annualised revenue is “approaching $50 billion.”
Chipmakers absorbed the blow. The Philadelphia Semiconductor Index closed down 3.4% (some early reports put it at 3.8%), with Nvidia off 2.9%, Micron Technology down 4.8% and Broadcom down 4.3%. High bond yields added pressure, so the OpenAI report was not the only weight on tech.
Why the $70bn and $50bn figures differ
Much of the gap may be definitional. Investing.com attributes it largely to how labs count revenue: Anthropic includes sales made through cloud partners such as Amazon Web Services and Google Cloud, while OpenAI does not. The $70bn figure grew out of investors trying to compare the two directly, which likely overstated OpenAI.
Run-rate numbers can mislead in three ways:
- Definition: what counts as revenue varies between companies, as the cloud-partner difference shows.
- Annualisation: an annualised run-rate is usually one month of sales multiplied by 12, so a single strong or weak month swings the result.
- No audit: for private labs, these figures come from investor materials, not audited accounts prepared under standard accounting rules.
So the revision shrinks from alarming to ambiguous. Yet the market’s reaction still made sense.
The lesson for you is that a headline revenue number is only as reliable as its definition. When an unaudited figure can knock nearly 5% off a major memory maker in a day, it tells you how much AI optimism had been resting on it.
When big ASX news breaks, our subscribers know first
What the Nasdaq and equal-weight S&P 500 split reveals about concentration
The session’s closing numbers tell the story before any commentary does.
| Index | Close | Daily move |
|---|---|---|
| S&P 500 | 7,765 | -0.47% |
| Nasdaq | 27,193 | -1.25% |
| Dow | 51,232 | +0.10% |
| Russell 2000 | 2,794 | +0.03% |
| S&P 500 Equal Weight | n/a | +0.6% |
The arithmetic explains the split. A cap-weighted index sizes each company by its market value, so the largest AI and semiconductor stocks carry outsized influence. When they fall, the index falls with them, even if most members rise.
That is what happened. Information Technology was the weakest sector at -1.78%, while Energy climbed 2.92%, Consumer Staples gained 2.12% and Financials added 0.91%. In the equal-weight measure, those gains outweighed the tech losses.
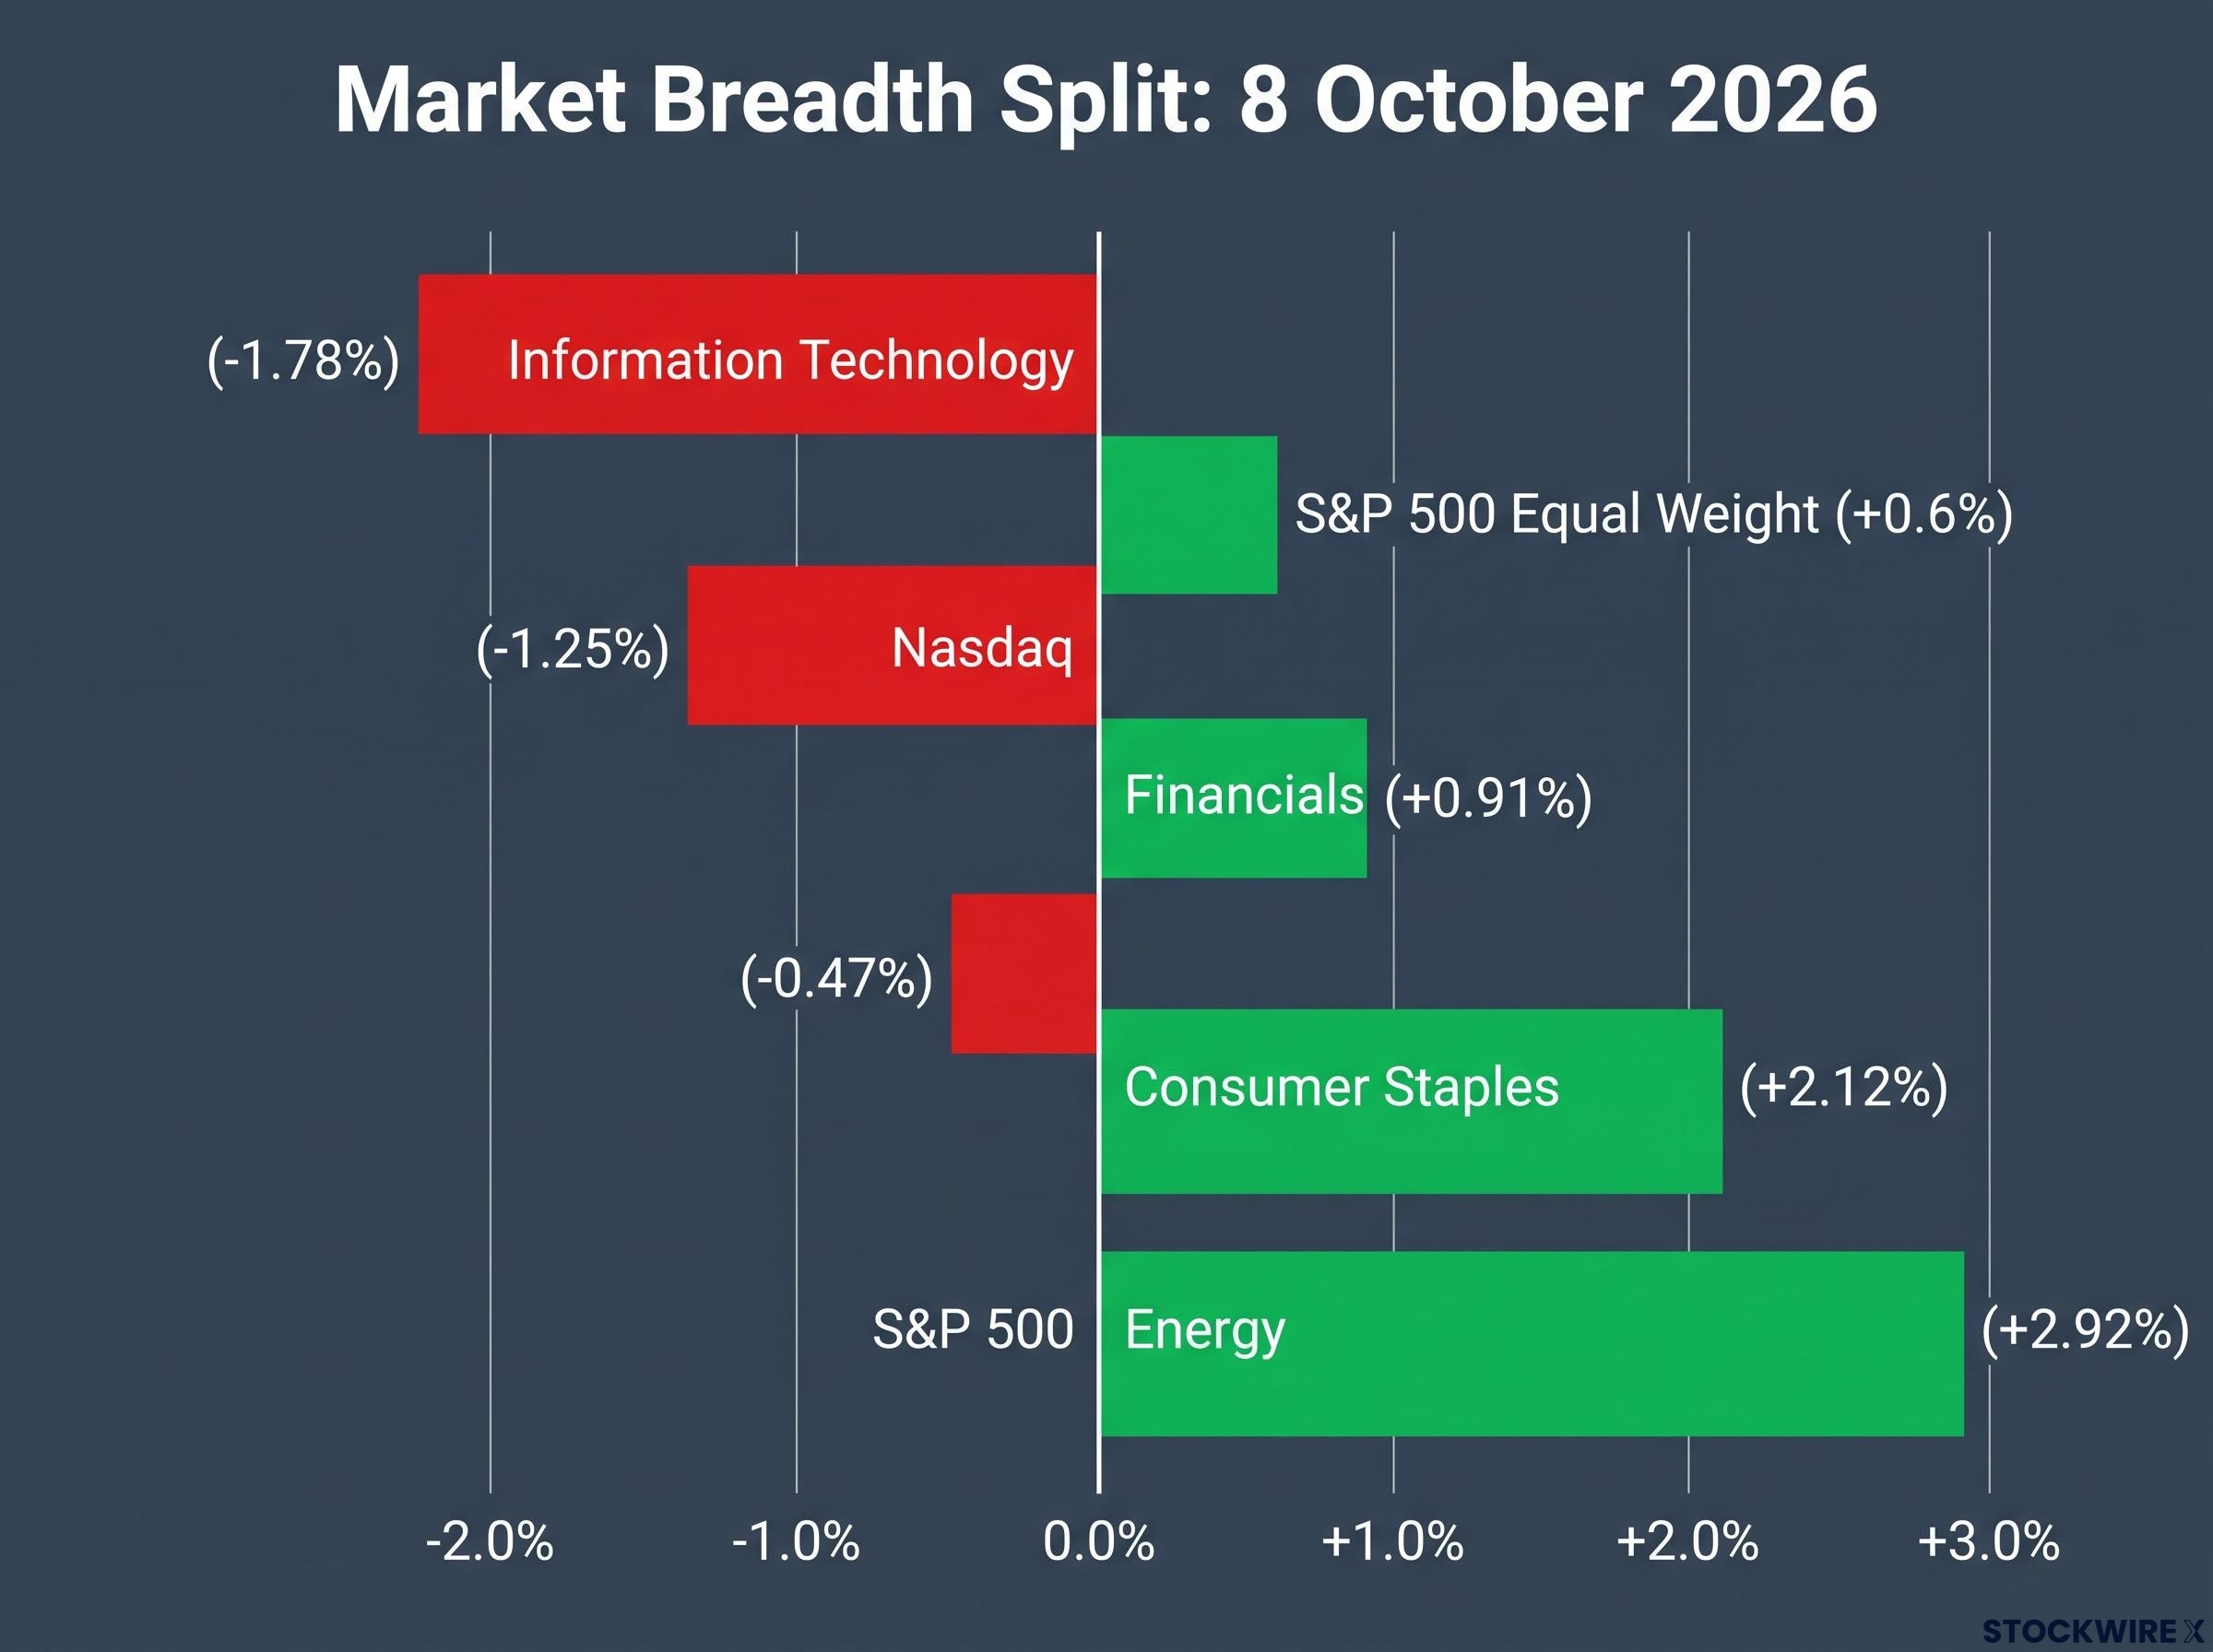
The breadth gap Nasdaq: -1.25%. Equal-weight S&P 500: +0.6%. Same session, opposite directions.
Thematic funds told the same story, with the Robotics & AI ETF down 2.35%. Fear stayed contained: the VIX, a gauge of expected volatility, rose 2.19% to just 15.41.
“The market” did not really fall on 8 October. A narrow leadership group did, and it dragged the headline indices with it.
If your index fund is cap-weighted, you own far more AI and semiconductor risk than the label “diversified” suggests. This session showed the cost of that in a single day, and comparing your cap-weighted and equal-weight exposure is a simple test for hidden concentration.
For passive holders, the hidden AI exposure inside a standard cap-weighted fund can be substantial, since rising prices lift index weights and force further inflows into the very names that sold off on 8 October.
How AI lab revenue feeds chipmaker earnings, and where Palantir fits
Why did chipmakers fall harder than the AI labs’ own partners? Because they sit at the end of a chain of expectations:
- Lab revenue: what OpenAI and Anthropic are expected to earn sets how much compute they can justify buying.
- Cloud capex: those expectations drive data-centre and cloud capital expenditure, meaning spending on long-lived equipment and buildings.
- GPU and memory orders: that spending becomes purchase orders for graphics processors and memory chips.
- Chipmaker earnings: the orders flow through to revenue at Nvidia, Micron and Broadcom.
Mark down the first link by $20bn and every later link gets questioned. A lower revenue base prompts investors to revisit the most aggressive projections for infrastructure returns, and the companies furthest down the chain feel it most. Finimize described the selloff as “centered on AI hardware”, and the losses at Micron (-4.8%), Broadcom (-4.3%) and Nvidia (-2.9%) fit that description.
Because AI lab revenue sets the ceiling for how much compute OpenAI and Anthropic can justify buying, a single downgraded run-rate figure forces investors to revisit every later link in the spending chain.
Palantir and the application-layer contrast
Software tells a different story. Goldman Sachs analyst Gabriela Borges upgraded Palantir from Neutral to Buy with a 12-month price target of $230, a call first reported by Pluang on 24 September and cited again in 8 October commentary.
Borges pointed to growing demand for sovereign AI (systems built for national governments) and custom applications, which widens Palantir’s addressable market across government, defence and enterprise work. That kind of demand looks less tied to hyperscaler capex than GPU sales do.
One upgrade is not proof of insulation, though, and no closing move for Palantir on 8 October is available.
The broader point is that “AI exposure” is not one bet. Owning chips, cloud and software means holding three different sensitivities to the same revenue headline, so it pays to know which layer you actually depend on.
Healthy reset or the start of bubble deflation?
The optimistic camp has a clean argument. The $70bn figure was an overextrapolation built on mismatched definitions, and Finimize framed the session as the market “repricing” OpenAI’s revenue talk. On this view, AI demand stays strong, and valuations simply anchor to more conservatively defined revenue.
The sceptics see something deeper. Commentator HedgieMarkets argued on X that private labs have grown “too comfortable grading their own homework”, noting the revision surfaced while OpenAI was reportedly discussing a valuation near $1.4tn. That claim is unverified, but it frames the risk clearly: audited numbers may disappoint once they arrive.
| View | Core argument | Supporting evidence | Key risk |
|---|---|---|---|
| Healthy reset | The earlier figure was overextrapolated; demand remains intact | Cloud-partner counting gap; Finimize “repricing” framing | Conservative figures still prove too generous |
| Bubble deflation | Unaudited metrics have inflated valuations | Unverified reports of a ~$1.4tn valuation discussion | Relies on commentary and unconfirmed claims |
The uncomfortable truth is that neither side can settle this yet. The data is private and unaudited, high yields muddied the session, and there are no well-sourced precedents in the available evidence to lean on. Gold’s 0.54% rise to $4,133.12 and a 1.5% gain in gold miners hint at defensive positioning, but one session proves little.
The signals that would decide it:
- Audited financial disclosures from private AI labs
- Clearer, consistent definitions of reported revenue
- Hyperscaler commentary on capex plans
- The direction of Treasury yields
Treat one session as a prompt to stress-test your AI exposure, not a verdict on the AI trade in either direction. These statements are speculative and subject to change based on market developments and company performance.
What the breadth gap means for your AI exposure from here
A single, methodology-sensitive revenue figure exposed how concentrated both index weights and AI expectations had become. The chipmakers fell hardest because they sit at the end of the spending chain, while the average stock rose.
Your decision points are practical. Check how much of your index exposure is cap-weighted, identify which layer of the AI stack you actually hold, and watch for audited disclosures, revenue definitions, hyperscaler capex guidance and yields.
Steady capex commentary and clearer revenue reporting would support the reset reading. Weaker audited figures or capex cuts would point to a deeper unwind.
Either way, the takeaway holds: know what you own before the next headline tests it.
Investors weighing chips, cloud and software will find our comprehensive walkthrough of choosing an AI layer sets out the risk profile of each segment.
This article is for informational purposes only and should not be considered financial advice. Investors should conduct their own research and consult with financial professionals before making investment decisions. Past performance does not guarantee future results.