
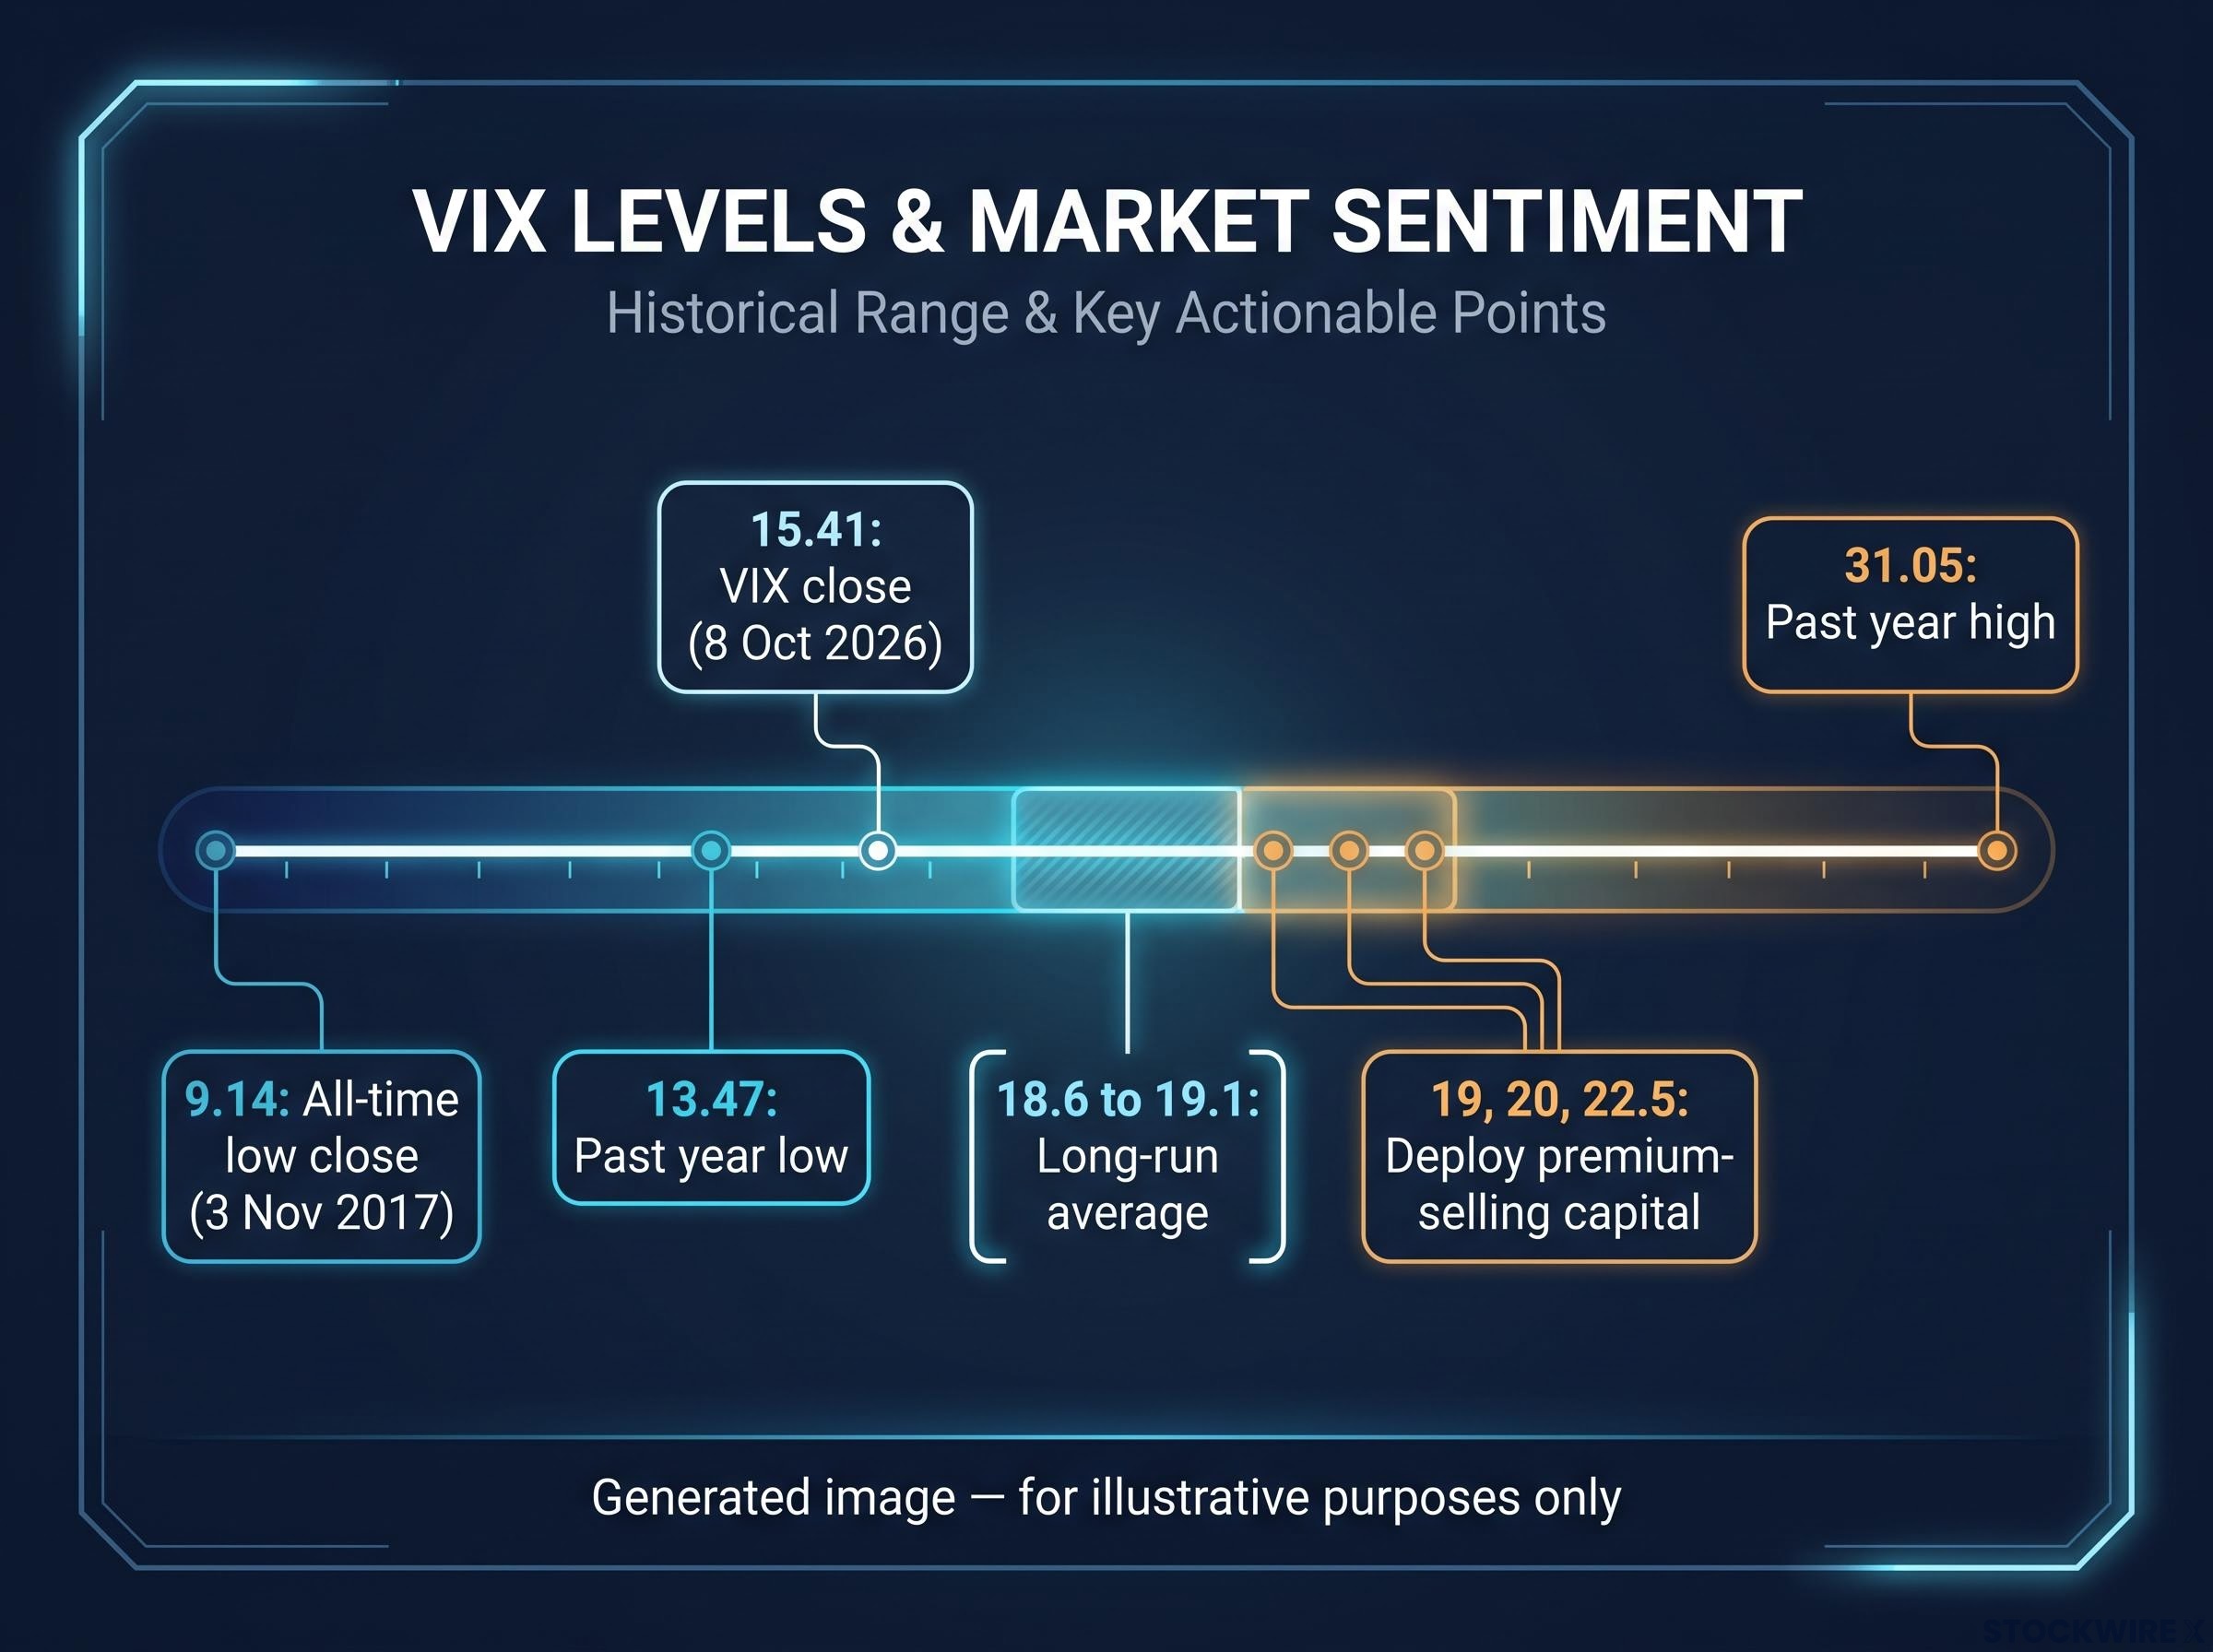
The VIX closed at 15.41 on 8 October 2026. For anyone who earns a living selling options premium, a reading that low often means one thing: sit on your hands. Waiting can be a sound choice, but it is not the only option strategy available when volatility is low.
That number sits well below the long-run average of roughly 18.6 to 19.1. It also sits below the levels where premium-selling research suggests committing more capital. If your approach depends on collecting premium, you are working with a thinner edge than usual.
So the useful question is not whether to trade. It is what to do instead, and what to avoid while the market stays calm.
Here is how to screen for low-IV candidates, how one defined-risk structure improves on a plain long call, and why defined risk should be your default while you build experience.
Why does low volatility change which options strategies make sense?
You have probably heard the rule that selling premium works best when volatility is high. To use that rule well, you need to understand why it holds. Once you see the reason, you also see why it reverses when the market goes quiet.
What implied volatility measures Charles Schwab describes implied volatility (IV) as a collective, indirect estimate of future volatility, drawn from current option prices and expressed as an annualised figure. The VIX applies the same idea to the S&P 500.
Because every option price on your chain is built from implied volatility, a single number extracted from live market prices, a change in that figure reshapes your delta, theta and probability readings all at once.
Two forces favour sellers when IV is elevated. The first is the volatility risk premium, which is the tendency for implied volatility to run above the volatility that actually occurs. The second is mean reversion: IV often overshoots after a spike and then drifts back down, so a seller can profit from both time decay and the return to normal levels.
To judge whether IV is high or low for a particular stock, traders use IV Rank. IV Rank takes current IV, subtracts the 52-week low, and divides the result by the 52-week range. The answer is scaled from 0 to 100. Under tastytrade practice, an IV Rank above 50 is a common threshold for selling premium.
When IV is low, that logic runs in reverse. Options are cheap compared with their own history, and sellers collect less for taking the same risk. Over the past year the VIX has traded between 13.47 and 31.05, and today’s reading sits much closer to the bottom of that band.
| Attribute | High-IV regime | Low-IV regime |
|---|---|---|
| Typical IV Rank | Above 50 | Near the low end of the 0-100 scale |
| Option pricing vs history | Rich | Cheap |
| Favoured side | Short premium | Long premium, defined risk |
| Example structures | Short strangles, credit spreads | Debit verticals, calendars, diagonals |
The tastytrade presenter whose walkthrough informs this piece suggests deploying more premium-selling capital when the VIX reaches around 19, 20 or 22.5. A mid-teens VIX means the market is paying sellers less than its usual rate for carrying risk. Stepping back or changing your approach is a reasoned response to that, not timidity.
Keep one caveat in mind. IV Rank looks backwards and depends on the window it measures. A single spike can distort it, and so can an unusually quiet year. Low IV does not mean an option is safe, and it says nothing about which way the price will move. The VIX’s all-time low close of 9.14, on 3 November 2017, shows how far “quiet” can go.
IV Rank versus IV Percentile
IV Percentile counts how many days over the past year IV was lower than it is now. IV Rank reacts faster to new extremes. IV Percentile holds up better when one outlier spike would otherwise skew the reading.
Schwab gives an example: an IV Percentile of 33% means current IV sits in the lowest third of the past 52 weeks. Schwab sometimes uses the two terms interchangeably, so check how your own platform defines the number you are looking at.
When big ASX news breaks, our subscribers know first
How do you find low-IV candidates on a watch list?
Once you understand IV Rank, you can turn it into a screen. IV Rank covers the past 12 months, so a reading near zero means volatility is low compared with that stock’s own range. That makes the sort order the place to begin.
- Build a watch list or choose an existing one. The tastytrade default list is a reasonable starting point.
- Sort by IV Rank from low to high. On tastytrade, you click the column header once to sort and again to reverse the order.
- Check every candidate for earnings dates and other scheduled events.
- Review liquidity and the price chart.
- Decide which direction you want to take.
You may expect the share price to matter, but when your risk is defined it largely does not. In the walkthrough, Bank of America at about $52.50 and SanDisk at roughly $1,600 per share were both treated as workable candidates. Your maximum loss comes from the structure you build, not from the stock’s price.
The Bank of America example came with a flag. Its earnings were only a few days away, and the presenter set that aside purely to demonstrate the method. In a live trade, you should not ignore it.
The reason is IV crush, which is the sharp fall in implied volatility once an uncertain event such as earnings has passed. IV crush can wipe out much of a long option’s value even when the stock moves in your favour.
A low reading is not a forecast IV Rank tells you how cheap an option is. It does not tell you which way the stock will move.
A low IV Rank means an option is cheap compared with that stock’s own past, not cheap in absolute terms. Treat your sorted list as a shortlist to investigate, not a list of trades to place.
For readers wanting to match structures to conditions asset by asset, our full explainer on choosing strategies by IV regime shows why a low headline VIX can coexist with very high single-stock IV.
How does a long vertical spread improve on a single long call?
Suppose your screen has given you a candidate and a directional view. The obvious move is to buy a call. Before you do, compare it with a long call vertical, also called a debit spread. You buy a call near the money and sell a higher-strike call against it, with the two strikes usually sitting either side of the current price.
Here is an illustrative example, not a recommendation. A stock trades at 100 with 60 days to expiration.
| Metric | Single 100 call | 100/110 vertical |
|---|---|---|
| Cost | 4 | Net 2 (buy at 4, sell at 2) |
| Max loss | 4 | 2 |
| Max profit | Unlimited | 8 |
| Breakeven | 104 | 102 |
| Vega | Relatively high | Lower |
| Theta | Full decay exposure | Lower net decay |
The vertical costs half as much, so its maximum loss is half as large. It also breaks even two points sooner. Vega, which is an option’s sensitivity to changes in implied volatility, drops because the short call offsets part of it. That matters if IV slides even lower after you enter the trade.
The Bank of America walkthrough shows the same pattern with real numbers. A long 50 call on its own showed roughly a 40% probability of profit and about -$2 per day of theta, which is the value an option loses each day as time passes. The 50/55 vertical moved closer to 50/50 odds and cost about half the width between the strikes.
Theta does not disappear. The short call’s positive theta offsets the long call’s decay, which left the spread close to neutral in that example. The balance shifts as the stock moves, though, so think of the decay as much lower, not eliminated.
How your spread behaves also depends on how delta changes as the stock moves and expiration nears, which is why the balance between the long and short call shifts over the life of the trade.
The presenter treats direction as largely random. This structure is a simple directional bet that does not need volatility to expand. With a vertical, a wrong guess costs you half as much and the trade breaks even sooner, which lets you take directional views in a quiet market without paying full price for time decay.
What you give up
Your profit is capped at 8. If the stock goes nowhere, theta still works against you. Long options can expire worthless when realised volatility stays low, so expect smaller wins alongside the smaller losses.
Calendar and diagonal spreads are two other defined-risk choices for low-IV conditions, and they benefit more directly when volatility rises. Both are worth studying once verticals feel familiar.
Why should beginners stay with defined risk for months, not weeks?
After a few winning verticals, you may feel ready to sell naked options or increase your size. Hold that impulse a little longer.
Defined risk caps your loss before you enter. On a debit spread, the most you can lose is the net debit you paid. On a credit spread, it is the width between the strikes minus the credit you received. That makes position sizing a matter of simple arithmetic rather than guesswork.
Broker and regulator education, including material from the OCC, FINRA and the SEC, generally encourages new traders to start with defined-risk positions. The common mistakes explain why:
- Selling naked options without understanding margin or how large a loss can get
- Oversizing positions
- Ignoring theta when buying out-of-the-money options
- Trading through earnings without understanding IV crush
- Having no exit rules and no awareness of assignment risk
One educator’s view The tastytrade presenter’s personal opinion is that new traders should stick to defined risk for roughly 3 to 6 months, and possibly a year or more, so they experience a range of market conditions.
The point is repetition across several stocks and indexes. Defined risk means you know the worst outcome of every trade before you place it, so you can learn from mistakes without any single error ending your account.
What a quiet VIX does and does not ask of you
Low volatility shifts the edge away from selling premium and towards buying defined-risk structures selectively. It does not remove the need for judgement, careful sizing or attention to earnings.
The three working pieces fit together. Read IV Rank as a measure of relative cheapness. Screen your list, then check every candidate for scheduled events. Use verticals to reduce your cost and your exposure to time decay.
Volatility regimes change. If the VIX climbs back towards 19 to 22.5, that is your cue to look at premium selling again.
A practical next step is to sort your watch list by IV Rank tonight and paper trade a vertical before you commit real money.
This article is for informational purposes only and should not be considered financial advice. Options involve risk and are not suitable for every investor. Investors should conduct their own research and consult with financial professionals before making investment decisions. Past performance does not guarantee future results.