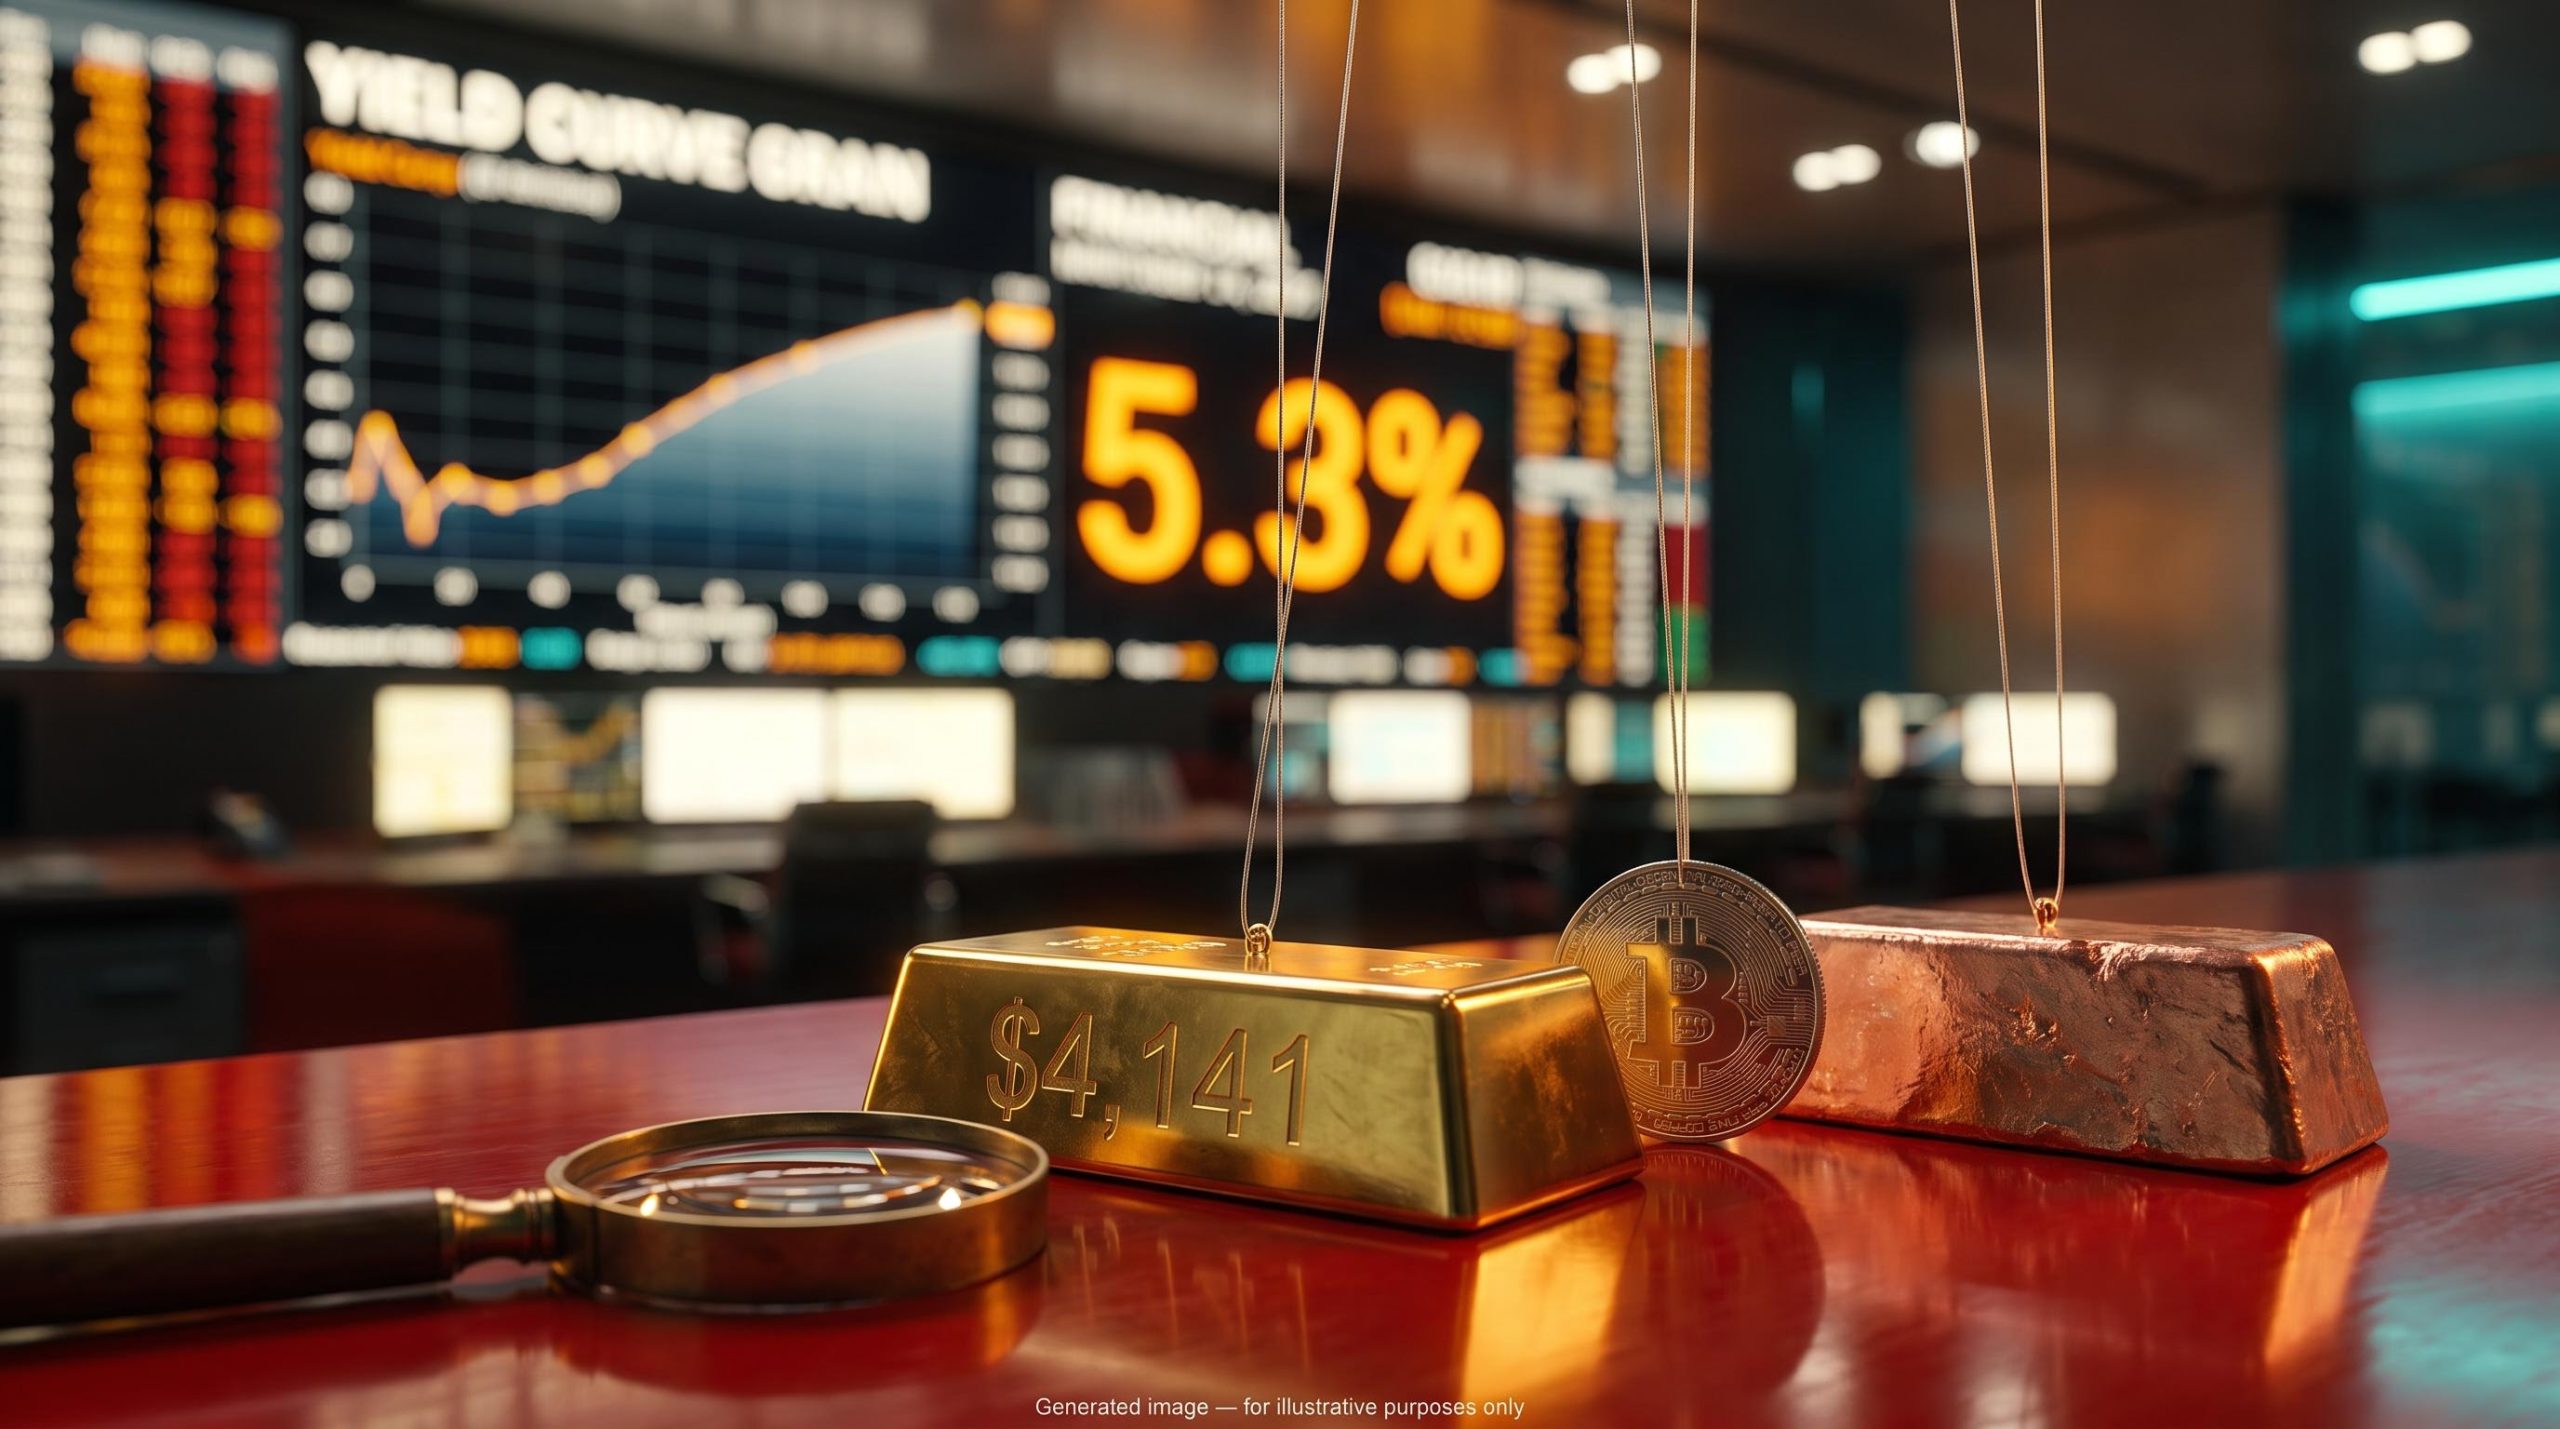
The standard advice says bonds cushion stocks and gold cushions everything. On 8 October 2026, that advice faces a hard test. The 10-year Treasury yield sits near 5.3%, the 30-year near 5.67%, and the S&P 500 still trades around 7,800.
There is a less comfortable signal underneath those numbers. Many of the assets investors hold as hedges are priced against the same variable, which is equities.
When high yields, stretched valuations and weak breadth arrive together, a stock market drop does not stay in stocks. It can pass through to bonds, gold, copper and crypto in different and sometimes surprising ways.
Bloomberg Intelligence strategist Mike McGlone offers the sharpest version of the bear case. This piece tests his view against history and against credible opposing arguments.
You will come away with a working framework for how correlation, volatility and late-cycle risk shape each asset’s behaviour under equity stress. You will also be able to tell which parts of the bear case rest on evidence and which rest on one analyst’s opinion.
Why yields above 5% and stretched stocks make this a late-cycle setup
Where yields and prices stand
Start with the bond market. Coverage on 8 October puts the 10-year in the 5.30-5.35% range and the 30-year at roughly 5.67-5.70%. Charles Schwab noted that a strong 10-year auction briefly eased the sell-off.
The sources disagree on how far back these levels reach. Schwab describes both yields as the highest since 2002, while a Reuters report from 25 September tied an earlier 30-year peak to June 2004. Either way, long-term borrowing costs are at levels last seen two decades ago.
Coverage cites four drivers: sticky inflation, heavy Treasury issuance to fund deficits, Federal Reserve officials suggesting more tightening may be needed, and rising energy costs.
| Asset or measure | Latest level | Note |
|---|---|---|
| 10-year Treasury yield | 5.30-5.35% | Highest since 2002 or 2004, depending on source |
| 30-year Treasury yield | 5.67-5.70% | Second straight day of selling |
| S&P 500 | ~7,802 | Down 0.22% intraday (Schwab) |
| Gold | ~$4,141 | Up 2% over one year (McGlone) |
| Bitcoin | ~$82,167 | Down 32% over one year (McGlone) |
By McGlone’s count, the S&P 500 has delivered a 17% total return over the same year. So the hedges have not hedged. Stocks have carried the portfolio.
What valuation and breadth are signalling
The second layer is valuation. McGlone puts the US stock market at about 2.5 times GDP, or roughly $82 trillion, and he calls that the highest reading in a century. On his maths, a 20% S&P drop would erase wealth equal to about 50% of GDP.
Breadth tells a thinner story than the index does. Market breadth measures how many stocks are taking part in a move. MarketWatch found that more than 40% of S&P 500 stocks trade at least 20% below their 52-week highs, while AI-linked mega-caps hold the index up.
That leaves McGlone’s interpretation, which he presents as a familiar late-cycle policy error.
Mike McGlone, Bloomberg Intelligence Surging yields are “breaking markets”, and nearly every asset class has become one of the stock market’s “stock puppets”.
The valuation and performance figures are McGlone’s own and have not been independently verified. Treat them as one analyst’s framing of the data rather than settled fact.
The direction of the argument still holds up. Rich valuations and a higher risk-free rate leave the market little room for disappointment. That is why you should treat equity risk as the driver of the rest of your portfolio, not as one holding among many.
When big ASX news breaks, our subscribers know first
How correlation and volatility link bonds, gold, copper and Bitcoin to stocks
Why hedges can fall together
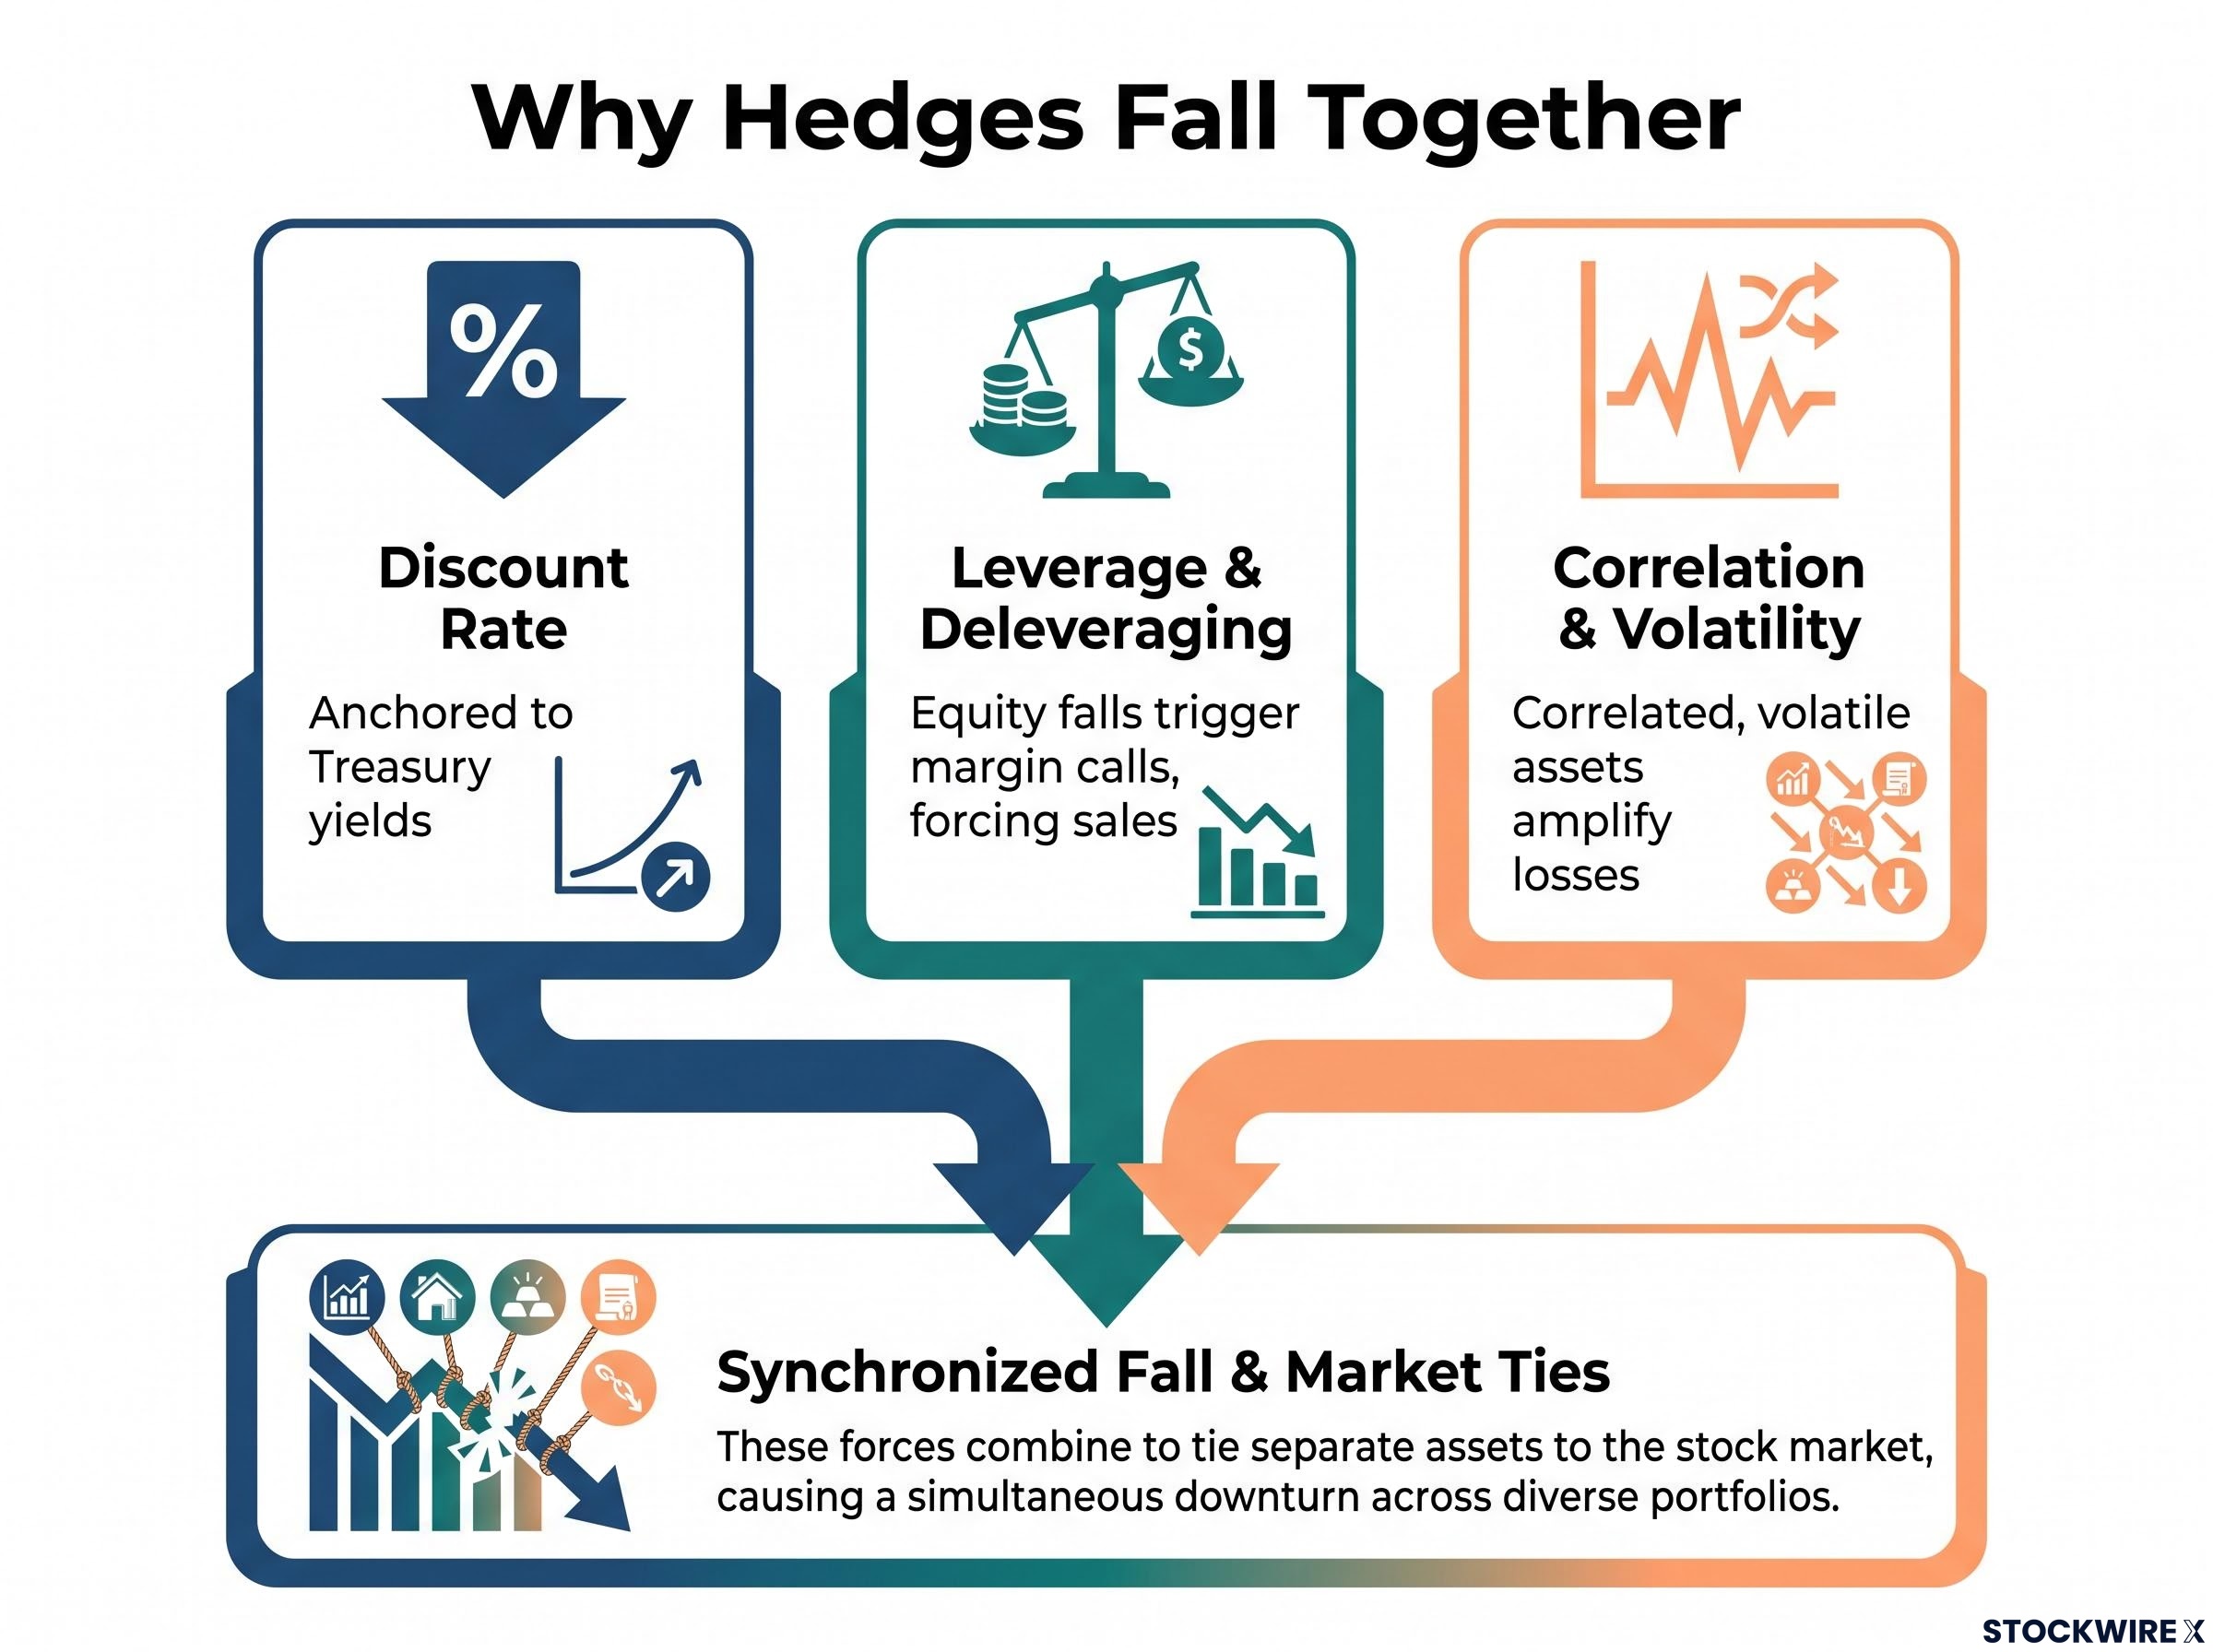
Most investors think of these assets as separate shelters. When stocks fall, bonds rise, gold shines, and Bitcoin goes its own way. In practice, three channels tie them together:
- Discount rate. A discount rate is the return investors require to hold an asset, and it is anchored to Treasury yields. When yields rise, the present value of future cash flows falls, so growth stocks lose value first. Gold becomes more costly to hold because it pays no income, and speculative assets face higher funding costs.
- Leverage and deleveraging. Late in a cycle, many investors hold stocks, commodities and crypto using borrowed money. A sharp equity fall triggers margin calls, which are demands from lenders for more cash. Investors meet them by selling whatever they can, including their hedges.
- Correlation and volatility. Correlation measures how closely two assets move together. Volatility measures how sharply an asset’s price swings. A hedge that is positively correlated with stocks and highly volatile will amplify your losses instead of offsetting them.
Why Bitcoin is expected to lag gold
McGlone’s “stock puppets” idea follows from the third channel. He argues Bitcoin behaves as a high-volatility proxy for equities. It has underperformed the market over one, two and five years while carrying about three times the market’s volatility, and he reads its weakness as a leading indicator for stocks.
Gold, in his view, is the stronger of the stock-correlated assets. That does not make it calm. McGlone puts gold’s volatility at 2.2 times the stock market’s, the highest in 20 years, with the Bloomberg precious metals index near 2.4 times, close to its 2006 peak. He also puts copper’s volatility relative to the S&P at a record 0.65 over 50 days.
His scenario figures, which are his estimates rather than forecasts, are:
- Bitcoin: a fall of nearly 50% if the S&P 500 drops 10-20%
- Copper: a fall of about 20% if the S&P 500 drops 10%
Gold’s recent week shows the real-yield pressure at work. According to CapitalStreetFX, it fell 3.3% to $4,142.75 even as the odds of an imminent Fed hike collapsed. The lesson for you is that gold’s resilience is relative. How well it holds up depends on what real yields, meaning yields after inflation, do next.
Gold’s resilience is relative, and crisis type matters: it fell roughly 12% in both March 2020 and March 2026 during liquidity-driven selloffs, when forced selling, rising real yields and a stronger dollar all coincided.
What past equity drawdowns suggest, and where the pattern breaks
If correlation shifts under stress, history should show when hedges have held and when they have failed. Taken in order, the major episodes point to one rule: the cause of the drawdown decides the outcome.
| Episode | Equities | Bonds | Gold | Crypto |
|---|---|---|---|---|
| 1987 crash | Collapsed after rising yields and technical selling | Initial stress, then rallied | Modest move | Not available |
| 2000-02 tech bust | Overvalued tech deflated | Strong long-Treasury returns | Multi-year bull market began | Not available |
| 2008 financial crisis | Fell amid forced deleveraging | Rallied sharply | Fell, then outperformed | Not available |
| 2022 inflation shock | Fell | Long bonds fell too | Roughly held value | Bitcoin fell far more than gold |
In 1987, rising yields stressed stocks and bonds together before bonds recovered as recession fears grew. In 2000-02 and in 2008, slowing growth sent investors into Treasuries, although 2008 first forced a broad sell-off as leveraged investors unwound their positions. Crypto data does not exist for these earlier episodes.
McGlone leans on 1987. He describes a leverage-liquidation phase that becomes a “buy when they cry” opportunity, with bonds rallying once stocks crack.
The 2022 exception
Then came 2022. Rapid rate hikes and inflation pushed stocks and long-dated bonds down together, and the “stocks down, bonds up” assumption broke.
Today’s yields reflect inflation and Treasury supply concerns, not a growth scare. On that basis, the current setup sits closer to 2022 than to 2008.
So ask one question in any drawdown: is this a growth scare, or an inflation and policy shock? Whether bonds protect you depends on the answer. That makes inflation and real yields as worth watching as the equity index itself.
Where the bearish case could be wrong
The case against the bearish view
McGlone argues with conviction, but conviction is not the same as consensus. Prediction markets in particular disagree with him.
Quantified dissent Kalshi traders put the odds of Bitcoin outperforming gold this year at 58-60%, according to Oxbow Advisors and MarketWatch.
Bitcoin bulls call it “digital gold”, a fixed-supply asset that may benefit from fiscal stress after any initial liquidity shock. Gold bulls point to its record in 2008, during the 2011 eurozone tensions and through the pandemic.
The largest point of contention is yields. McGlone expects them to fall quickly if stocks decline. The opposing argument holds that large deficits and a higher neutral rate could keep them elevated, as in parts of 2022. If that happens, bonds would not provide the cushion his framework assumes.
The stock-bond correlation has swung sharply in 2026, and UBS research ties the shift toward positive territory to core inflation staying above roughly 3.1%, which is the threshold where bonds stop cushioning equity losses.
AI bulls add a separate challenge. They point to high margins, network effects and productivity gains, with earnings concentrated in large, profitable firms. On that reading, the market is in an early technology shift rather than a late-stage bubble.
McGlone himself concedes that his call to overweight Treasuries and sell risk assets has not yet worked in copper or crude, and he says his view is not formal advice. He also treats the unanimous crypto optimism he saw at the Greenwich Economic Forum as a contrarian warning. Whether that reading is right remains a judgement call.
Signposts to monitor
Each counter-argument comes with a signal that would confirm it:
- Bitcoin as digital gold: Bitcoin holding firm during an equity sell-off rather than falling further than stocks
- Gold as safe haven: gold rising even while real yields stay high
- Sticky yields: long yields holding above 5% while stocks fall
- AI valuations justified: mega-cap earnings growth keeping pace while market breadth improves
- Fed path: future hike odds, since current CME FedWatch probabilities were not available for this analysis
There are gaps in the data. The 5-year yield for 8 October was not available, and McGlone’s valuation and performance figures lack independent verification. Treat the bear case as one well-argued scenario to size your positions against, not as a settled outcome to bet your portfolio on.
Positioning for a late-cycle market without pretending to know the trigger
The central lesson is simple. Equities are the master variable, the cause of any drawdown decides whether bonds help, and Bitcoin has historically been the highest-beta way to hold equity risk, meaning it tends to move further than stocks in both directions.
A practical framework follows. Check how each hedge correlates with stocks under stress, compare its volatility with the market’s, and watch real yields. Then match each hedge to the type of shock it protects against: long bonds for growth scares, and something other than long bonds for inflation and policy shocks. McGlone’s views are not formal advice, and nothing here is personal advice either.
A resilient portfolio avoids a single hidden forecast: spreading exposure across a broad equity core, diversifiers, and a bonds and cash sleeve covers more than one possible outcome, whichever shock arrives.
What would change the picture is clear. Falling real yields, broadening market breadth or a softer Fed path would weaken the bear case. Long yields that hold firm while stocks slide would strengthen it.
This article is for informational purposes only and should not be considered financial advice. Investors should conduct their own research and consult with financial professionals before making investment decisions. Past performance does not guarantee future results. Financial projections are subject to market conditions and various risk factors, and forward-looking statements are speculative and subject to change.