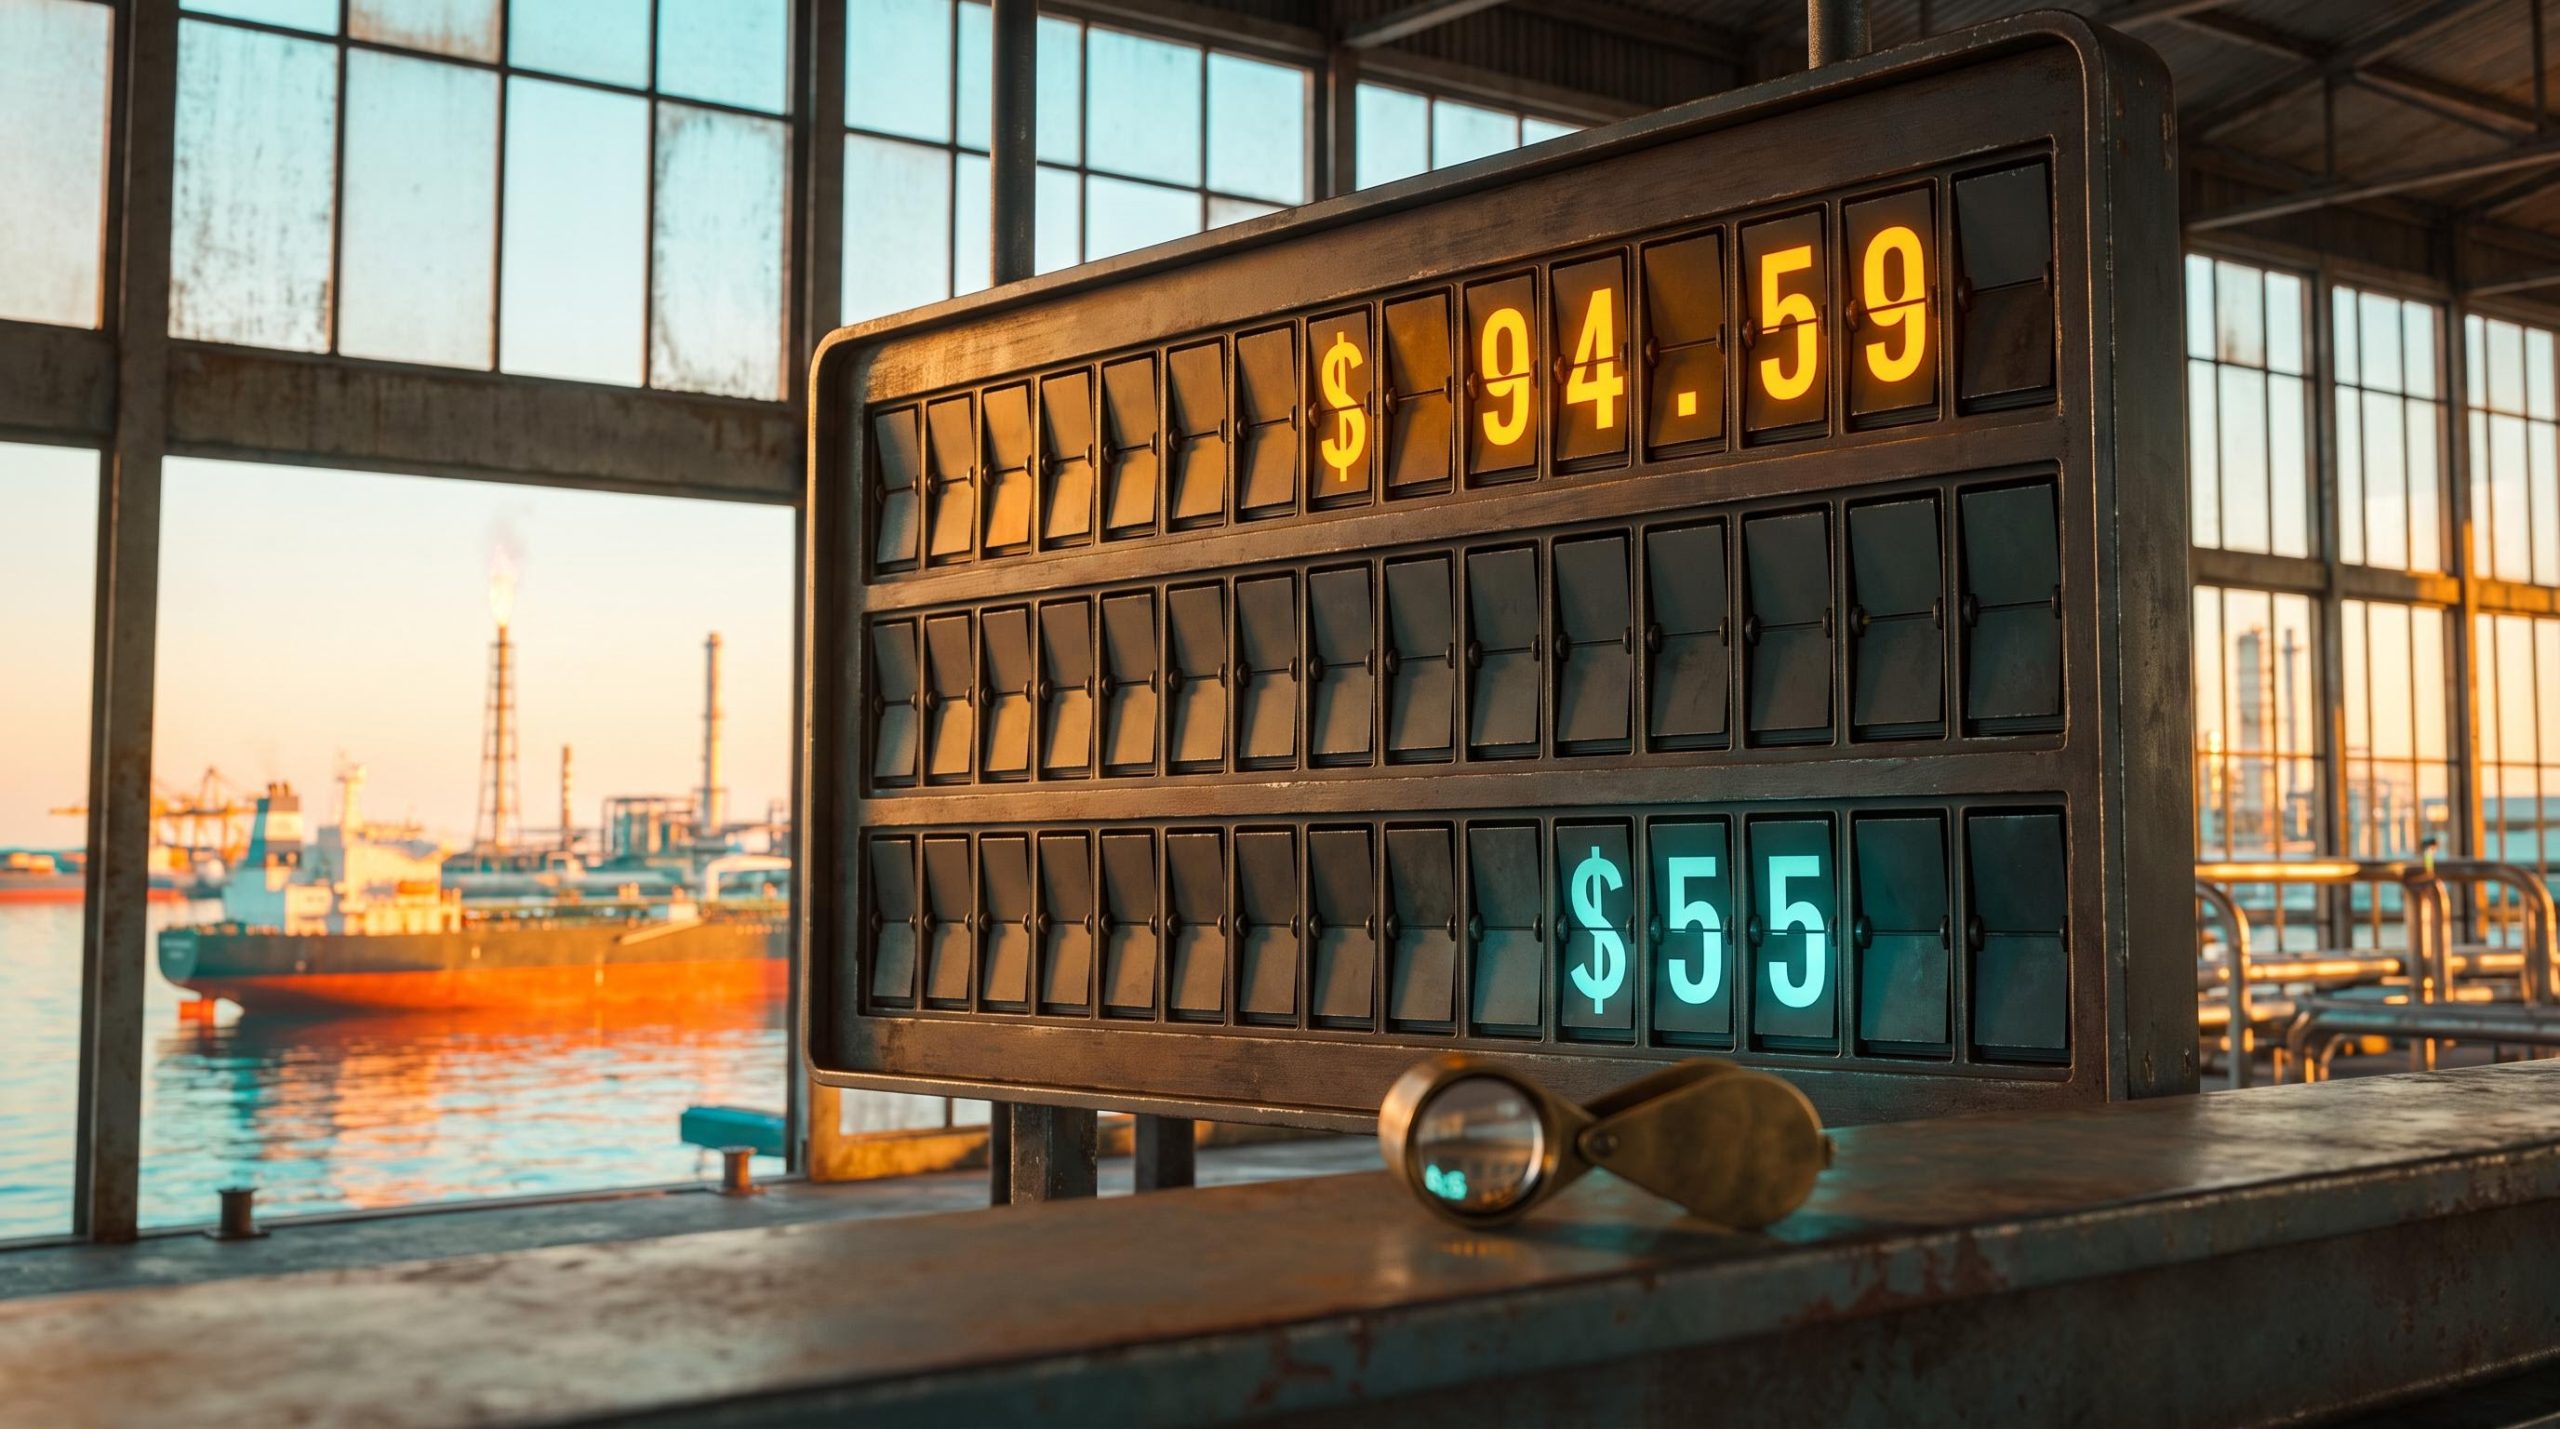
Front-month WTI has swung from above $100 to below $90 and back toward $95 in about two and a half weeks. Over the same stretch, the futures strip kept pricing crude in the mid-$50s by the early 2030s. Both numbers come from the same market, so the real question is which one traders actually believe.
The Iran war has kept front-month WTI near $93 as of today, 8 October 2026. The back of the curve is making a quieter argument: the spike is temporary. That is the core of the crude oil bear case, and it rests on supply growth, a production-cost anchor and slow demand erosion.
The thesis comes with a caveat. Its most prominent advocate, Mike McGlone, senior commodity strategist at Bloomberg Intelligence, admits his timing has been wrong more than once this year.
Here is how to read a futures curve and weekly inventory data for yourself, and where the bearish argument is most likely to crack.
What is the futures curve telling you that the front month is not?
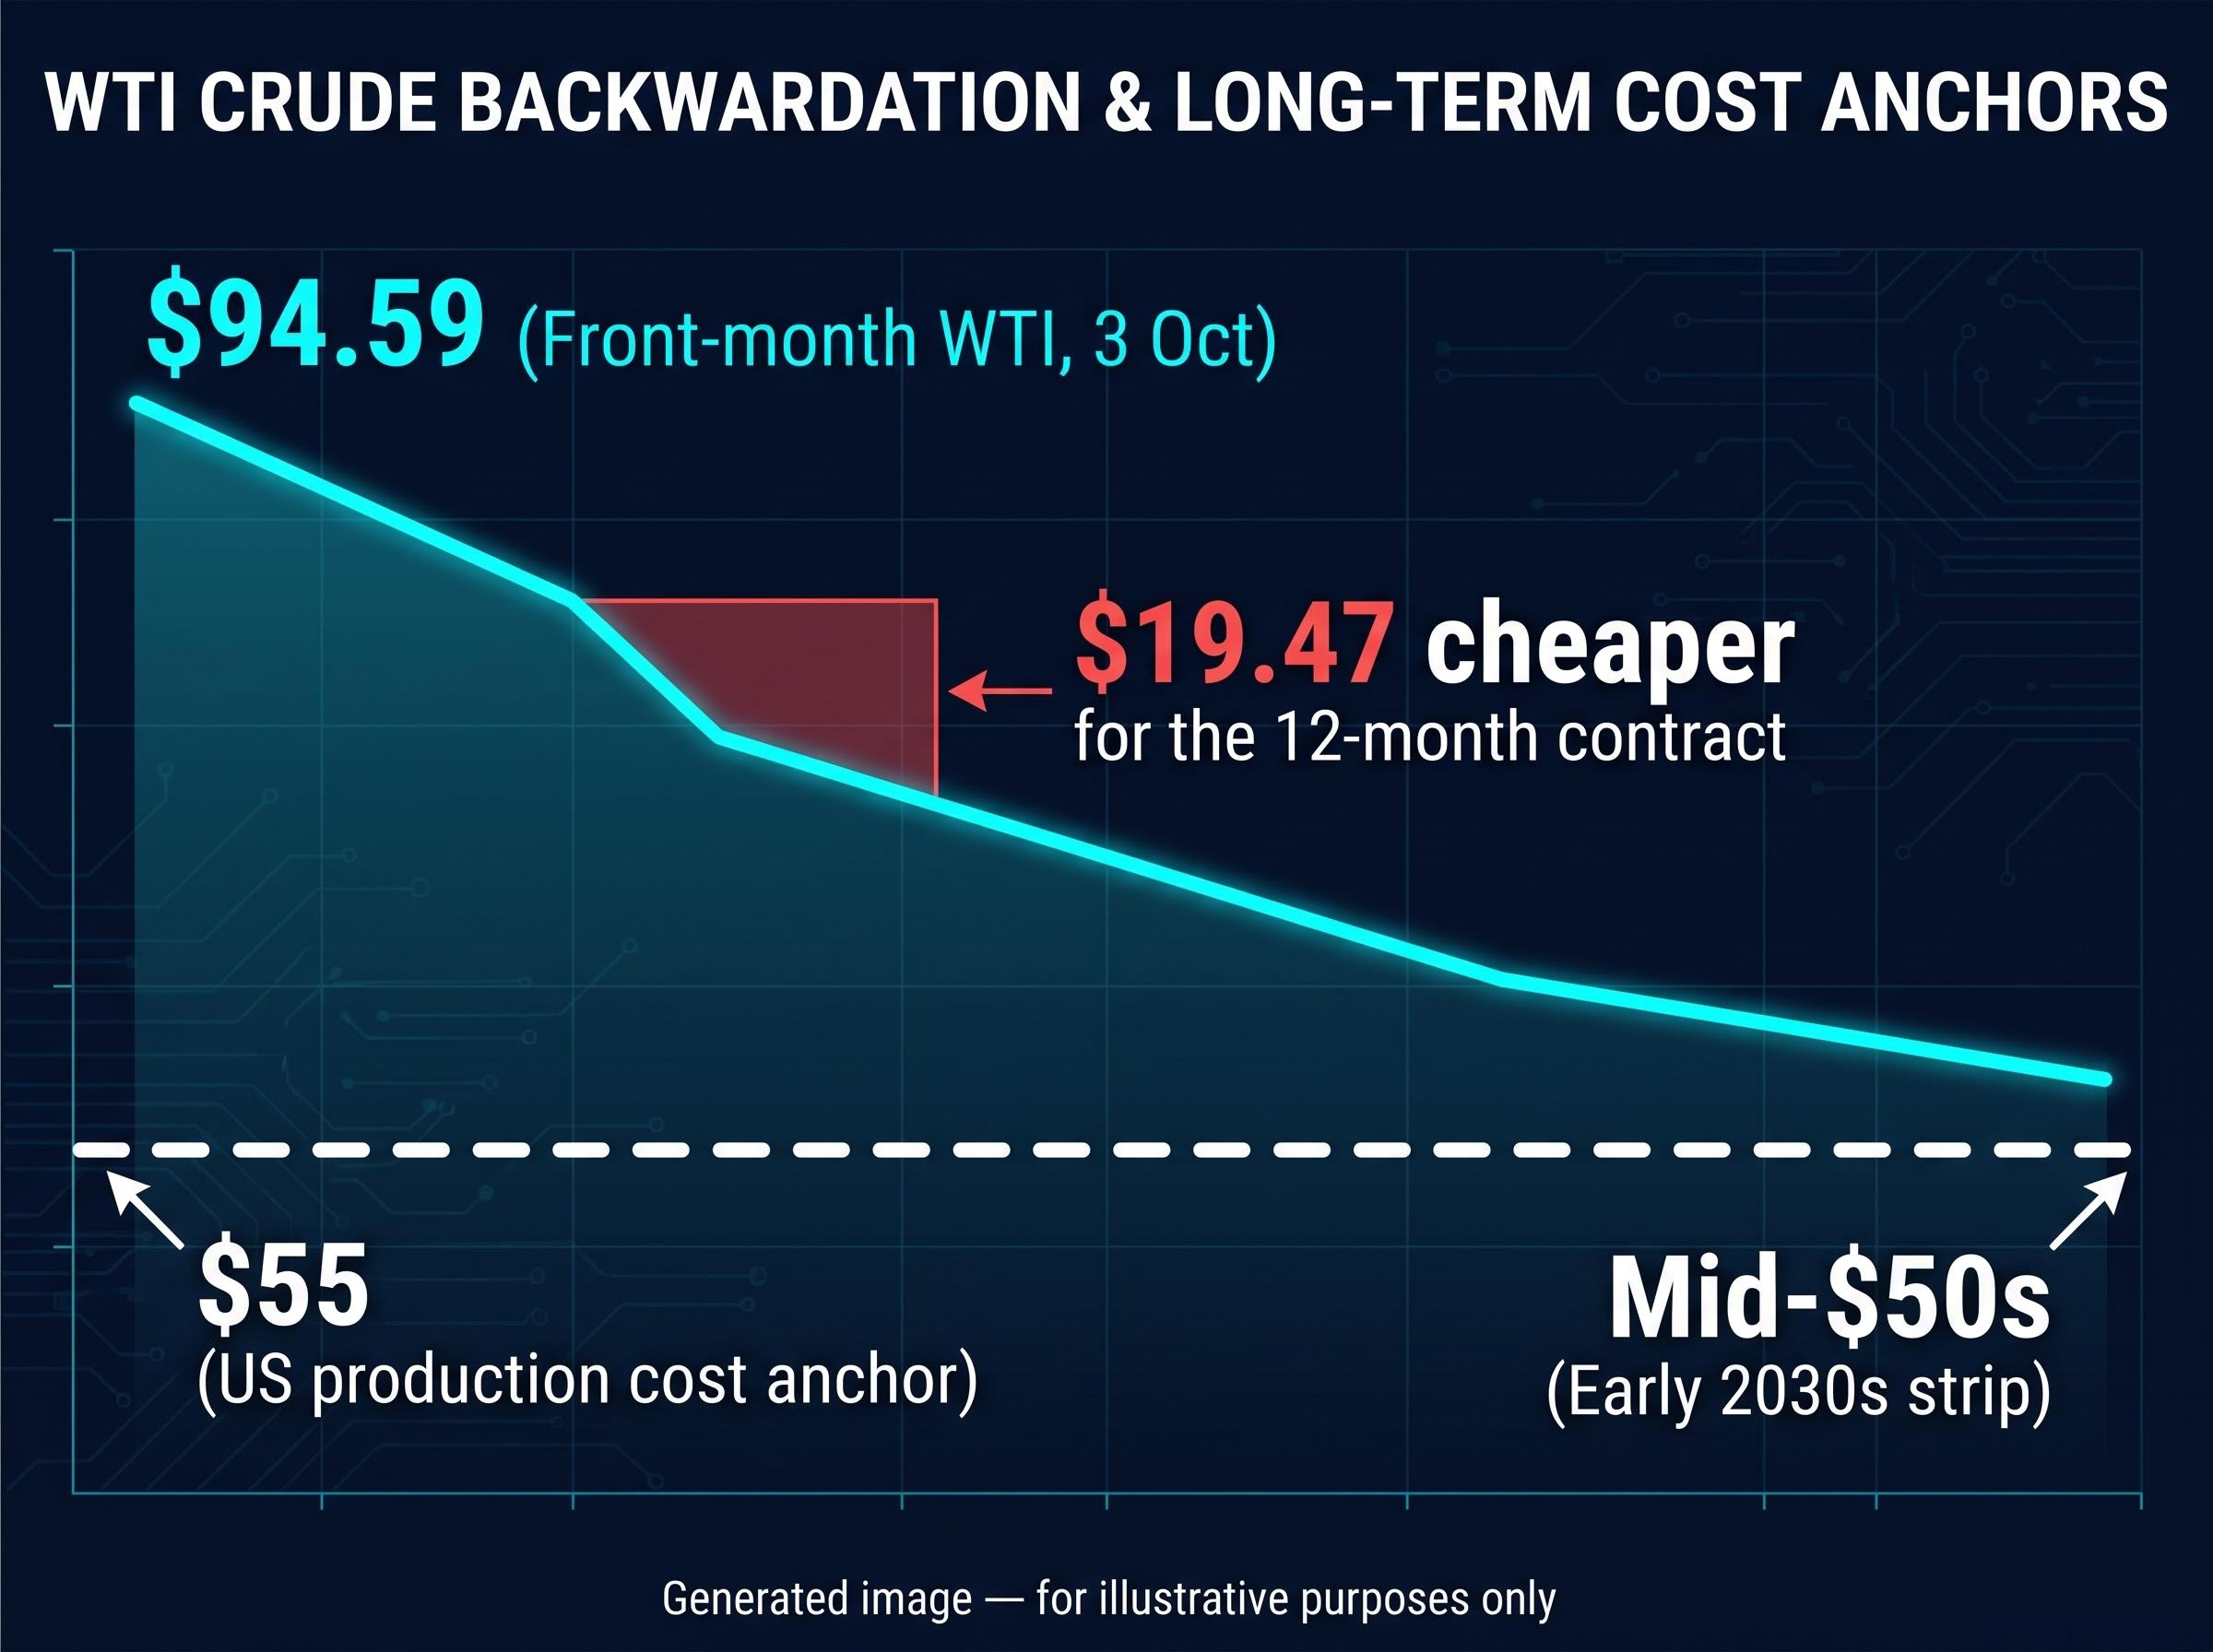
On 3 October, NYMEX WTI front month settled at $94.59. The contract twelve months out was $19.47 cheaper. A market that pays that much more for oil today than for oil next year is not forecasting a new price regime. It is describing a squeeze.
How to read backwardation
Backwardation is when the nearest futures contract trades above contracts for later delivery. Contango is the opposite: later contracts trade higher than the nearest one, usually because supply is plentiful and storage costs money.
On 18 September, October WTI traded at $100.30, November at $96.08 and December at $92.05. A buyer paid roughly $8.25, or about 8%, extra to take barrels in October rather than December. That premium is the price of urgency.
The backwardation spread between spot and one-year forward contracts is effectively the market’s own estimate of embedded fear premium, which is why a wide gap can coexist with bearish long-dated forecasts.
The 12-month spread On 3 October, front-month WTI stood 20.6% above the contract twelve months out. Brent’s 12-month backwardation was even wider at $25.92.
| Date | Front WTI | Later contract | Spread | Reading |
|---|---|---|---|---|
| 24 August 2026 | Near $85 | Not quoted | Moderate, easing | Softening and flattening |
| 26 August 2026 | $82.23 | Dec 2027 below $71 | Wide at the long end | Strip slides toward $55-57 by 2035 |
| 18 September 2026 | $100.30 | Dec 2026 $92.05 | $8.25 (about 8%) | Steep prompt premium |
| 3 October 2026 | $94.59 | 12 months out | $19.47 (20.6%) | Deep backwardation |
Much of that urgency sits in refined products. The Bloomberg diesel and heating oil index was up 170% on a 12-month basis at the end of September, its highest reading since 1987. The US ultra-low sulphur diesel (ULSD) contract peaked near $526 and has eased to about $490. The Energy Information Administration (EIA) said Brent averaged about $105 in June and July as shipments stayed limited.
What flattening would signal
A flattening curve suggests prompt tightness is easing or confidence in future supply is rising. History offers a guide: backwardation spiked in 2007-08 and 2022 before flattening or flipping to contango. Yet the curve flattened on 24 August and then rebounded sharply in September, so flattening alone is not a trigger.
The takeaway for you is that the front-month price and the five-year price answer two different questions. One prices scarcity right now. The other prices where marginal cost pulls oil once the war, logistics and diesel bottlenecks clear.
When big ASX news breaks, our subscribers know first
Is a Western Hemisphere supply surge enough to cap prices?
If the back of the curve expects lower prices, the supply data should eventually justify it. Today it shows the opposite. The International Energy Agency (IEA) has cut its 2026 global supply estimate in successive reports.
| Report | Change | Level |
|---|---|---|
| June 2026 | -3.9 mb/d | 102.4 mb/d |
| August 2026 | -4.3 mb/d | 102 mb/d |
| September 2026 | -5.7 mb/d year on year | 100.7 mb/d |
Mb/d means million barrels per day. The September report also pushed a full Middle East supply recovery back to 2027. In the near term, the story is shortage rather than glut.
The offset comes from the Americas. The IEA expected 1.5 mb/d of Americas supply growth in its May report and 1.4 mb/d in August, enough to partly offset losses from the Middle East and Russia. Agency excerpts did not break that growth down by country.
The Americas supply surge may also prove smaller than hoped, with US output near records but rig counts far below the 2022 peak and shale hitting geological limits that could plateau production.
McGlone goes further. He estimates the North American crude and liquids surplus is approaching 9 mb/d, against 3-4 mb/d at the 2022 peak, when crude traded near $130. He also estimates Chinese inventories near 1.9 billion barrels, compared with about 300 million in the US Strategic Petroleum Reserve. Both figures are his own and have not been independently verified.
Physical stocks complicate the picture. US commercial crude inventories fell 3.2 million barrels to 424.1 million in the week ending 2 October. Weekly signals worth tracking include:
- Commercial crude stock changes in the EIA weekly report
- Distillate inventories, which reveal diesel tightness
- Whether draws continue as Americas output rises
Falling US stocks tell you the market is genuinely tight today. The bear case only works if supply growth arrives before inventories rebuild, so neither a single weekly print nor a structural forecast should carry your view on its own.
Does a $55 cost anchor hold when demand is eroding?
Supply growth explains the direction of travel. Cost explains the destination. McGlone puts average US production cost at about $55 a barrel, which lines up with the WTI strip near $55-57 by 2035. No updated Federal Reserve Bank of Dallas breakeven figure was available to confirm it.
The Dallas Fed Energy Survey tracks the WTI price US producers say they need to drill profitably, giving you a regional breakeven check on whether a $55 cost anchor holds across plays like the Permian Basin.
The logic is that prices above cost encourage drilling until supply catches up, pulling prices back toward that level over time. Demand erosion lowers the bar further. Electric vehicles, biofuels such as E15 (petrol blended with 15% ethanol), renewable diesel and China’s efficiency gains and fuel-switching all trim oil demand.
The catch is speed. That erosion moves in fractions of a mb/d per year, meaningful over a decade but slow in any given quarter.
McGlone argues that higher prices from here would require:
- A worsening war
- Curtailed demand destruction
- A rising stock market
He considers all three unlikely and links a 10% equity decline to falling crude, since a stock drop implies recession. In his view, gasoline could return to about $2 as crude moves toward cost, US natural gas is still falling, and diesel has likely peaked.
Official forecasts move far more slowly. The EIA’s Short-Term Energy Outlook, released on 6 October, sees gradual easing rather than collapse.
The forecast gap EIA projects Brent at $105 in Q4 2026, $96 for full-year 2026 and $84 in 2027. That is still well above the $55 cost anchor.
The distance between $84 and $55 tells you this is a multi-year drift, not a call for an imminent collapse. For your energy exposure and fuel budget, being right on direction matters far less than knowing how long the drift could take.
Where could the crude oil bear case break?
Every leg of the thesis assumes the war’s disruption fades. The Strait of Hormuz is where that assumption is weakest. McGlone estimates flows at 80-85% of pre-war levels, with distillates and liquefied natural gas still struggling to exit. Other reports describe traffic near pre-war levels, and the two accounts have not been reconciled.
Official statements and shipping reality have diverged before, and Hormuz transit data showing only a fraction of the pre-war 120-140 daily vessels is why reconciling the conflicting throughput accounts matters.
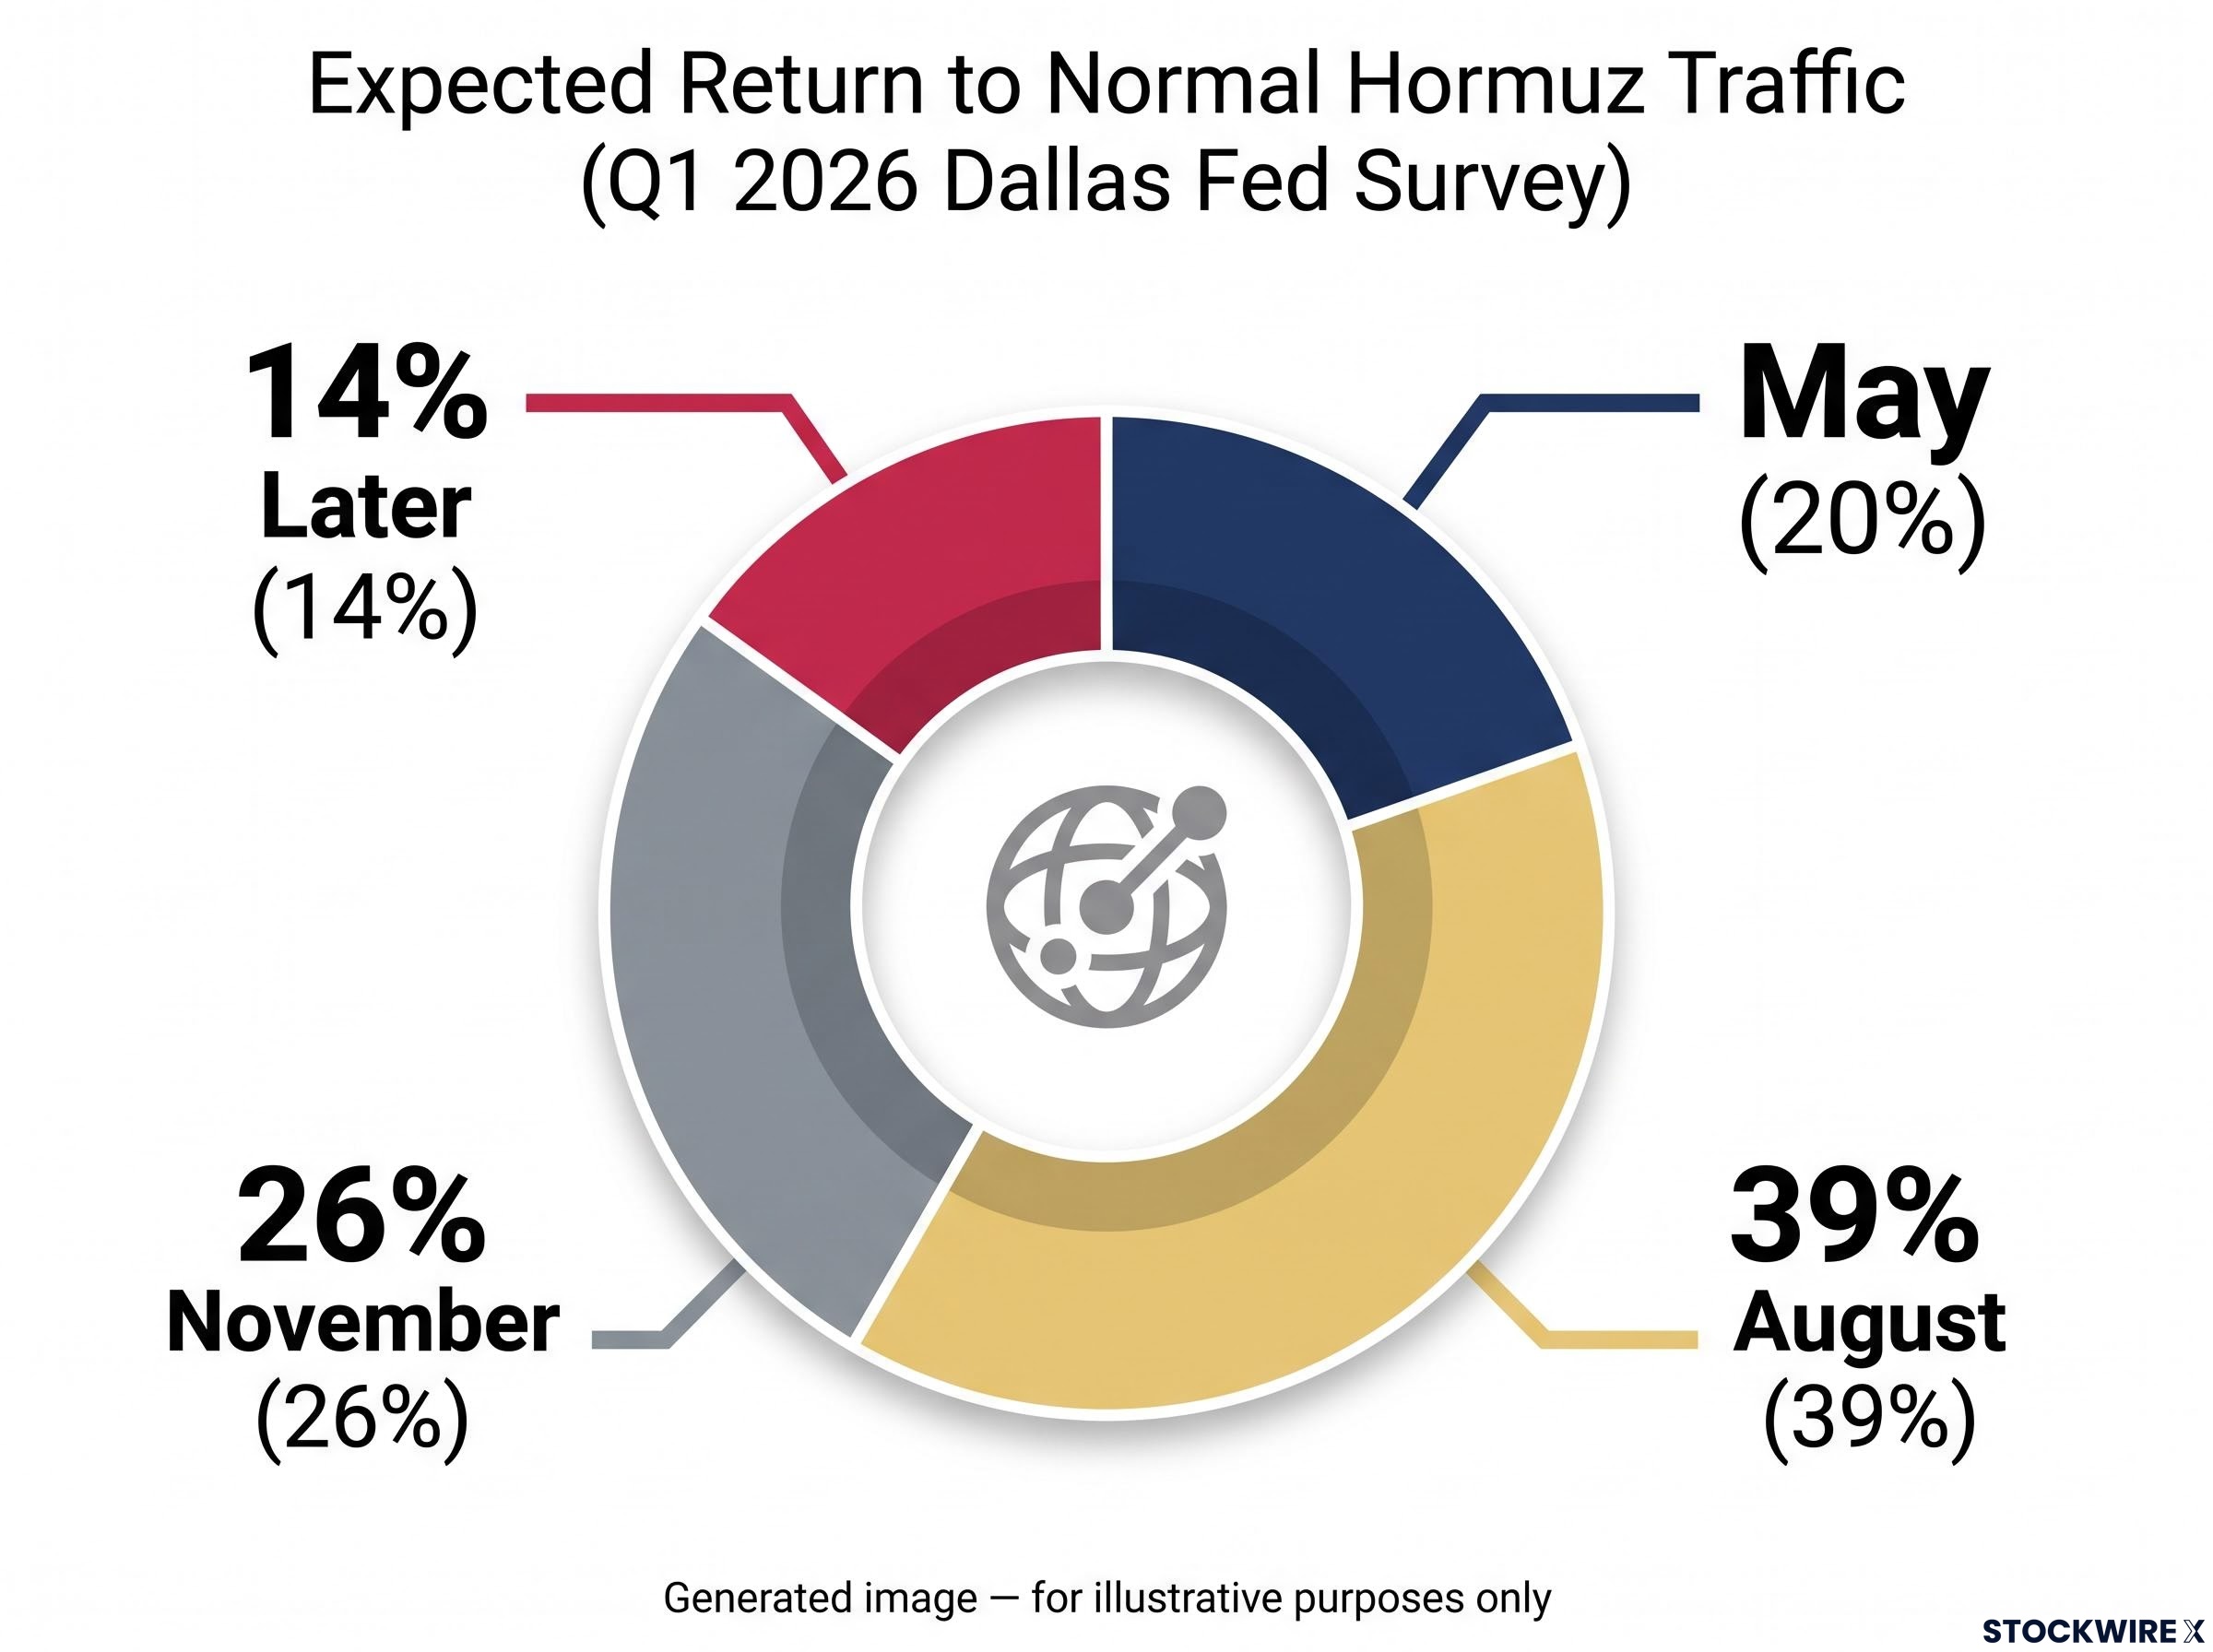
Industry expectations point to a slow return. The Dallas Fed Energy Survey for Q1 2026 found 20% of respondents expected normal Hormuz traffic by May, 39% by August, 26% by November and 14% later. Politics adds another layer: US midterm elections are about a month away, and McGlone argues Iran has an incentive to keep energy prices high to sway voters.
Signals that would confirm or weaken the thesis
- Hormuz throughput: a verified return to pre-war flows would support the bear case
- OPEC+ policy: no current commentary was available, but deeper cuts would historically support prices
- Shale capital discipline: slower drilling would delay the Americas surge
- Geopolitical premium: a narrowing Brent-WTI gap would suggest the risk premium is fading
- Diesel tightness: easing crack spreads, which measure refining margins, would signal product relief
Markets are not fully convinced either. December 2026 WTI trades near $90, and a prediction market prices a 47% chance of WTI reaching $97.50 or higher. The IEA’s supply cuts in June, August and September show how often normalisation has proved slower than expected.
The thesis’s loudest advocate concedes the point.
McGlone’s timing record In February, McGlone called $120 the potential peak. He also expected the December WTI contract to be near $50-60, and it sits closer to $90.
Because the structural direction can be right while the timing is wrong, treat the bear case as a framework for watching signals rather than a date on which to act. These forecasts are speculative and may change as market conditions develop.
Reading the curve and the stocks before you trust any oil call
A tight prompt market and a bearish back end can both be true at once. The useful work lies in tracking the gap between them rather than picking a side.
Four markers will tell you which way that gap is moving:
- The front-to-twelve-month WTI spread
- Weekly EIA crude and distillate stocks
- Verified Hormuz throughput
- Diesel crack spreads
If the spread narrows while stocks rebuild, the bear case gains ground. If draws persist and Hormuz stays constrained, the squeeze may outlast the forecasts. Either way, the decision comes down to evidence, not conviction.
This article is for informational purposes only and should not be considered financial advice. Investors should conduct their own research and consult with financial professionals before making investment decisions. Past performance does not guarantee future results. Financial projections are subject to market conditions and various risk factors.