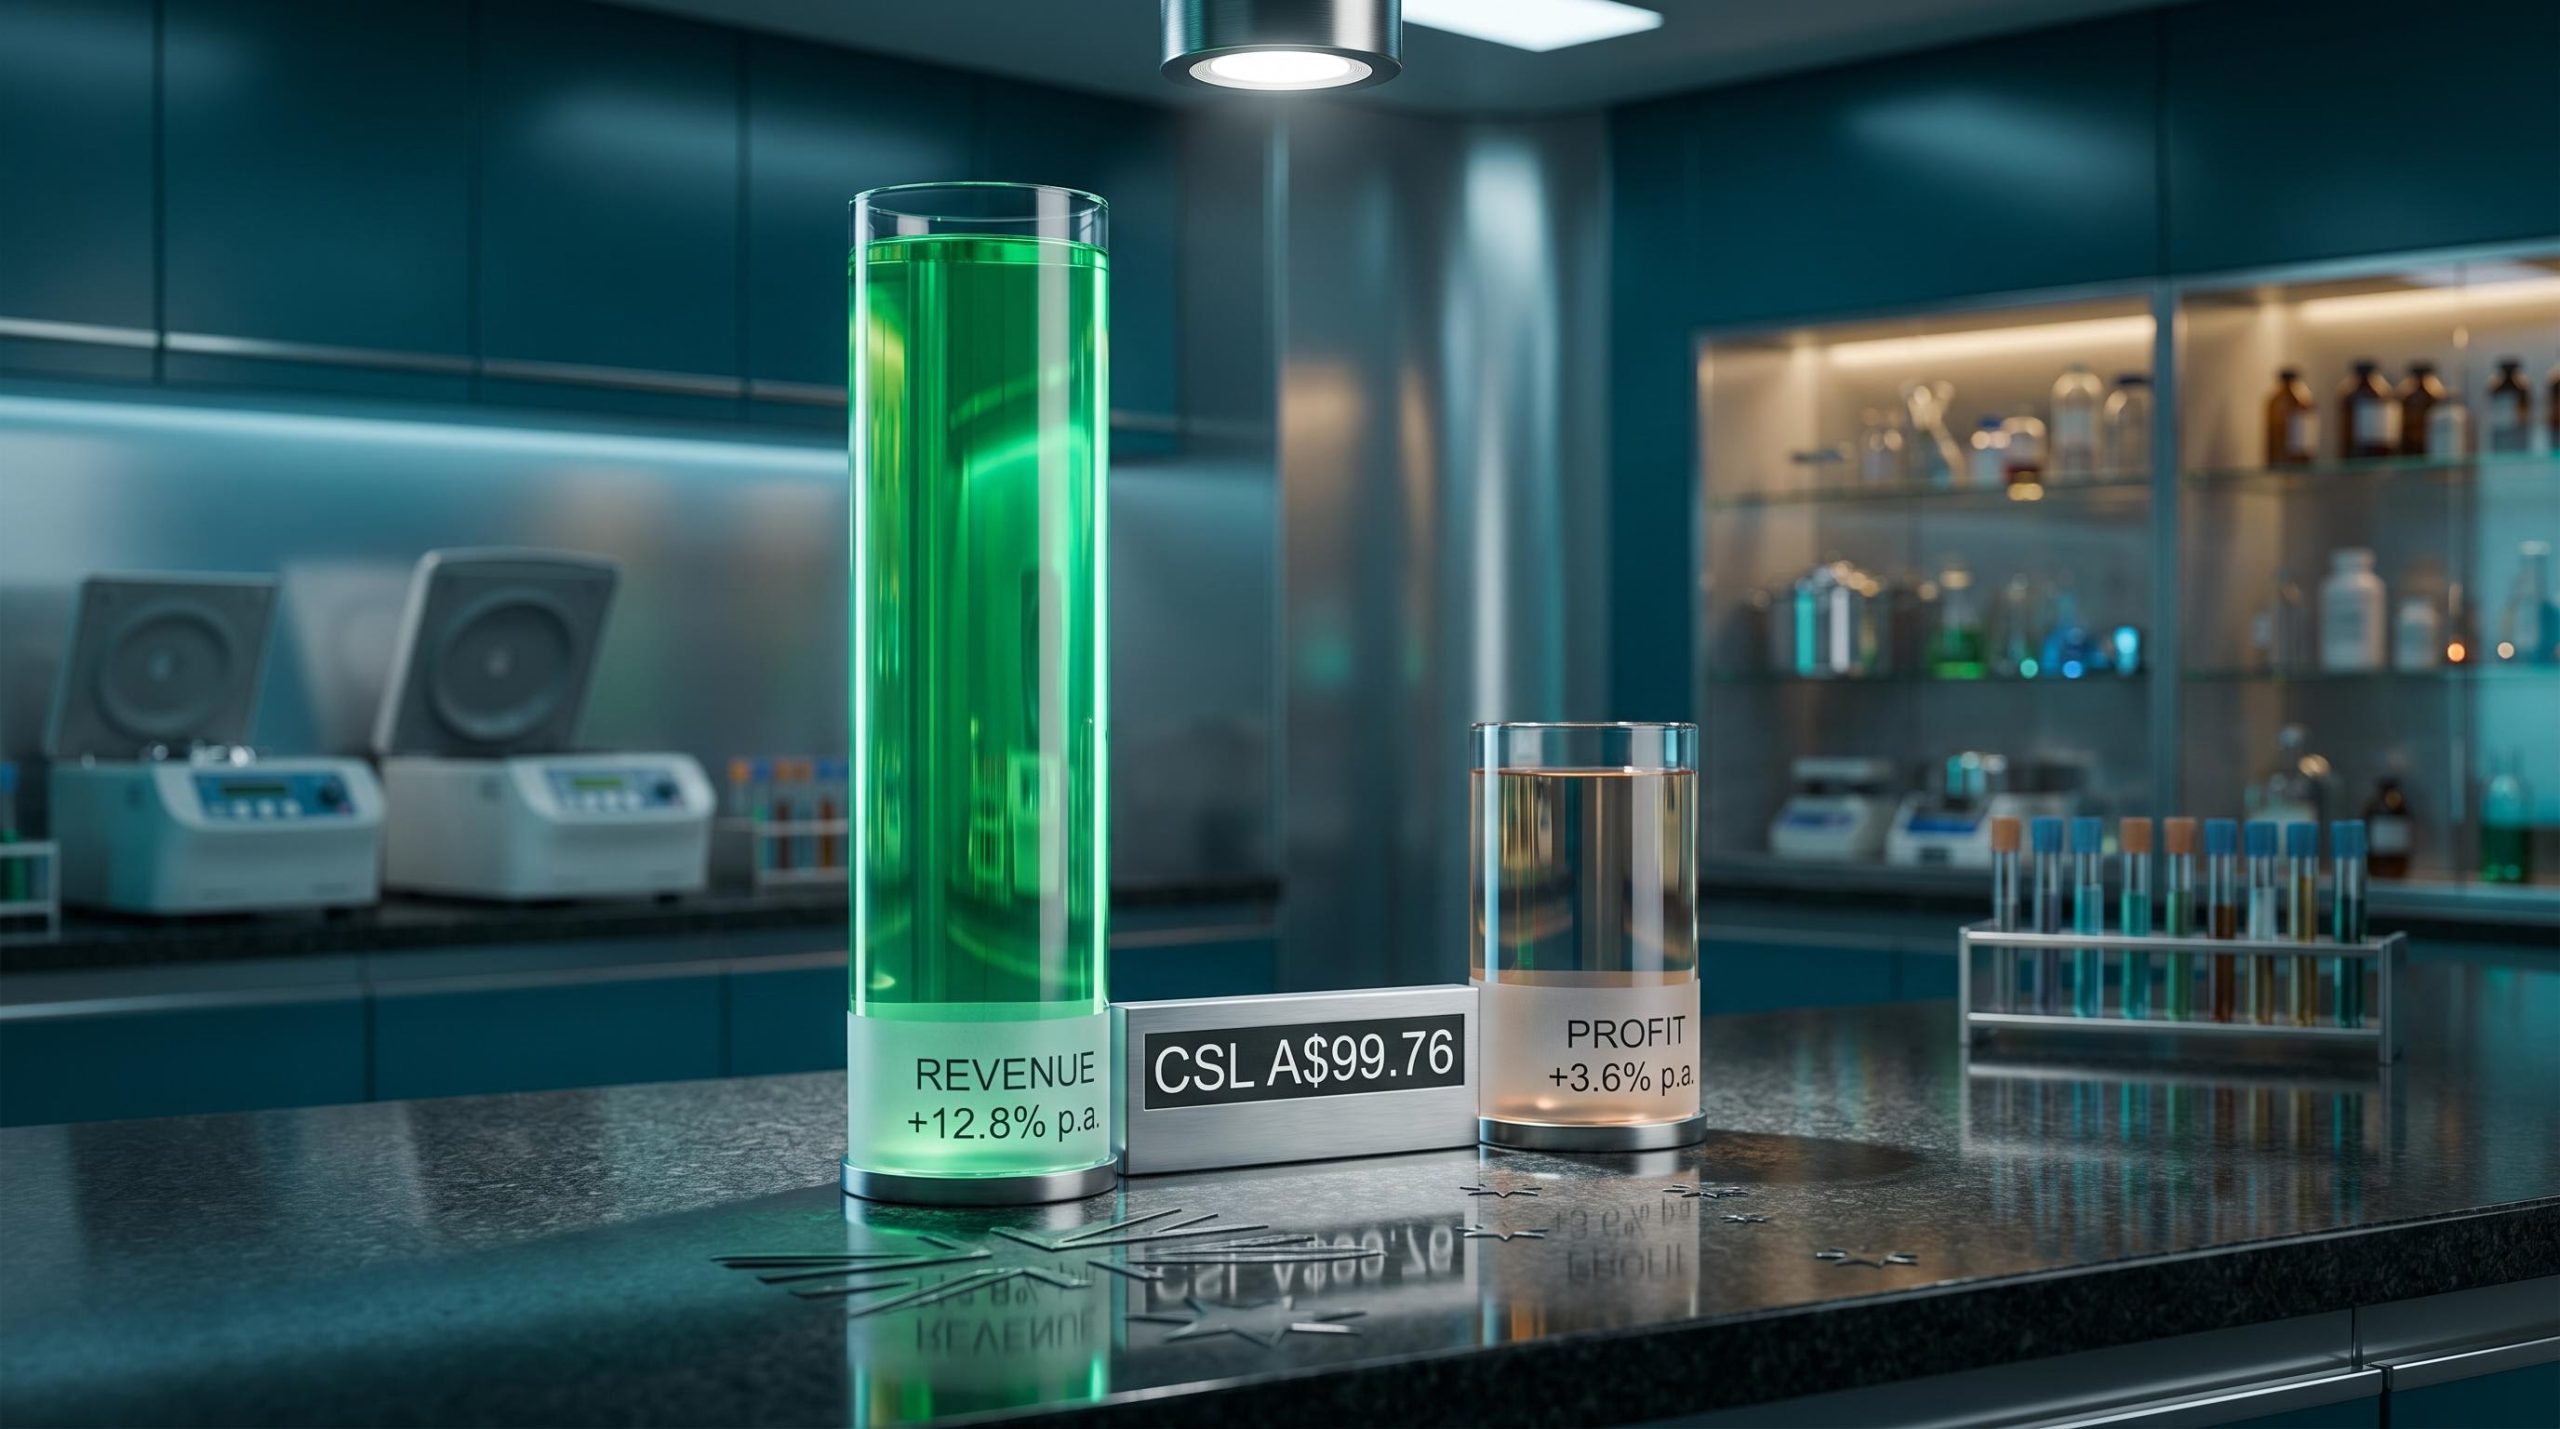
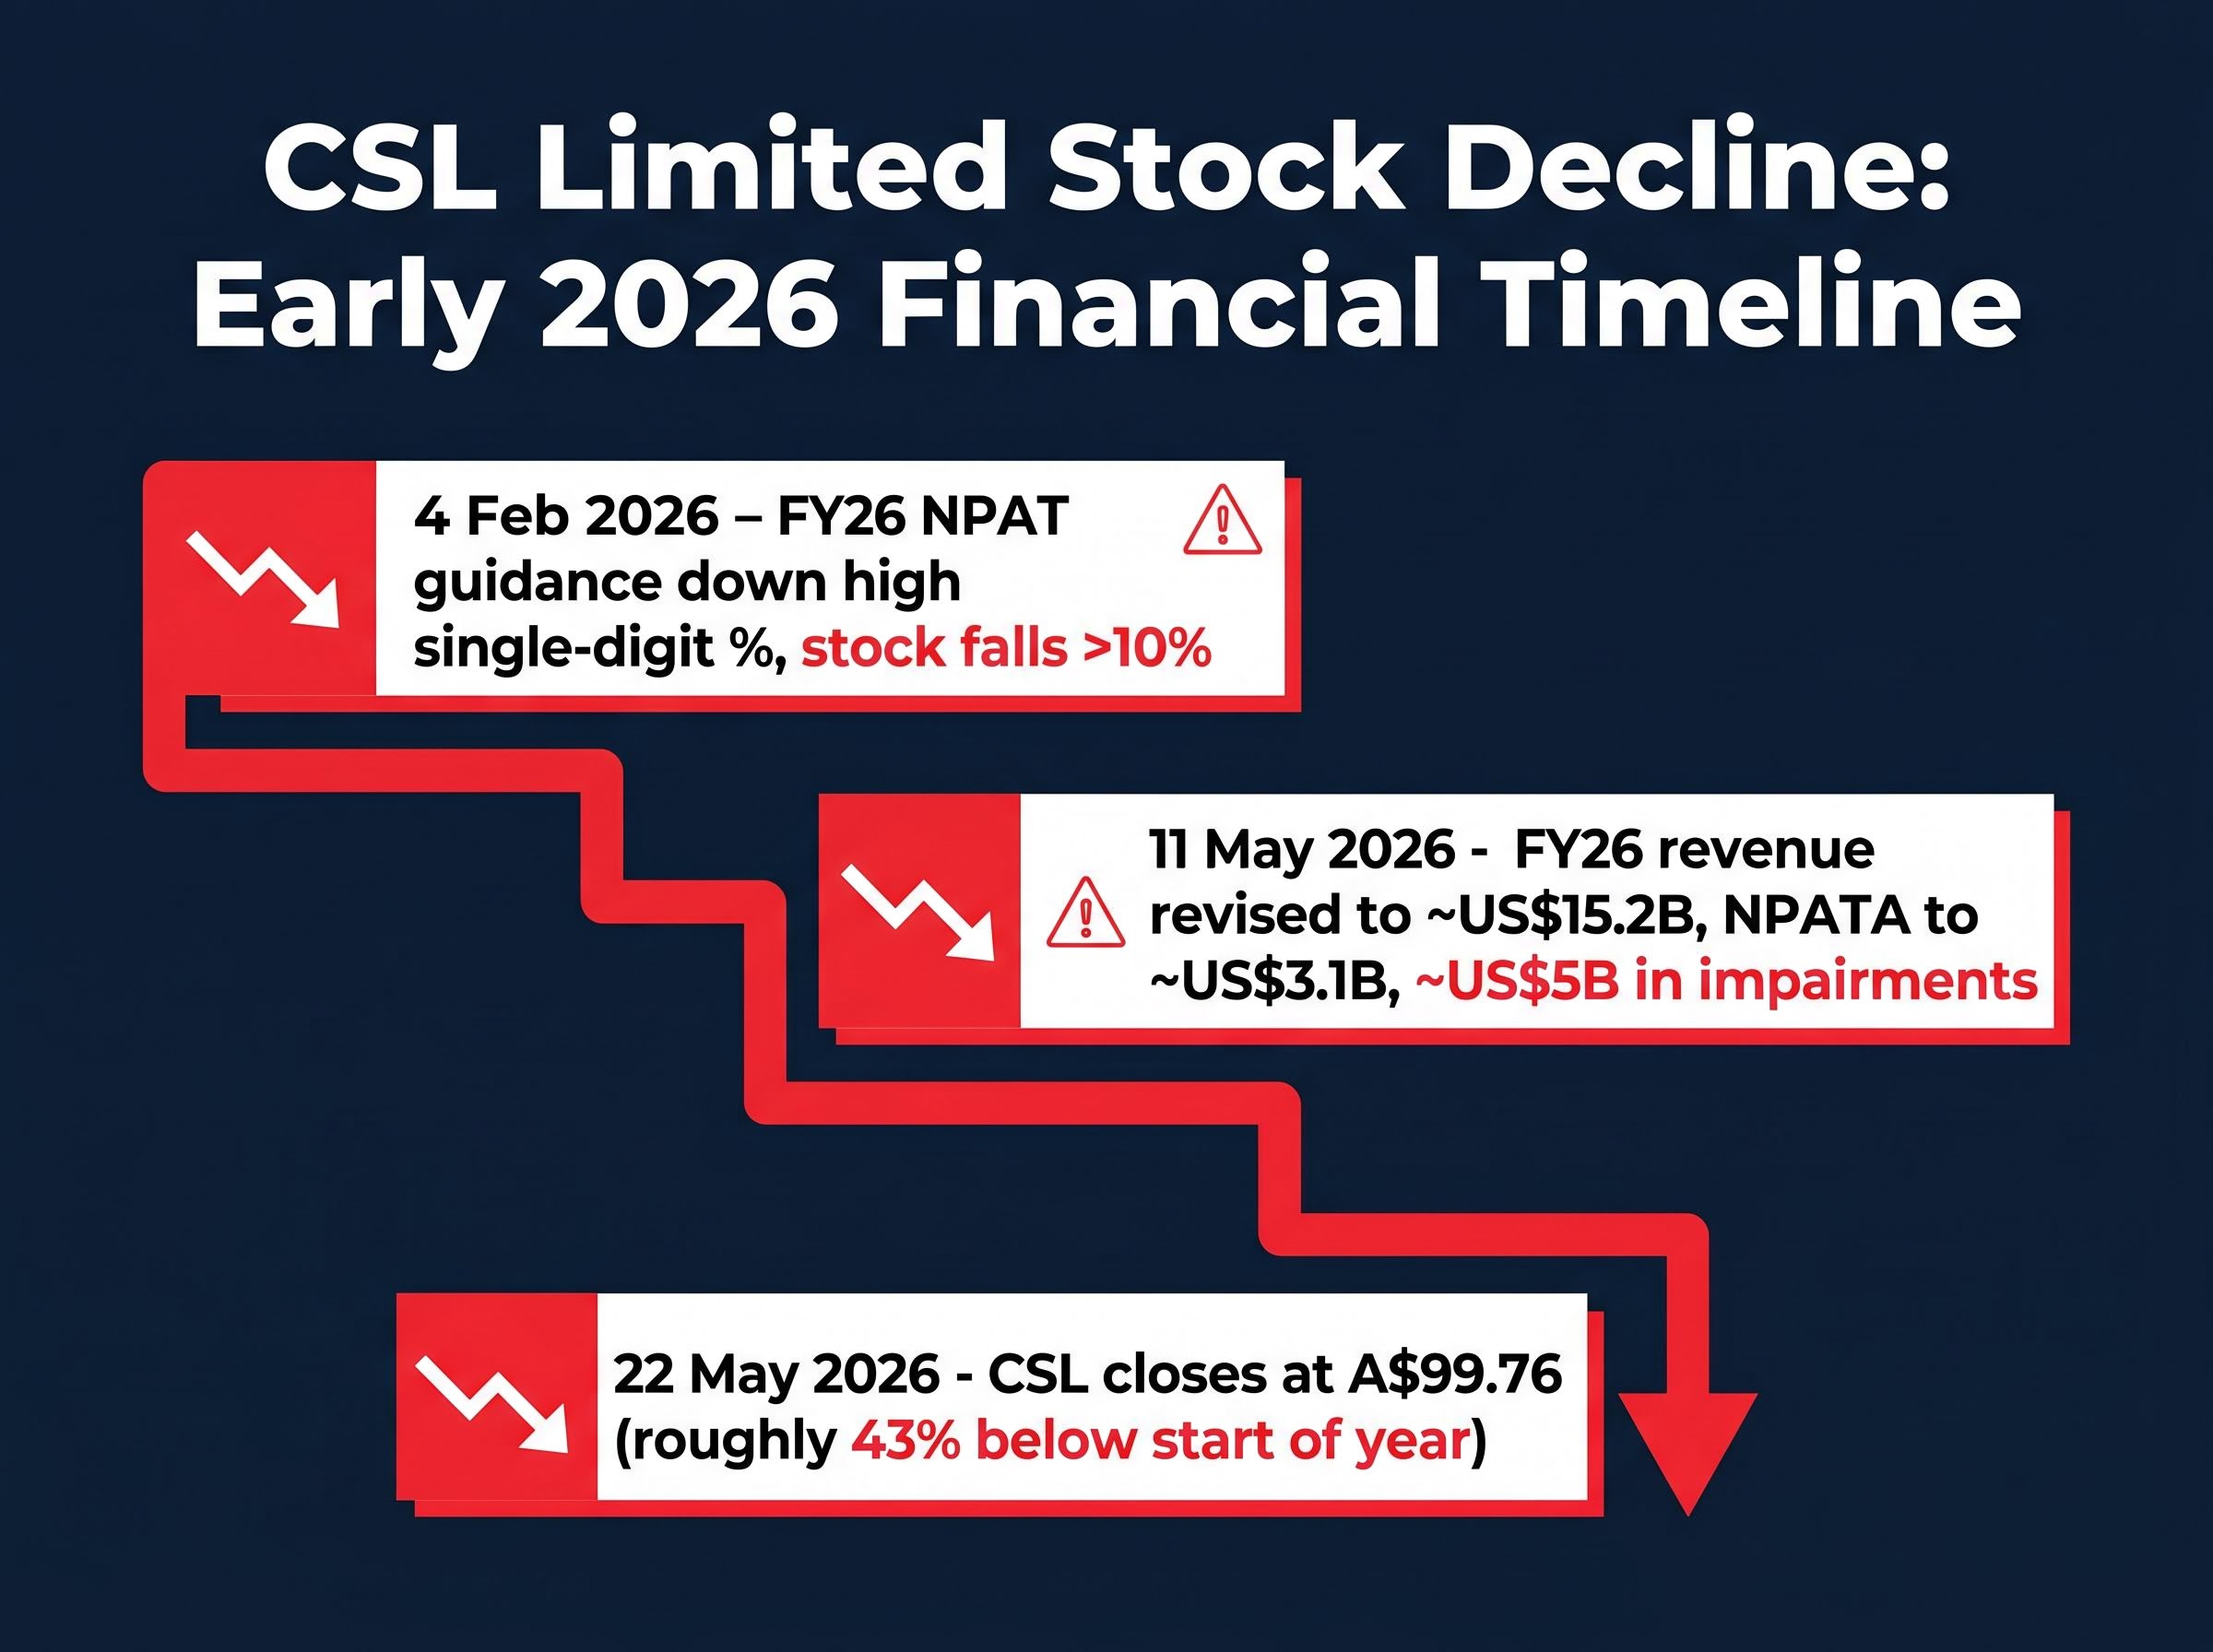
CSL closed at A$99.76 on 22 May 2026, roughly 43% below where it started the year. A stock that Australian investors once treated as untouchable blue-chip territory is now trading at multi-year lows, and the speed of the decline has few precedents among ASX heavyweights of comparable scale.
This is not a speculative small-cap caught in a momentum unwind. CSL is one of the ASX’s most studied, most widely held healthcare companies, a constituent of virtually every major domestic equity fund. A collapse of this magnitude in a business of this profile demands a systematic explanation rather than a headline summary.
What follows is a structured breakdown of the specific catalysts behind the fall, the financial metrics that reveal CSL’s current condition, and a clear-eyed assessment of what the numbers say about the investment case at A$99.76. The analytical framework used here is designed to be transferable to any large-cap healthcare stock facing similar pressures.
How CSL fell more than 40% in five months
The first crack appeared on 4 February 2026. CSL issued a trading update revising FY26 net profit after tax guidance down by a high single-digit percentage. The stock fell more than 10% in early trade that morning, one of the sharpest single-day moves in the company’s listed history.
Three months later, the second blow landed. On 11 May 2026, CSL revised FY26 revenue to approximately US$15.2 billion, NPATA to approximately US$3.1 billion, and announced approximately US$5 billion in impairments, including Vifor-related write-downs. What had been a guidance disappointment became a full earnings reset.
Between those two dates, a wave of broker downgrades converted the disappointment into sustained selling pressure rather than a one-day event:
- February 2026: Guidance cut triggers an immediate 10%-plus intraday sell-off and resets market expectations
- February to April 2026: Six major brokers slash price targets, with Macquarie downgrading to Neutral from Outperform (target cut from A$320 to A$260) and Morgan Stanley reducing its target from A$305 to A$255
- May 2026: Further guidance revision and ~US$5 billion in impairments confirm that the February warning was not conservative enough
“CSL earnings miss fans worries over plasma costs” — Reuters, 4 February 2026
The share price at A$99.76 reflects a genuinely revised earnings story. Sentiment amplified the fall, but the earnings deterioration beneath it is real.
When big ASX news breaks, our subscribers know first
The three divisions driving CSL’s numbers (and the one creating the most drag)
Before evaluating whether CSL is cheap at current prices, it helps to understand where the company’s revenue actually comes from and which division is creating the most pressure on group returns.
CSL Behring
- The core plasma-derived therapies business, centred on immunoglobulins and albumin
- Revenue and profit engine for the group, generating the strongest margins
- Post-COVID plasma collection costs (donor fees, labour, logistics) remain elevated, directly compressing the segment margin investors had expected to recover by now
CSL Seqirus
- The influenza vaccines and pandemic preparedness division
- Revenue declined in FY25 versus the prior year, driven by a weaker Northern Hemisphere flu season and normalisation after COVID-era demand
- Government contract revenue provides a floor, but growth has stalled relative to the pandemic period
CSL Vifor
- Acquired in 2022 to build a position in iron deficiency and nephrology therapies
- Mid-single-digit revenue growth in FY25, but integration costs and amortisation continued to weigh on divisional margins
- A Citi analyst characterised Vifor as “a strategic fit but still dilutive to group ROE and ROIC,” with consensus now viewing it as a low double-digit ROIC asset at best
- The approximately US$5 billion in impairments announced in May 2026 is the market’s clearest signal that original acquisition assumptions have not been met
Vifor is the division creating the most drag. Until its returns improve, the group’s ability to justify a premium multiple remains constrained.
Dissecting CSL’s financial performance
Six metrics, read in sequence, tell the story of a company where revenue grew substantially but profit failed to keep pace. That gap is the central tension in CSL’s numbers.
| Metric | Latest Value | Prior Period | CAGR / Change | What It Signals |
|---|---|---|---|---|
| Revenue | A$14,800M | Three years prior | 12.8% p.a. | Strong top-line growth, partly acquisition-driven |
| Net debt | ~A$10,526M | Pre-Vifor levels lower | Elevated | Acquisition-driven leverage limiting capital flexibility |
| Debt-to-equity | 62.8% | Pre-Vifor levels lower | Elevated | Balance sheet stretched relative to historical norms |
| Gross margin | 52.1% | Historical levels higher | Compression | Plasma cost inflation eroding margin quality |
| Net profit | A$2,642M | A$2,375M | ~3.6% p.a. | Profit growth lagging revenue growth materially |
| ROE | 14.6% (FY24) | Higher historically | Declining | Vifor diluting group returns on equity |
The gap between the 12.8% revenue CAGR and the 3.6% net profit CAGR is the single most analytically revealing tension in these numbers. Revenue grew at nearly four times the rate of profit, meaning costs expanded faster than the top line over the period. That compression reflects plasma cost inflation, Vifor integration drag, and amortisation charges working simultaneously against margin expansion.
The 14.6% FY24 ROE is moderate for a company that historically commanded a 30-40% premium to global peers. As one portfolio manager told the Australian Financial Review:
“CSL has gone from trading at a 30-40 per cent premium to global peers to roughly in line.”
Until Vifor’s returns improve and Behring margins normalise, the premium multiple that once defined CSL’s valuation profile appears difficult to justify.
How plasma costs and competition are reshaping CSL’s margin story
The metrics in the previous section describe what happened. The operational forces below explain why.
Three distinct pressures are compressing CSL’s margins simultaneously:
- Plasma collection costs: Donor fees, labour, and logistics costs remained elevated post-COVID, even as plasma volumes largely recovered. A healthcare analyst quoted by Reuters noted the cost side “remains elevated, delaying the margin recovery investors were banking on.”
- Plasma-derived therapy competition: Grifols and Takeda are competing directly in immunoglobulins and albumin, with selective pricing pressure in the US and Europe. CSL cannot simply raise prices to protect margins.
- Vifor competitive headwinds: Iron deficiency drugs face pressure from generics and rival IV iron formulations, limiting Vifor’s capacity to contribute meaningfully to group margin recovery.
CSL’s group EBITDA margin is estimated at low-to-mid 30s per cent for FY26, down from historical levels. For context, Grifols operates on a mid-20s per cent operating margin after cost-cutting, and both companies were trading on similar low-20s forward PE multiples as of approximately October 2025.
Analysts cited “rising competitive intensity” from Grifols and Takeda, noting CSL would need “either higher volume growth or cost efficiencies” to sustain historic margin levels. — Bloomberg, 2 May 2026
The margin story will not resolve itself. It requires either genuine cost efficiency gains in Behring or evidence that Vifor’s revenue trajectory can outrun its integration costs.
Where CSL’s valuation sits now and what the analyst community thinks
At approximately 25x forward earnings, CSL no longer trades at a premium to global biopharma, which sits at roughly 21x forward PE. Among ASX healthcare peers, the picture is mixed: Cochlear trades above 30x, Sonic Healthcare at approximately 20x, and Ramsay Health Care in the high-teens.
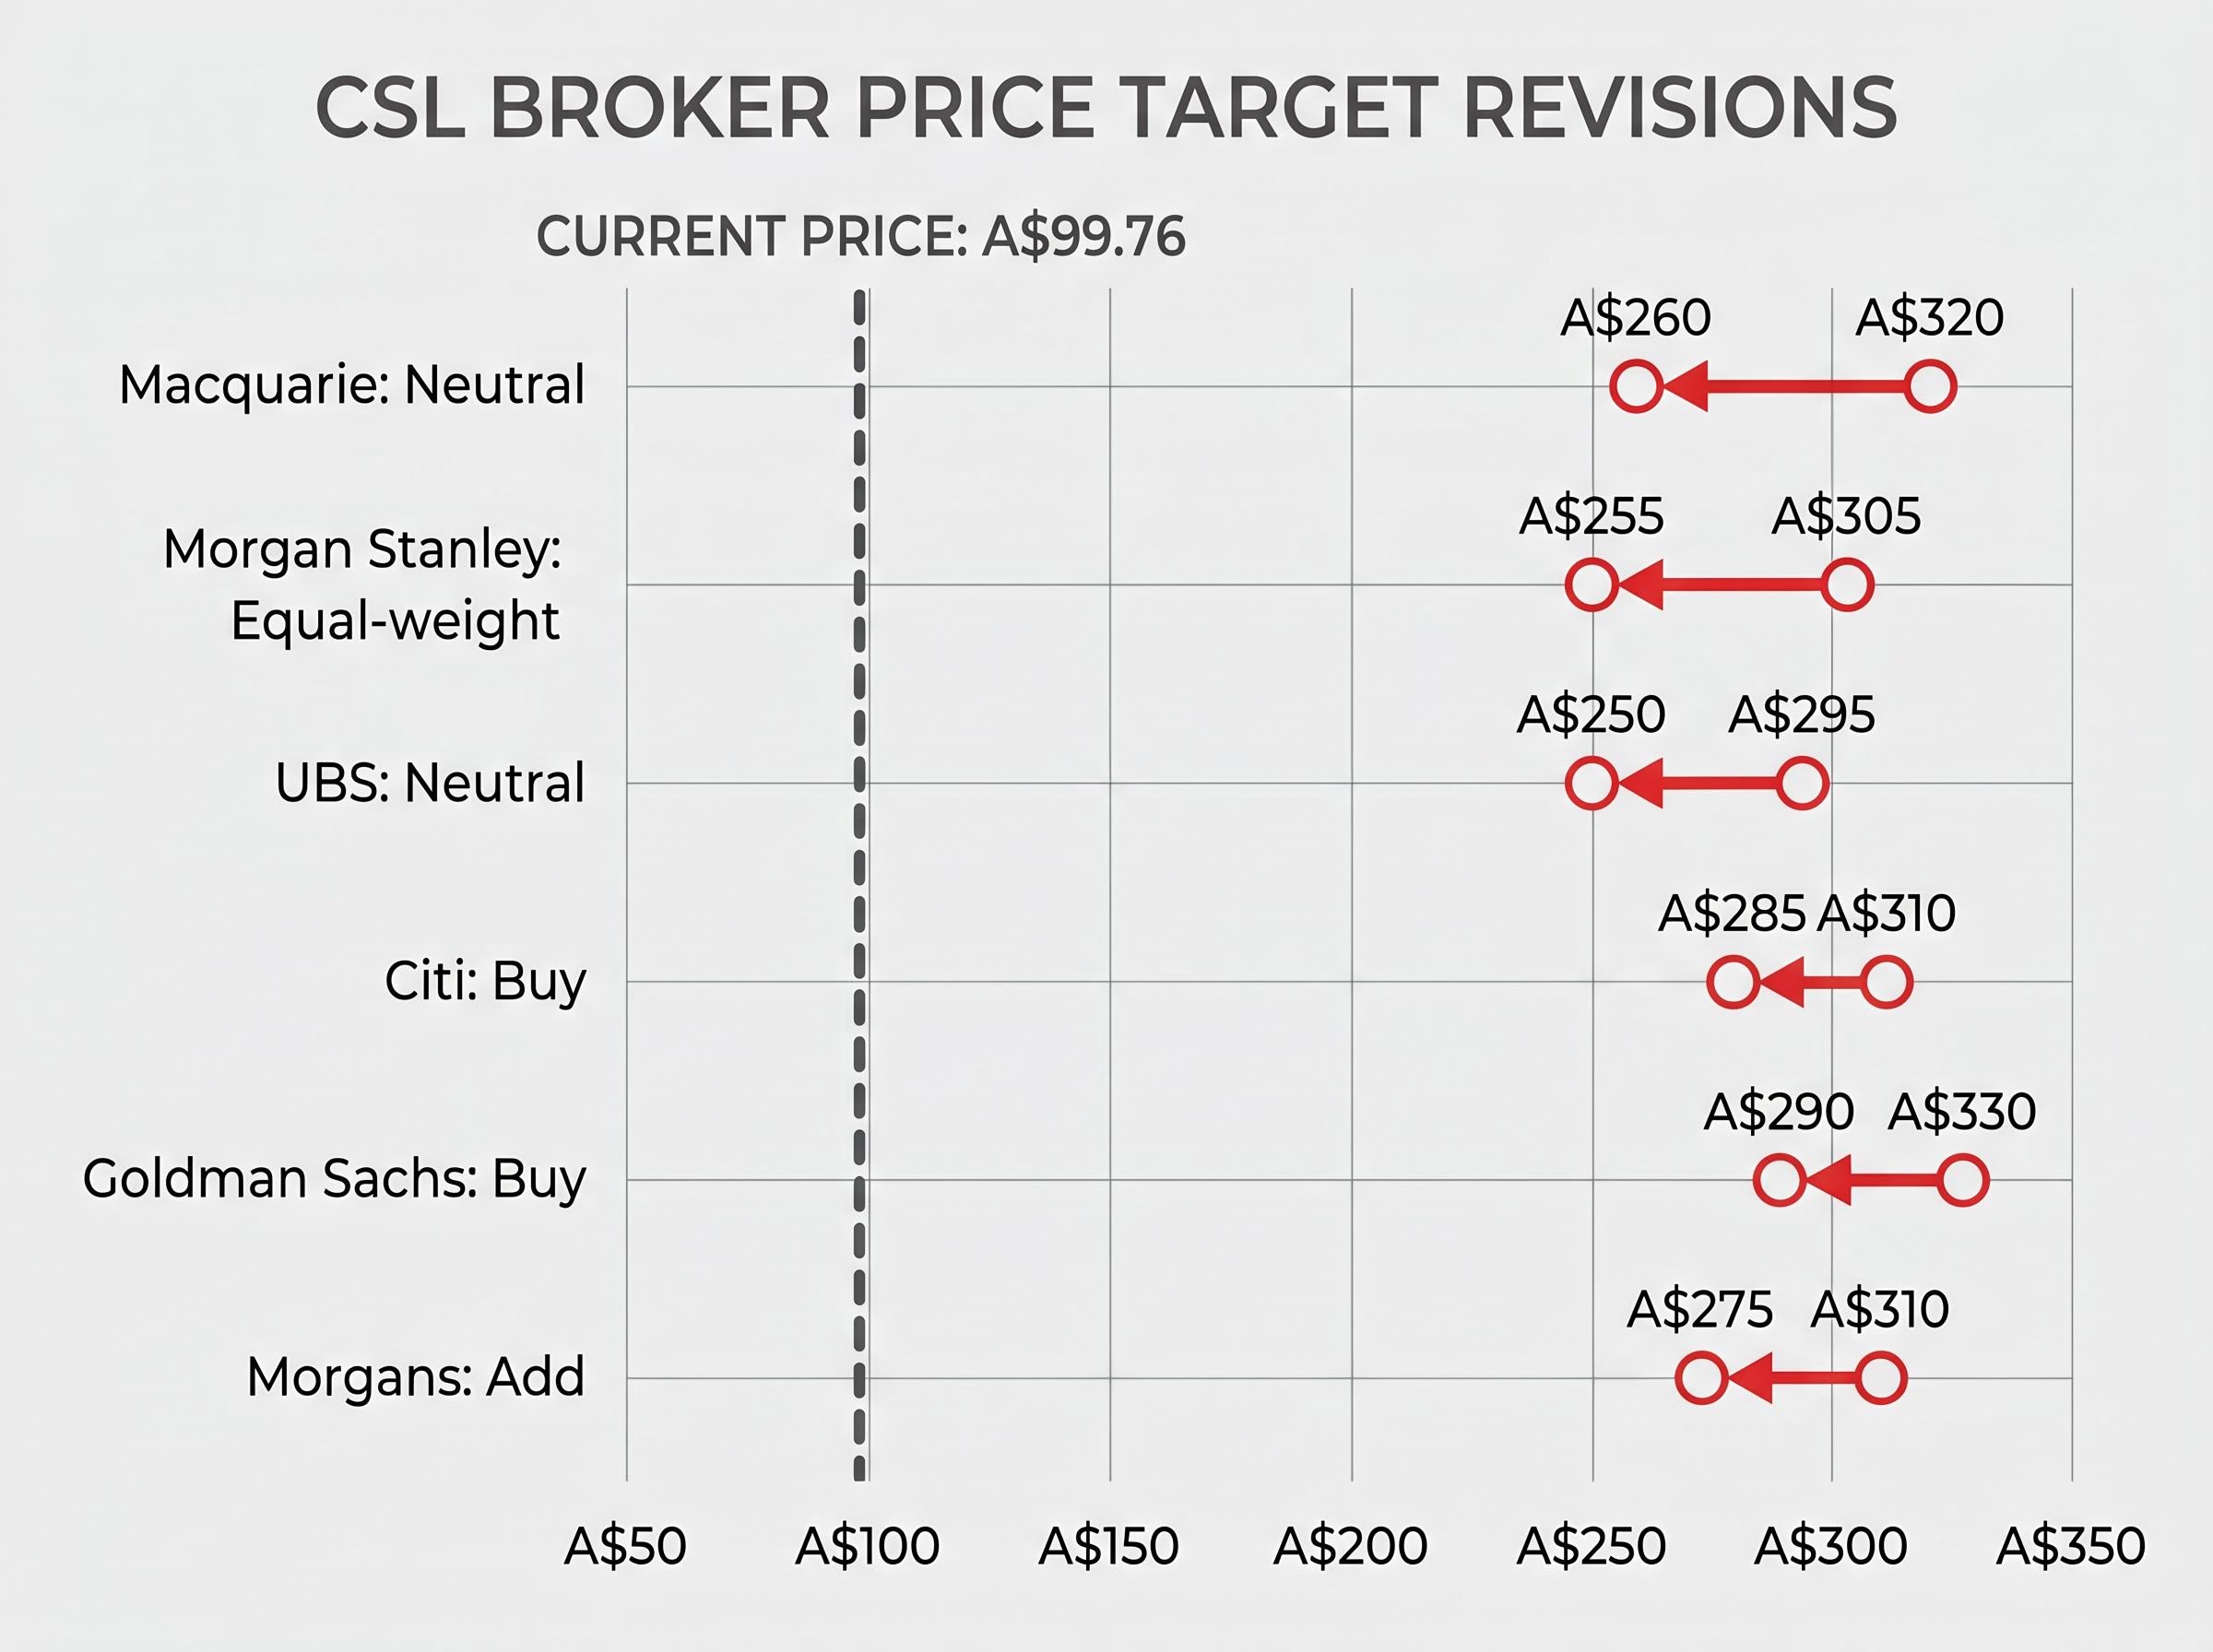
Six major brokers have published revised price targets, all substantially above the current share price:
| Broker | Rating | New Target | Prior Target |
|---|---|---|---|
| Macquarie | Neutral | A$260 | A$320 |
| Morgan Stanley | Equal-weight | A$255 | A$305 |
| UBS | Neutral | A$250 | A$295 |
| Citi | Buy | A$285 | A$310 |
| Goldman Sachs | Buy | A$290 | A$330 |
| Morgans | Add | A$275 | A$310 |
Every target implies at least 150% upside from the current price. That gap alone warrants scrutiny.
One healthcare-focused fund manager argued CSL was “starting to look interesting” on a mid-20s forward PE, but only “if management can execute on Vifor and pull Behring margins back towards pre-COVID levels.” — AFR, 9 May 2026
The counterpoint carries equal weight. Another fund manager stated plainly: “We’re not convinced yet. There’s still too much uncertainty around Vifor’s growth, and competitive dynamics in plasma are tougher than they used to be.” Professional investors with full access to management and detailed models are split. That disagreement is itself informative for retail investors trying to calibrate conviction at these prices.
Reading CSL as a framework for any large-cap healthcare stock
The six metrics used throughout this analysis apply beyond CSL. In the recommended order of application:
- Revenue and revenue CAGR to establish whether the business is growing and at what rate
- Gross margin to test the quality and durability of that growth
- Net profit and net profit CAGR to reveal whether costs are expanding faster than revenue
- Net debt and debt-to-equity to assess balance sheet flexibility and acquisition-related leverage
- ROE to measure how effectively the company converts equity into returns
- Peer comparison on forward PE and EBITDA margin to contextualise whether the stock’s multiple is justified
Why the revenue-profit divergence is the signal to chase
CSL’s 12.8% revenue CAGR alongside a 3.6% net profit CAGR is the worked example. When revenue grows more than three times faster than profit, something in the cost structure is absorbing the growth.
That divergence directs the next layer of investigation: Is the compression coming from acquisition integration costs? From competitive pricing pressure compressing margins? From rising input costs the company cannot pass through? In CSL’s case, all three are present simultaneously. Identifying the same divergence in another large-cap healthcare name provides a clear research path rather than a dead end.
The investment case at A$99.76: what the numbers support and what they do not
The analysis supports the view that CSL is a de-rated stock with quality underlying businesses. Behring remains the global leader in plasma-derived therapies, and a recovery case exists if plasma collection costs normalise over the medium term.
The analysis does not support treating the current price as an automatic value signal. Two conditions would need to be met for a genuine re-rating:
- Vifor ROIC improvement: Evidence that the acquired business can deliver returns that justify the acquisition premium, rather than continuing to dilute group ROE
- Behring margin normalisation: A credible path back toward pre-COVID margin levels, requiring either cost efficiency gains or volume growth sufficient to offset competitive pricing pressure
Two risk factors remain unresolved:
- Net debt of approximately A$10,526 million constrains capital management flexibility, limiting buybacks, special dividends, or further strategic acquisitions
- Competitive plasma dynamics from Grifols, Takeda, and generic iron therapy manufacturers show no signs of easing
Broker price targets range from A$250 to A$290, but these require independent verification of management’s ability to deliver on Vifor synergies and Behring margin recovery. The six metrics discussed here represent a starting point rather than a complete investment thesis.
CSL warrants a watchlist position for monitoring of FY26 full-year results and any further guidance revision, rather than an assumption that the current price represents resolved value.
This article is for informational purposes only and should not be considered financial advice. Investors should conduct their own research and consult with a licensed financial adviser before making investment decisions. Past performance does not guarantee future results. Financial projections are subject to market conditions and various risk factors.
—