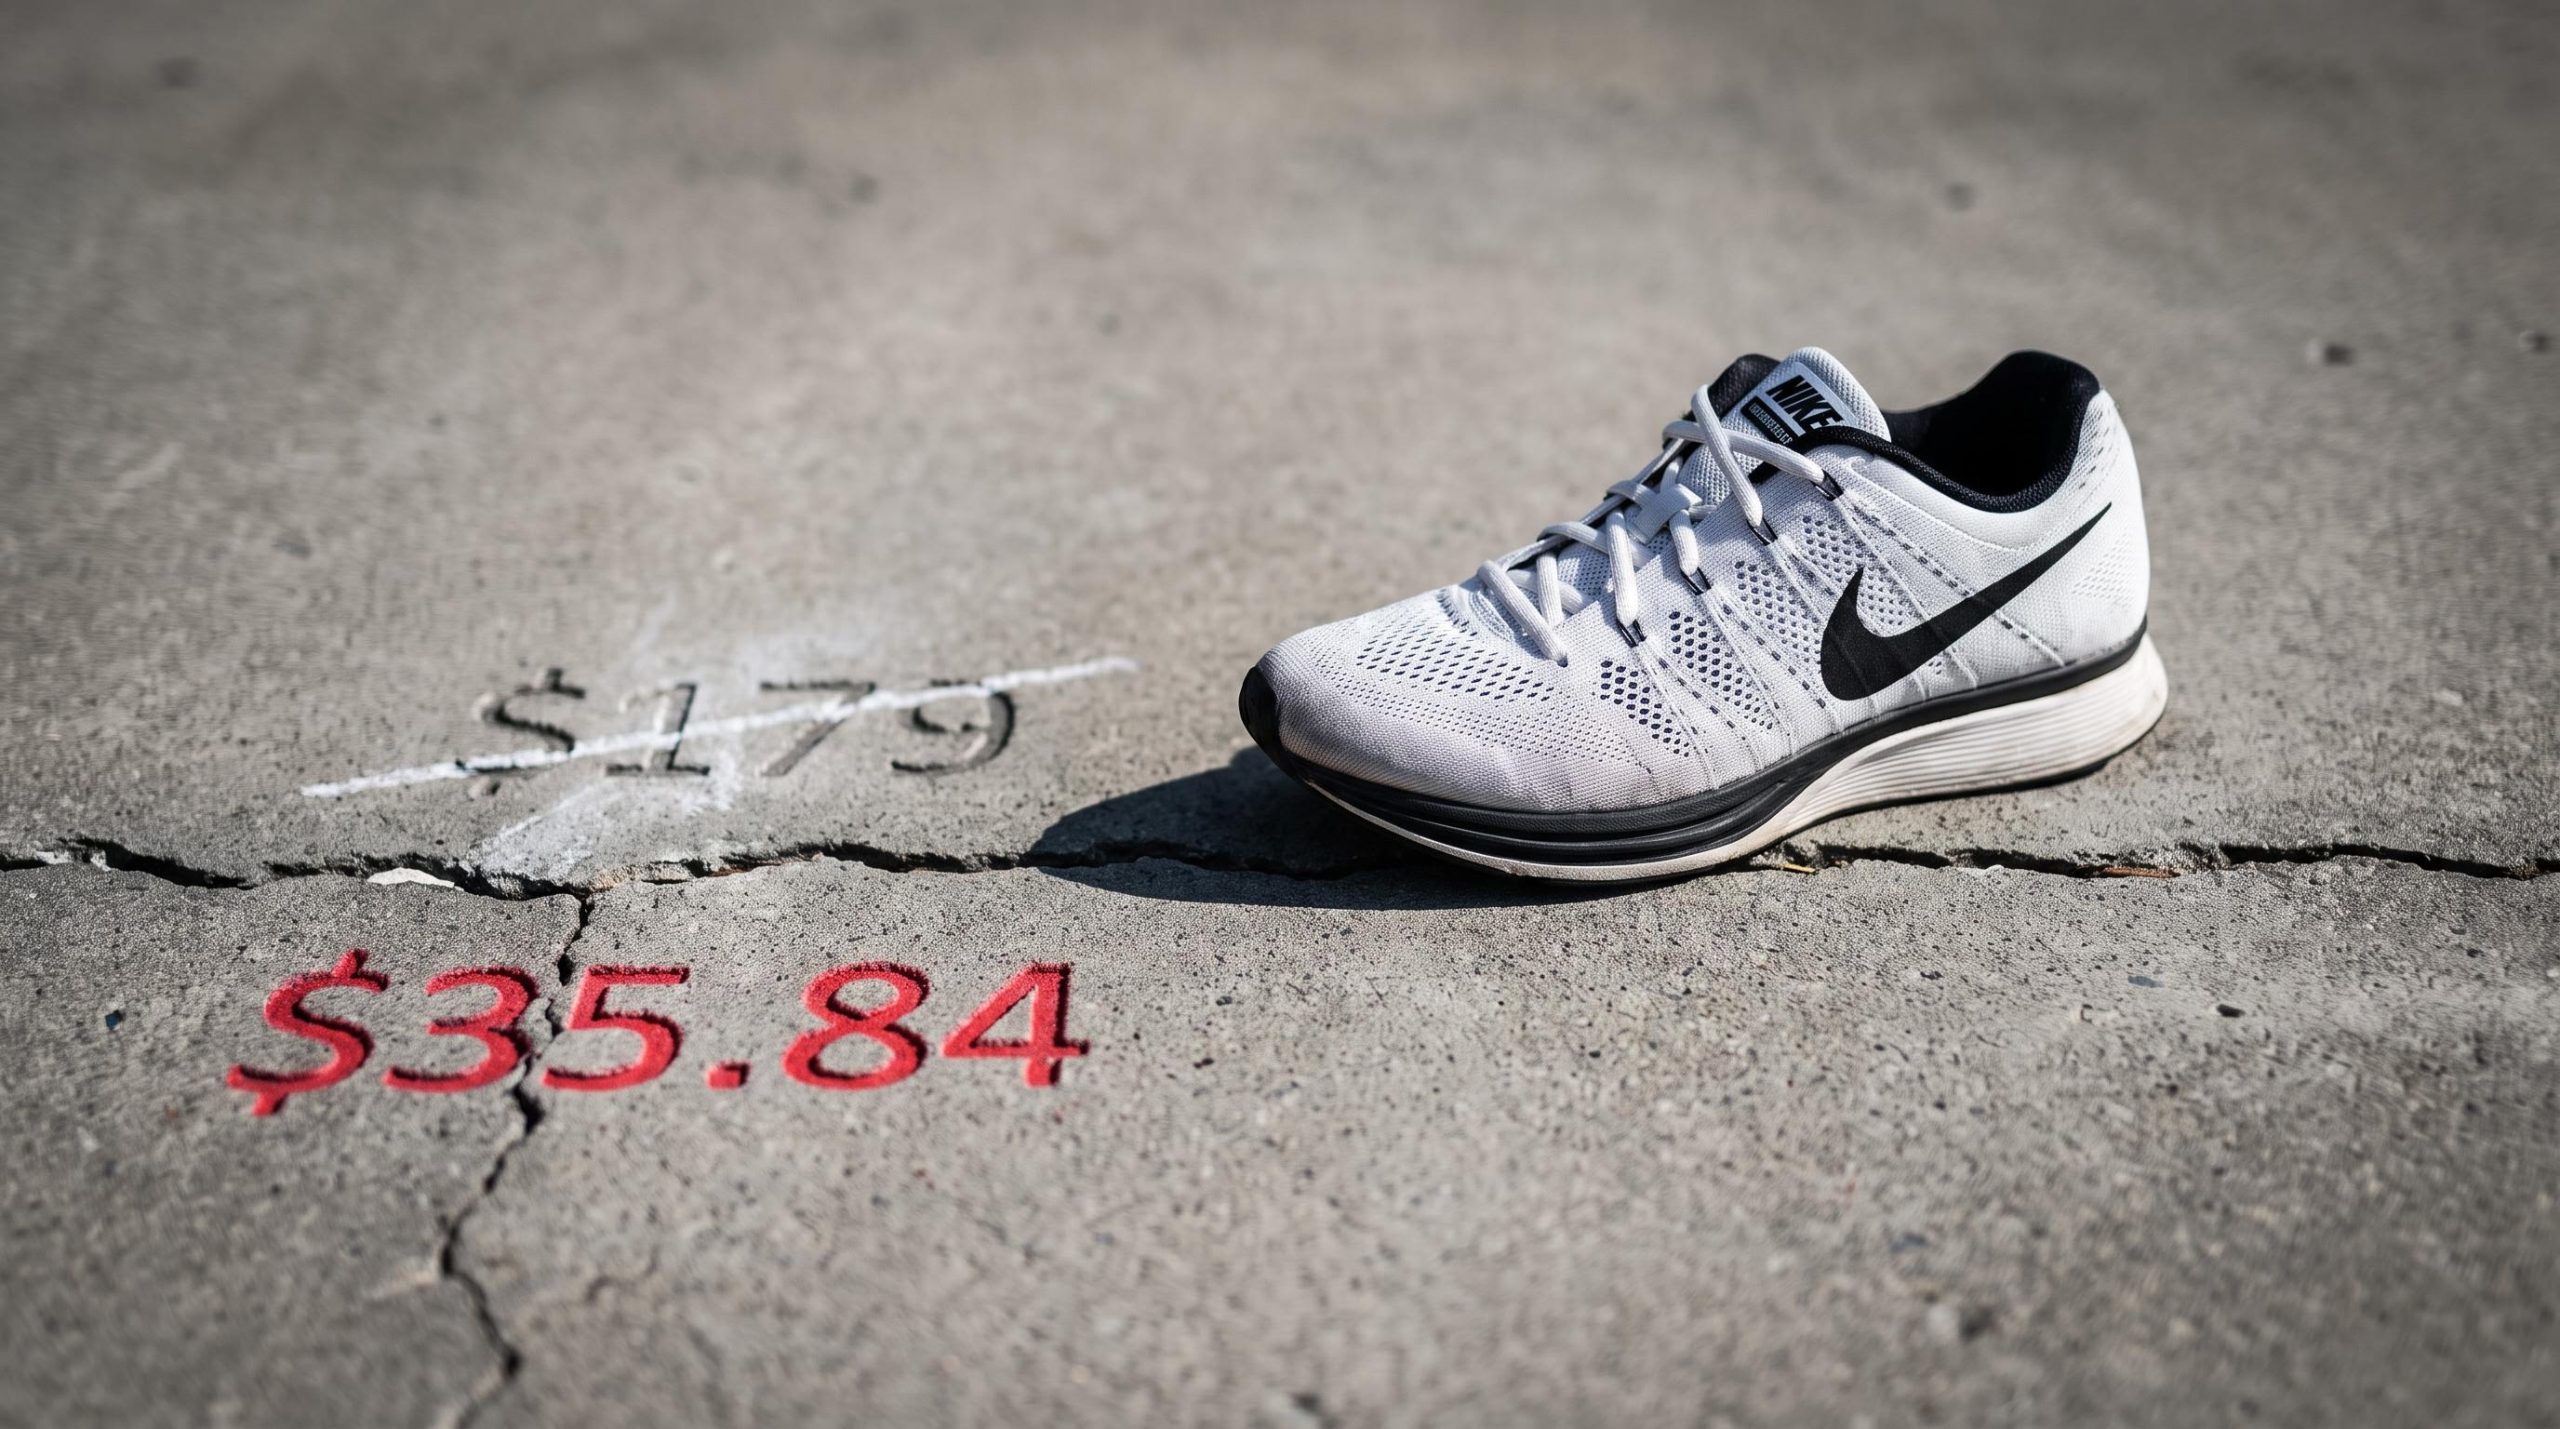
Nike has lost roughly 80% of its value, falling from an all-time high near $179 in November 2021 to just $35.84 at the close on 29 September 2026. That is not a correction. That is more than a decade of shareholder gains erased inside four years.
The question that matters now is not how bad the fall was. It is whether the price sitting in front of investors today reflects a misunderstood bargain or a permanent downgrade of what Nike is actually worth. The $35-36 zone is technically significant, last visited around 2014, and the professional community is split down the middle: Jefferies still carries a $75 target while HSBC just cut its own to $40. Despite the stock trading at multi-decade lows, September 2026 produced no broad upgrade cycle. That absence of conviction is itself worth reading closely.
Here is the framework for evaluating the two scenarios that could play out from here: Nike as a deep-value turnaround the market has over-punished, or Nike as a structurally impaired brand whose cheap price is fully justified. This analysis will not make the call for you, but it will hand you the specific variables that decide it.
What the $35 support level is actually telling investors
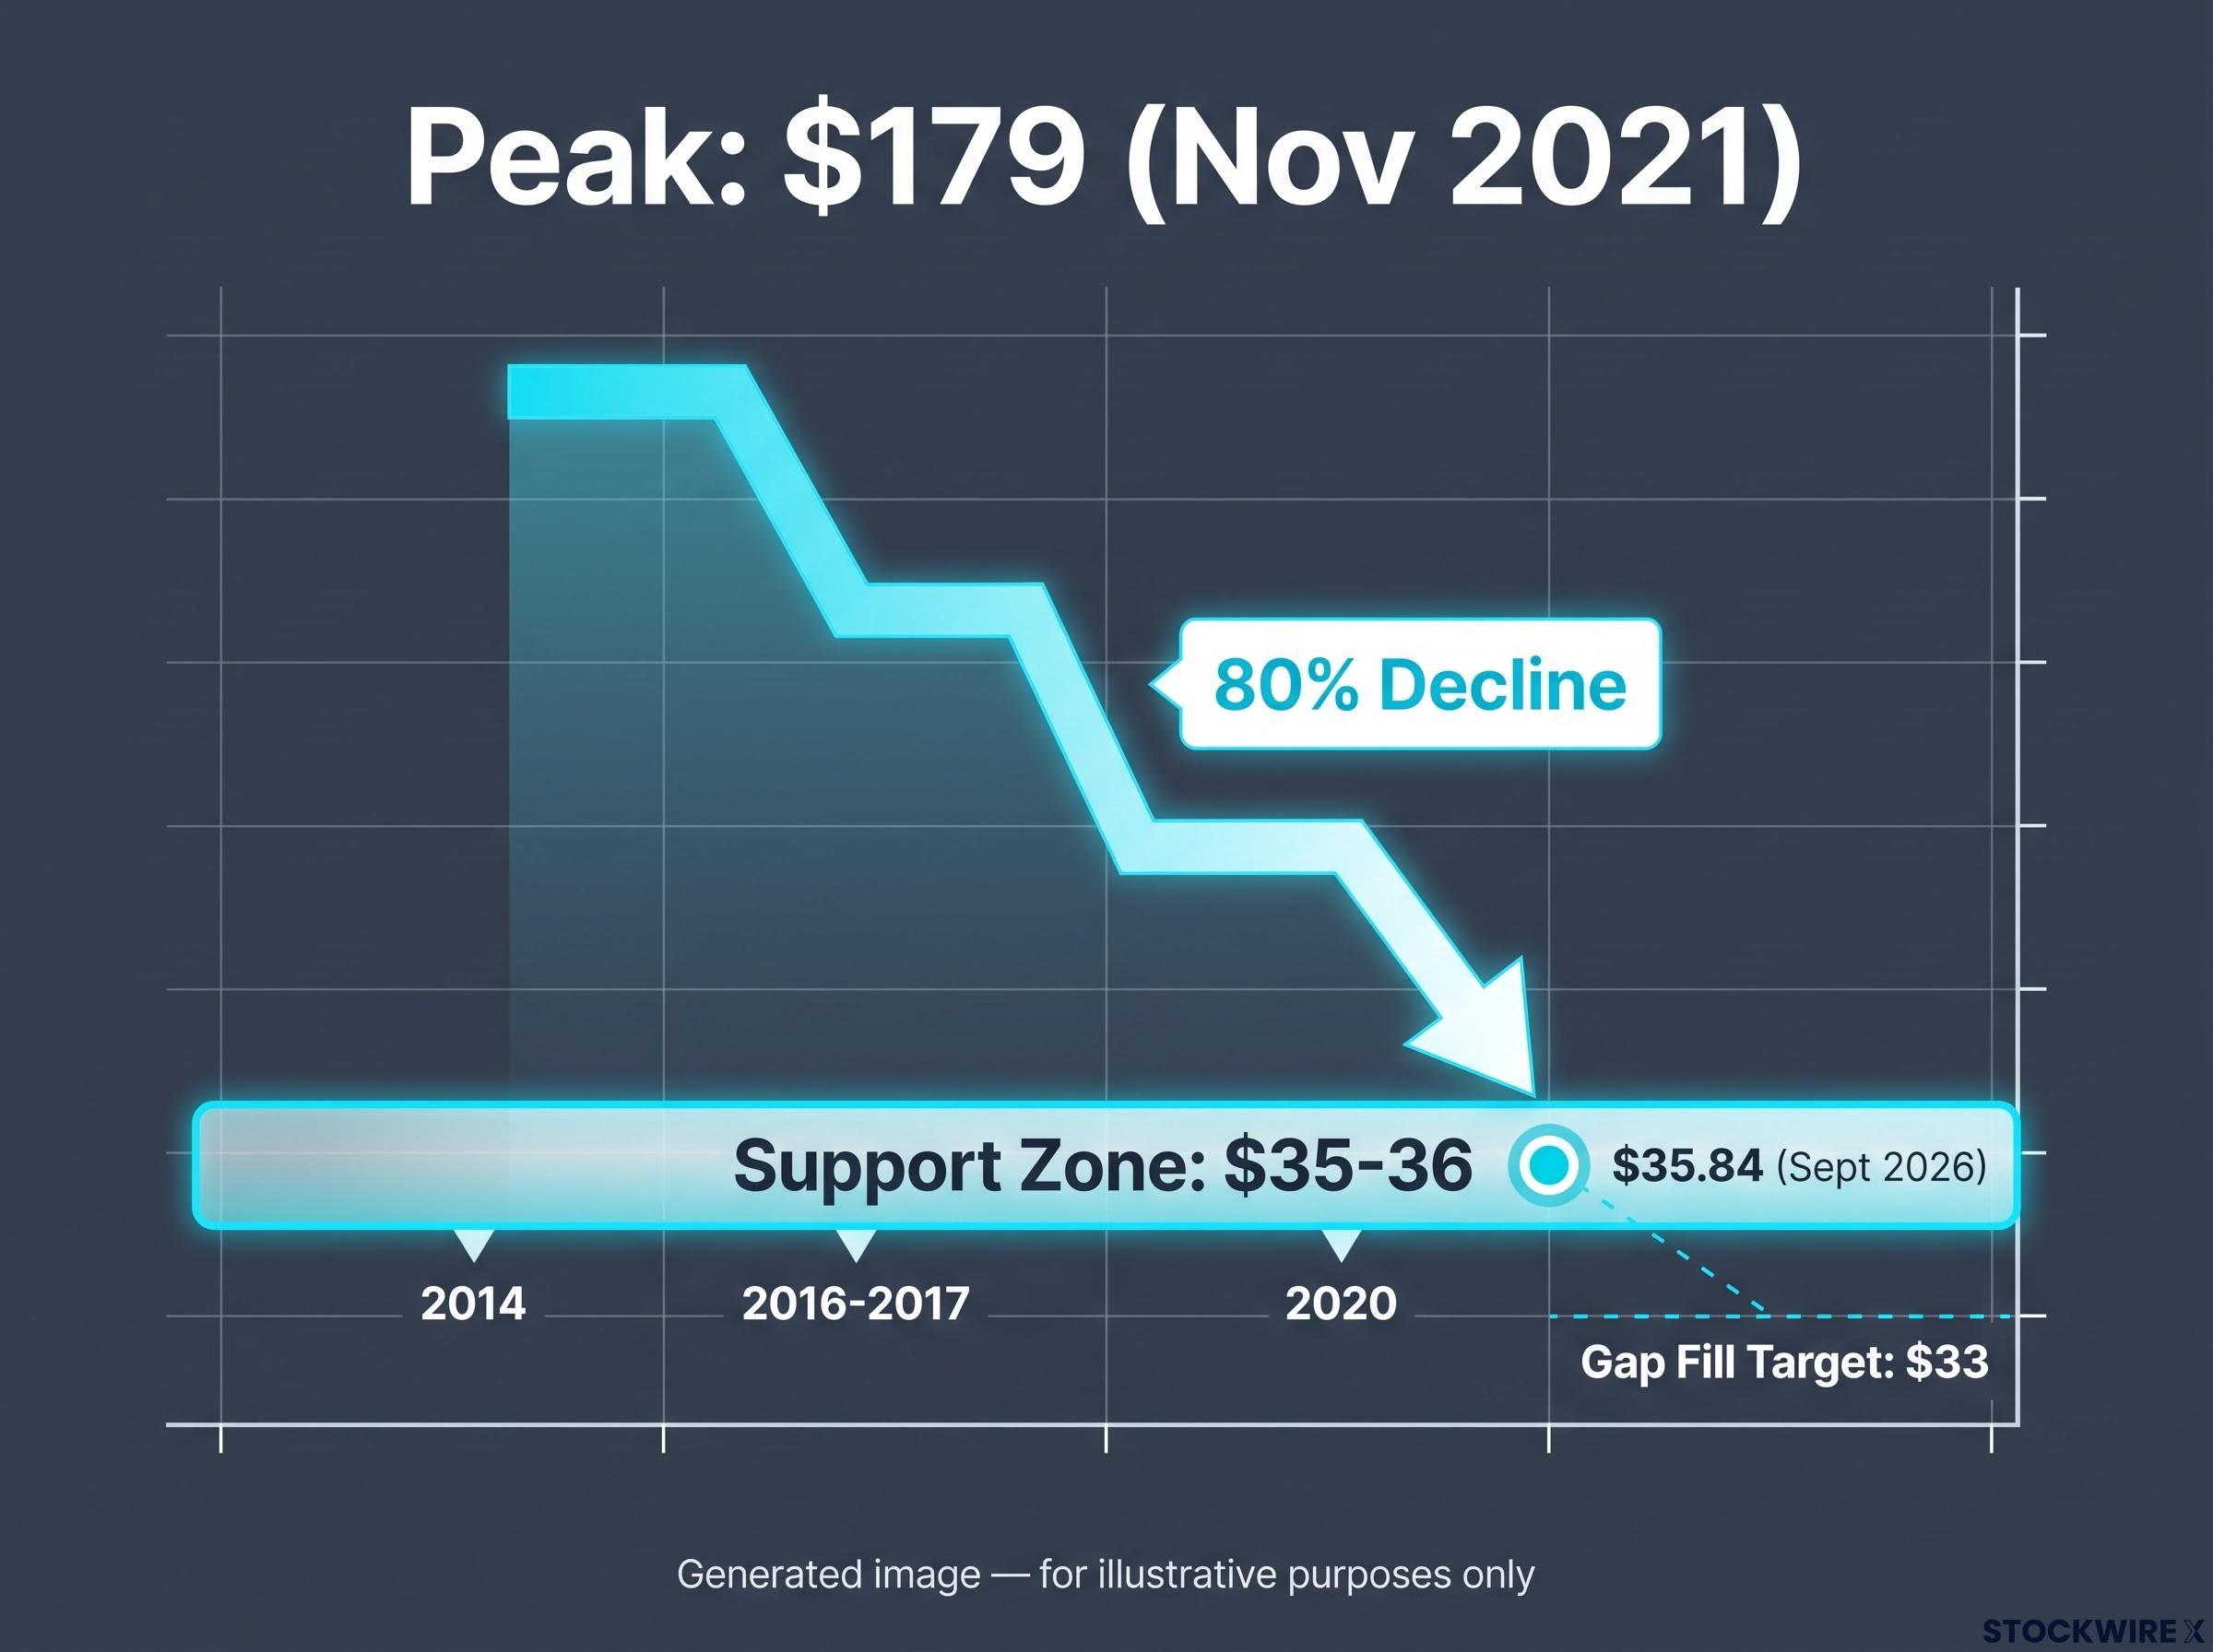
Start with the chart. Nike is trading at $35.84, and that number is not floating in empty space. It sits directly on a price band the stock has returned to repeatedly across more than a decade, which is what gives it weight.
The $35-36 zone first became relevant back in 2014, when Nike traded through these levels on its way up. It resurfaced as a reference point in 2016 and 2017, and it was tested again during the 2020 pandemic sell-off before the stock launched toward its $179 peak. A level that has acted as a floor and a marker across four separate periods is not an arbitrary round number. It is a memory the market keeps returning to.
Multi-factor technical confirmation requires at least two independent structural factors to converge on the same narrow zone before a level earns real analytical weight; the $35-36 band on Nike benefits from prior pivot history and a gap fill target at $33, but the absence of a validated trend line or volume-based confluence means the floor carries moderate rather than high structural credibility.
Here is how that history stacks up:
| Price Zone | Time Period | Technical Significance |
|---|---|---|
| $35-36 | 2014 | Origin level on the way up; first meaningful reference point |
| $35-36 | 2016-2017 | Retested as consolidation support during sideways trade |
| $35-36 | 2020 | Pandemic sell-off low before the run to the peak |
| ~$179 | November 2021 | All-time high; the starting point of the 80% decline |
The statistical anchor Nike has fallen approximately 80% from its $179 peak in November 2021 to $35.84 by late September 2026. That is the single number the entire debate revolves around.
The downside risk from here is specific rather than vague. If the $35-36 support breaks, technical analysis points to a gap fill target near $33, roughly 8% below the current price. That is not a catastrophic drop, but it is a defined next stop.
The 52-week range tells you where this sits in context: $35.22 to $76.97. The stock is pressed against the absolute floor of its past year, which is what makes this particular test structurally important rather than routine.
The fact that Nike is now testing a level that dates to 2014 tells you the stock has round-tripped more than a decade of gains. Whether that floor holds or breaks sets the near-term risk and reward for any position you take today. Hold it, and there is a defined base to build a thesis on. Lose it, and $33 becomes the next reference before the stock enters territory it has not seen in over a decade.
When big ASX news breaks, our subscribers know first
The business case against Nike: where the 80% decline came from
The decline was not one bad quarter. It was a sequence of problems that fed each other, and understanding that sequence is what separates a rational de-rating from a market overreaction you can profit from.
Start with the strategy that built Nike’s premium valuation in the first place. After 2021, management staked its narrative on direct-to-consumer selling: Nike Direct and Nike Digital were meant to be the growth engines that lifted margins and deepened the relationship with the customer. The current numbers do the opposite of confirming that.
Nike’s DTC pivot history and the specific inventory withdrawal decisions that preceded the channel mix breakdown are documented in detail across earlier quarterly reporting cycles, and the pattern of CEO share purchases alongside Q2 FY2026 North America stabilisation represents the earliest observable confirming signal that the wholesale re-engagement strategy may be gaining traction.
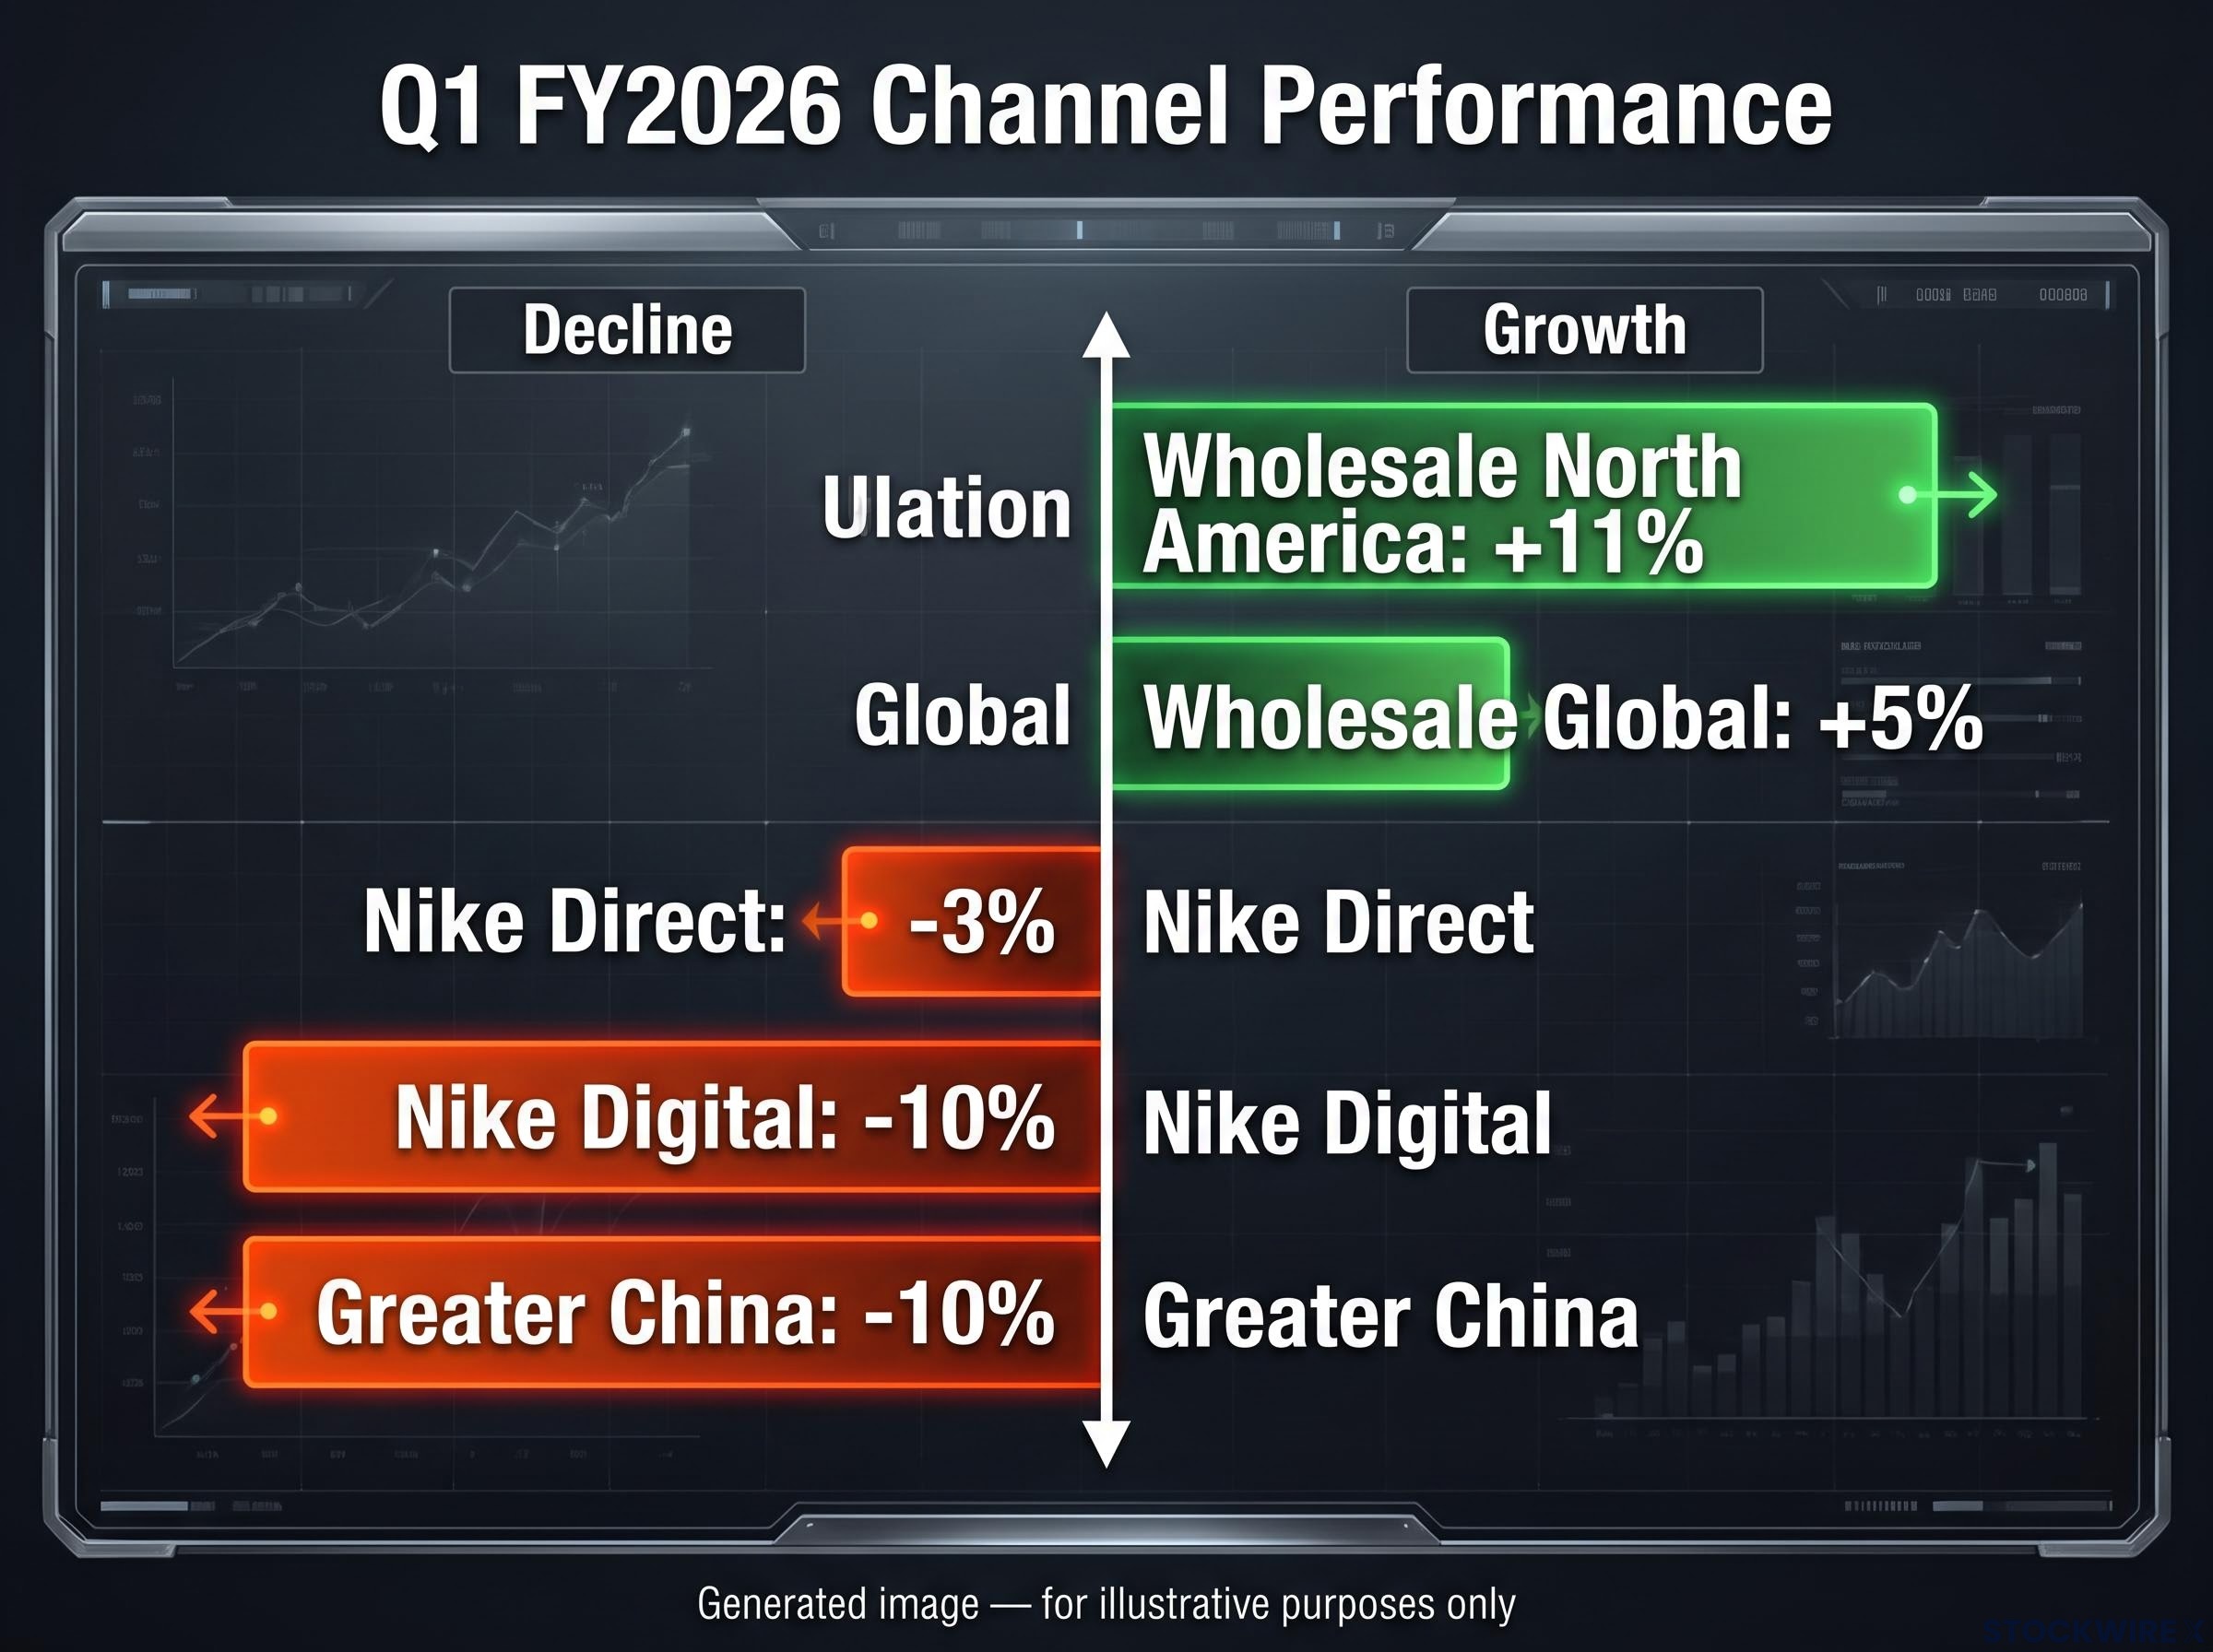
In the first quarter of FY2026, Nike Direct fell 3% and Nike Digital fell 10%. Meanwhile the channel Nike was trying to move away from, wholesale, grew: up 11% in North America and 5% globally. The premium channel is shrinking while the lower-margin channel expands.
| Channel | Q1 FY2026 Performance | Direction |
|---|---|---|
| Nike Direct | -3% | Declining |
| Nike Digital | -10% | Declining |
| Wholesale (North America) | +11% | Growing |
| Wholesale (Global) | +5% | Growing |
| Greater China | -10% | Declining |
This is where the margin damage becomes mechanical rather than incidental. Gross margin came in at 42.2% in Q1 FY2026, down 320 basis points year-over-year, dragged lower by heavier wholesale discounts, more markdowns in factory stores, rising product costs including new tariffs, and the channel mix shifting toward lower-margin sales.
The full-year picture shows how little that translated into growth. FY2026 revenue reached $46.40 billion, up a marginal 0.19%, while earnings of $3.11 billion fell 3.45% year-over-year. Near-flat sales paired with declining profit is not a profile that supports a premium multiple.
When the channel a company bet its entire premium on is shrinking, while the channel it was trying to exit is the one holding the business up, that is not a setback you simply wait out. That is a strategic thesis breaking, and the valuation compression that follows is arithmetic, not sentiment.
China and the competitive threat from domestic brands
China was supposed to be one of the reasons Nike deserved a premium. In Q1 FY2026, Greater China revenue fell 10%, and the cause is structural rather than a passing macro dip.
Domestic brands including Anta and Li-Ning have taken meaningful share, particularly among younger Chinese consumers whose purchasing increasingly leans toward home-grown labels. That is a durable shift in preference combined with genuine improvement in domestic product quality, not a temporary disruption that reverses when the economy improves.
There is a second competitive front entirely. On Running and Hoka have eroded Nike’s premium positioning in performance footwear, pulling a different cohort of consumers toward challenger brands. Combined with the erosion in China, the competitive picture explains why the market reassessed Nike’s long-term earnings power rather than treating this as a cyclical trough.
What analysts actually think: targets, splits, and what the disagreement signals
The operative fact about Wall Street’s view of Nike is that it has no strong view. The dominant consensus rating is Hold, which means the professional community is neither positioned for a rebound nor convinced the decline continues. It is explicitly undecided.
That indecision is visible in where the September 2026 revisions went. On one side, the constructive calls. Jefferies reiterated its Buy rating with a $75 target on 28 September 2026, citing an expected beat in Q1 FY2026 results. Days earlier, on 23 September 2026, BTIG raised its target to $55 and kept its Buy, pointing to turnaround progress and improving wholesale trends.
On the other side, the caution, and it clustered in the same week.
| Firm | Rating | Price Target | Change | Date |
|---|---|---|---|---|
| Jefferies | Buy | $75 | Reiterated | 28 Sep 2026 |
| BTIG | Buy | $55 | Raised | 23 Sep 2026 |
| Barclays | Overweight | $48 | Cut from $52 | Sep 2026 |
| UBS | Neutral | $42 | Cut from $48 | 17 Sep 2026 |
| HSBC | Neutral | $40 | Cut from $48 | 28 Sep 2026 |
Across the major consensus platforms, between 36 and 42 analysts are tracked, with average targets landing in the mid-to-high $40s, roughly $46.32 to $47.74. The active target range runs from a low near $23 to Jefferies’ $75 at the high end.
The $23-to-$75 analyst spread on Nike is itself an analyst spread signal worth reading carefully: spreads this wide historically reflect genuine structural uncertainty rather than simple disagreement about timing, and the direction of recent revisions, uniformly downward from UBS, HSBC, and Barclays, compounds that uncertainty.
The implied upside The consensus average sits around $46-$47 against a current price of $35.84. That gap implies roughly 30-35% upside if the average target is right.
Here is the part that deserves more weight than the bullish outliers. HSBC, UBS, and Barclays all cut their targets in the same month the stock was testing multi-decade support. When multiple major institutions lower expectations at exactly the moment a stock reaches its floor, the message is that the smart money is not stepping in front of this decline with conviction. The direction of the revision often tells you more than the level of the target itself, and the direction here is down.
Deep value or value trap? The variables that will decide it
Both sides of this debate are genuinely defensible, which is precisely why the stock sits where it does. The bull and bear cases are not a false balance. They are two coherent frameworks competing over the same evidence.
The bull case, at its strongest, rests on durability and solvable mistakes:
- Nike remains a globally recognised brand with distribution and product capability that do not vanish because of a few bad quarters.
- Q1 FY2026 revenue of $11.72 billion beat the $10.97 billion consensus, showing the company can still surprise to the upside at the headline level.
- Operational levers remain available: channel mix recalibration, inventory normalisation, and cost discipline.
- Consensus targets imply 30-35% upside, with Jefferies and BTIG seeing $55-$75, a case that the market has over-penalised fixable execution errors.
The bear case, at its strongest, rests on trajectory rather than valuation:
- FY2026 earnings fell 3.45% on essentially flat revenue, a profile that does not justify multiple expansion.
- Both Nike Direct and Nike Digital are shrinking, directly contradicting the strategic story management spent years selling.
- Gross margin at 42.2%, down 320 basis points, is compressing for structural channel-mix reasons that do not obviously self-correct.
- No broad institutional upgrade cycle is visible; the revisions in September 2026 moved the other way.
The honest reading at current prices is that Nike is neither obviously cheap nor obviously a trap. It is a high-conviction bet on management executing a reversal the market has not yet credited them for, and the question is whether the evidence warrants that bet before the next earnings catalyst.
The four variables that will separate recovery from value trap
Rather than force a binary call, treat this as a watching brief. Four observable variables will resolve the debate over the coming quarters:
- Nike Direct quarterly trend. Any stabilisation or return to growth is the single most important confirming signal for the bull case. It is the channel the entire premium thesis was built on.
- Gross margin trajectory. Recovery toward 44-45% would signal the channel mix is healing. Continued compression below 42% validates the bear case that the damage is structural.
- China revenue. Stabilisation versus continued double-digit decline determines whether the threat from Anta and Li-Ning is cyclical or permanent.
- Nike Digital direction. This is the most sensitive leading indicator of whether the direct-to-consumer pivot is salvageable or has been quietly abandoned.
If those four turn, the deep-value thesis earns its credibility. If they keep deteriorating, the $33 gap fill stops being a floor and starts being a waypoint.
What the evidence argues for at $35, and what it demands from here
Pulling the technical, fundamental, and analyst evidence together produces one directional assessment: Nike at $35-36 is a high-risk turnaround idea carrying genuine value-trap risk, not a clear deep-value bargain.
The support level is real. It has held across four periods since 2014, and that history matters for near-term price behaviour. But a technical floor does not manufacture intrinsic value if the business keeps deteriorating beneath it. The chart buys time; it does not fix margins, revive Nike Digital, or reverse the China decline.
The asymmetry is worth stating plainly. Upside to $47-$75 represents roughly 30% to 110% if the turnaround is genuine. The downside to $33 is only about 8% away and technically defined, but any break below that enters territory the stock has not seen in over a decade, where no clear reference exists.
Investors wanting to stress-test the bull, base, and bear return scenarios at a quantitative level will find our full valuation scenario analysis for Nike, which models the specific revenue growth rates and margin recovery assumptions that separate a 100% five-year return from breakeven.
The next Q1 FY2027 earnings release is the clearest near-term test of whether the operational levers management claims to hold are actually being pulled. Until Nike Direct stabilises and gross margin turns, the burden of proof sits with the bulls.
This article is for informational purposes only and should not be considered financial advice. Investors should conduct their own research and consult with financial professionals before making investment decisions.
Past performance does not guarantee future results. Financial projections are subject to market conditions and various risk factors, and forward-looking statements are speculative and subject to change based on market developments and company performance.