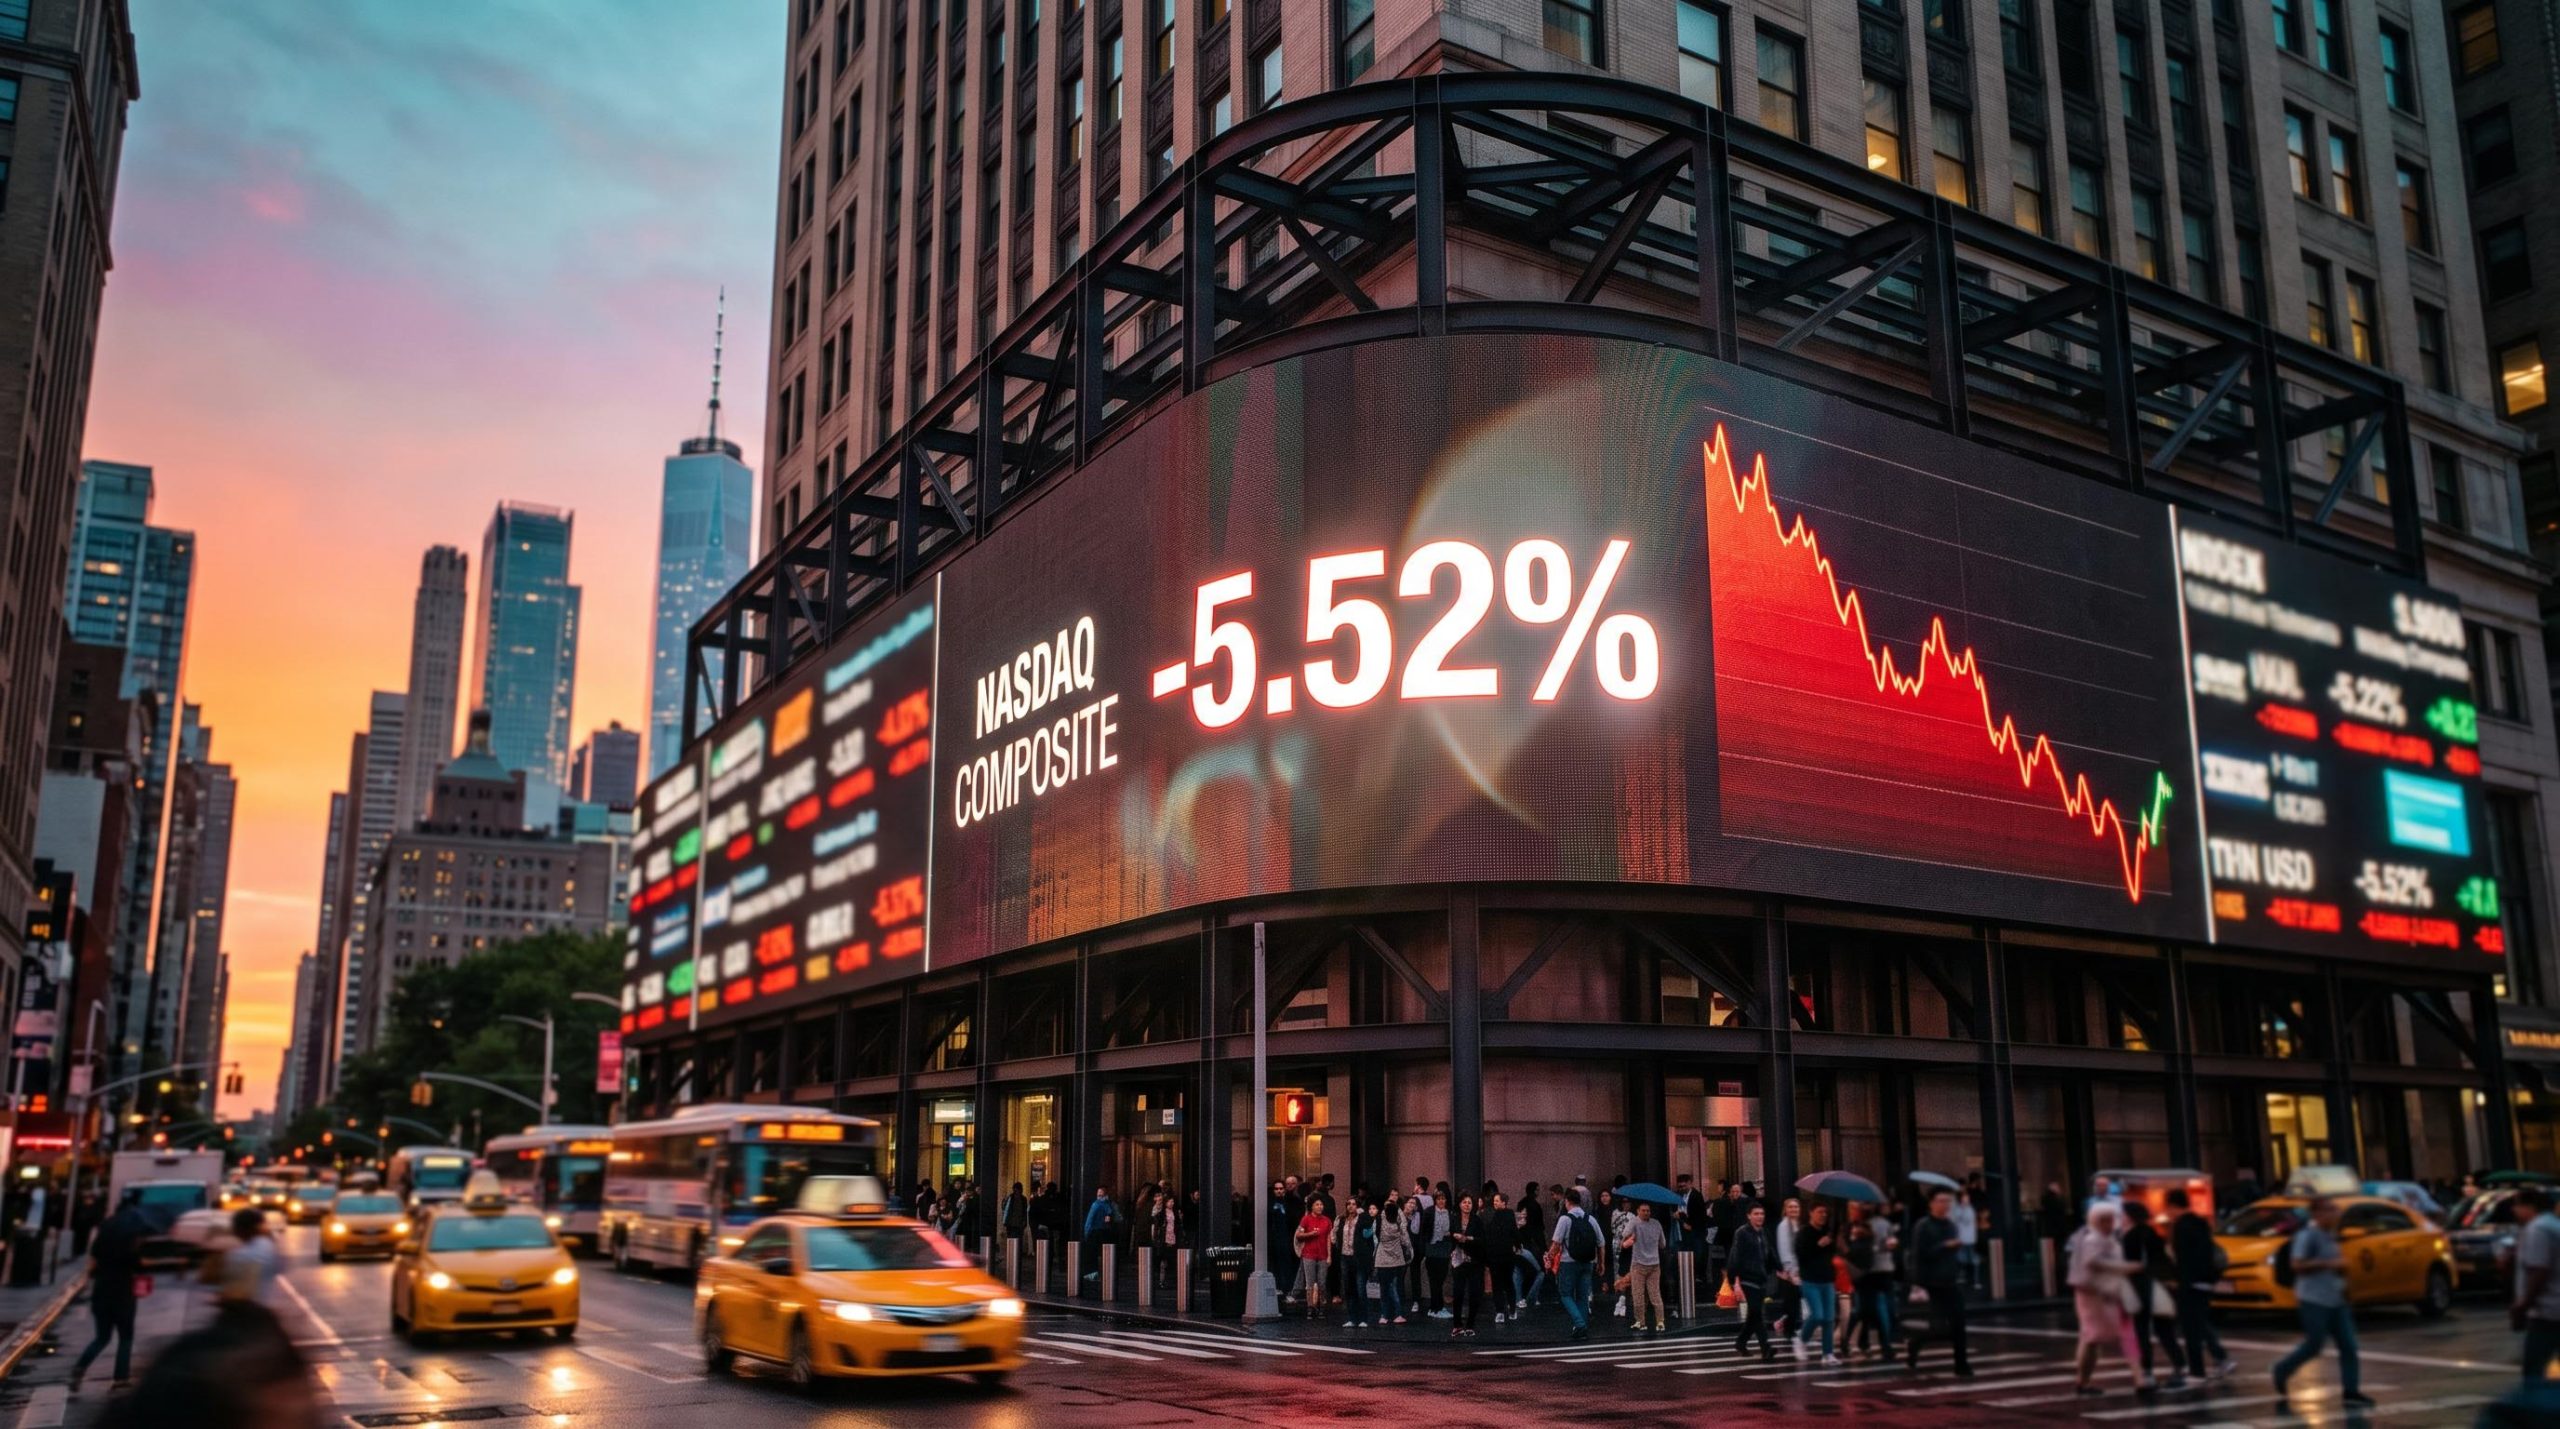
Last Thursday, 5 November 2026, the Nasdaq Composite fell 5.52% and slipped into correction territory. On Monday it bounced 2.74%, the kind of headline gain that suggests the worst has passed. Yet that rebound recovered only part of the damage, and Nvidia kept falling through it.
A one-day rally does not answer the question a Nasdaq correction raises. It mostly tells you that buyers were willing to step in, not that the reasons for selling have gone away.
The question matters for Australians because AI-linked stocks carried much of the global rally. A sell-off concentrated in a handful of US names reaches local portfolios, even though the ASX holds little direct mega-cap AI exposure. That gap showed up last week: the ASX 200 hit an 11-week high on 10 November while US technology stocks were still in correction.
This piece covers three things: what drove the fall, how much hidden AI exposure your super and ETFs may carry, and which dates over the coming month will test the AI trade.
What triggered the Nasdaq correction, and why the rebound settled so little
The numbers moved fast. On Thursday the S&P 500 dropped 4.36% to 7,353.73, its worst session since April 2025, according to Reuters, CNN and CNBC. The Nasdaq fared worse, falling 5.52% to 24,315.00. That left it more than 10% below its 6 October record close of 27,599.89, which is the standard definition of a correction.
Then came Monday.
| Index | 5 Nov move | 5 Nov close | 9 Nov move | 9 Nov close |
|---|---|---|---|---|
| S&P 500 | -4.36% | 7,353.73 | +2.35% | 7,549.94 |
| Nasdaq Composite | -5.52% | 24,315.00 | +2.74% | 25,253.14 |
The rally spread across technology, industrials and other sectors, and US shares posted their strongest gains in months. By StockWire X’s calculation, though, the Nasdaq still closed about 8.5% below its record. The correction was never reversed.
Depth alone does not separate a correction or bear market, since every historical episode passed through the same first 10%; trend line breaks and trailing stop tools give a sharper read on which path is unfolding.
Nvidia went the other way. It closed at US$178.67 on Monday, down 4.27%, well short of its October intraday record above US$243. On 8 November its board announced an independent investigation after reports that CEO Jensen Huang was the target of a foreign-intelligence effort, while saying it had no reason to believe company secrets or national security were compromised.
Two worries behind the sell-off
The first worry is regulation. Democratic gains in the US midterms raised the prospect of tougher rules, permitting limits or outright moratoriums on new data centres. Goldman Sachs reportedly estimated moratoriums could affect up to 45% of planned US data-centre capacity, a figure that has not been independently confirmed.
The second worry is returns. Big tech was reportedly expected to spend around US$800 billion on AI infrastructure in 2026, also unconfirmed. Invesco pointed out that data centres need heavy capital, power and costly equipment, so higher financing costs shrink the number of projects that clear their hurdle rate (the minimum return a project must earn to justify its cost).
Two linked worries, one partial bounce. That pattern tells you the selling had more than one cause, so treat this correction as an open question until both the regulatory and spending concerns are answered.
When big ASX news breaks, our subscribers know first
Why AI stocks matter to Australian portfolios, even without owning Nvidia
The comforting view is that Australia sat this out. The ASX has a small technology sector, and BetaShares described that low AI exposure as helping deliver a “Steve Bradbury” result in October, with the local market finishing ahead as others stumbled. Easing oil prices then pushed the ASX 200 to its 11-week high on Tuesday.
That insulation only covers what you hold on the ASX. It does nothing for what you hold offshore.
Reported estimate: AI exposure in Australian households RBA staff estimated AI-related equities made up 5.3% of household financial wealth in June 2026, up from about 2% at the end of 2022, mainly through super and indirect investments. A 30% fall in those stocks could cut household wealth by about 1.6%. This estimate has been reported but not independently confirmed.
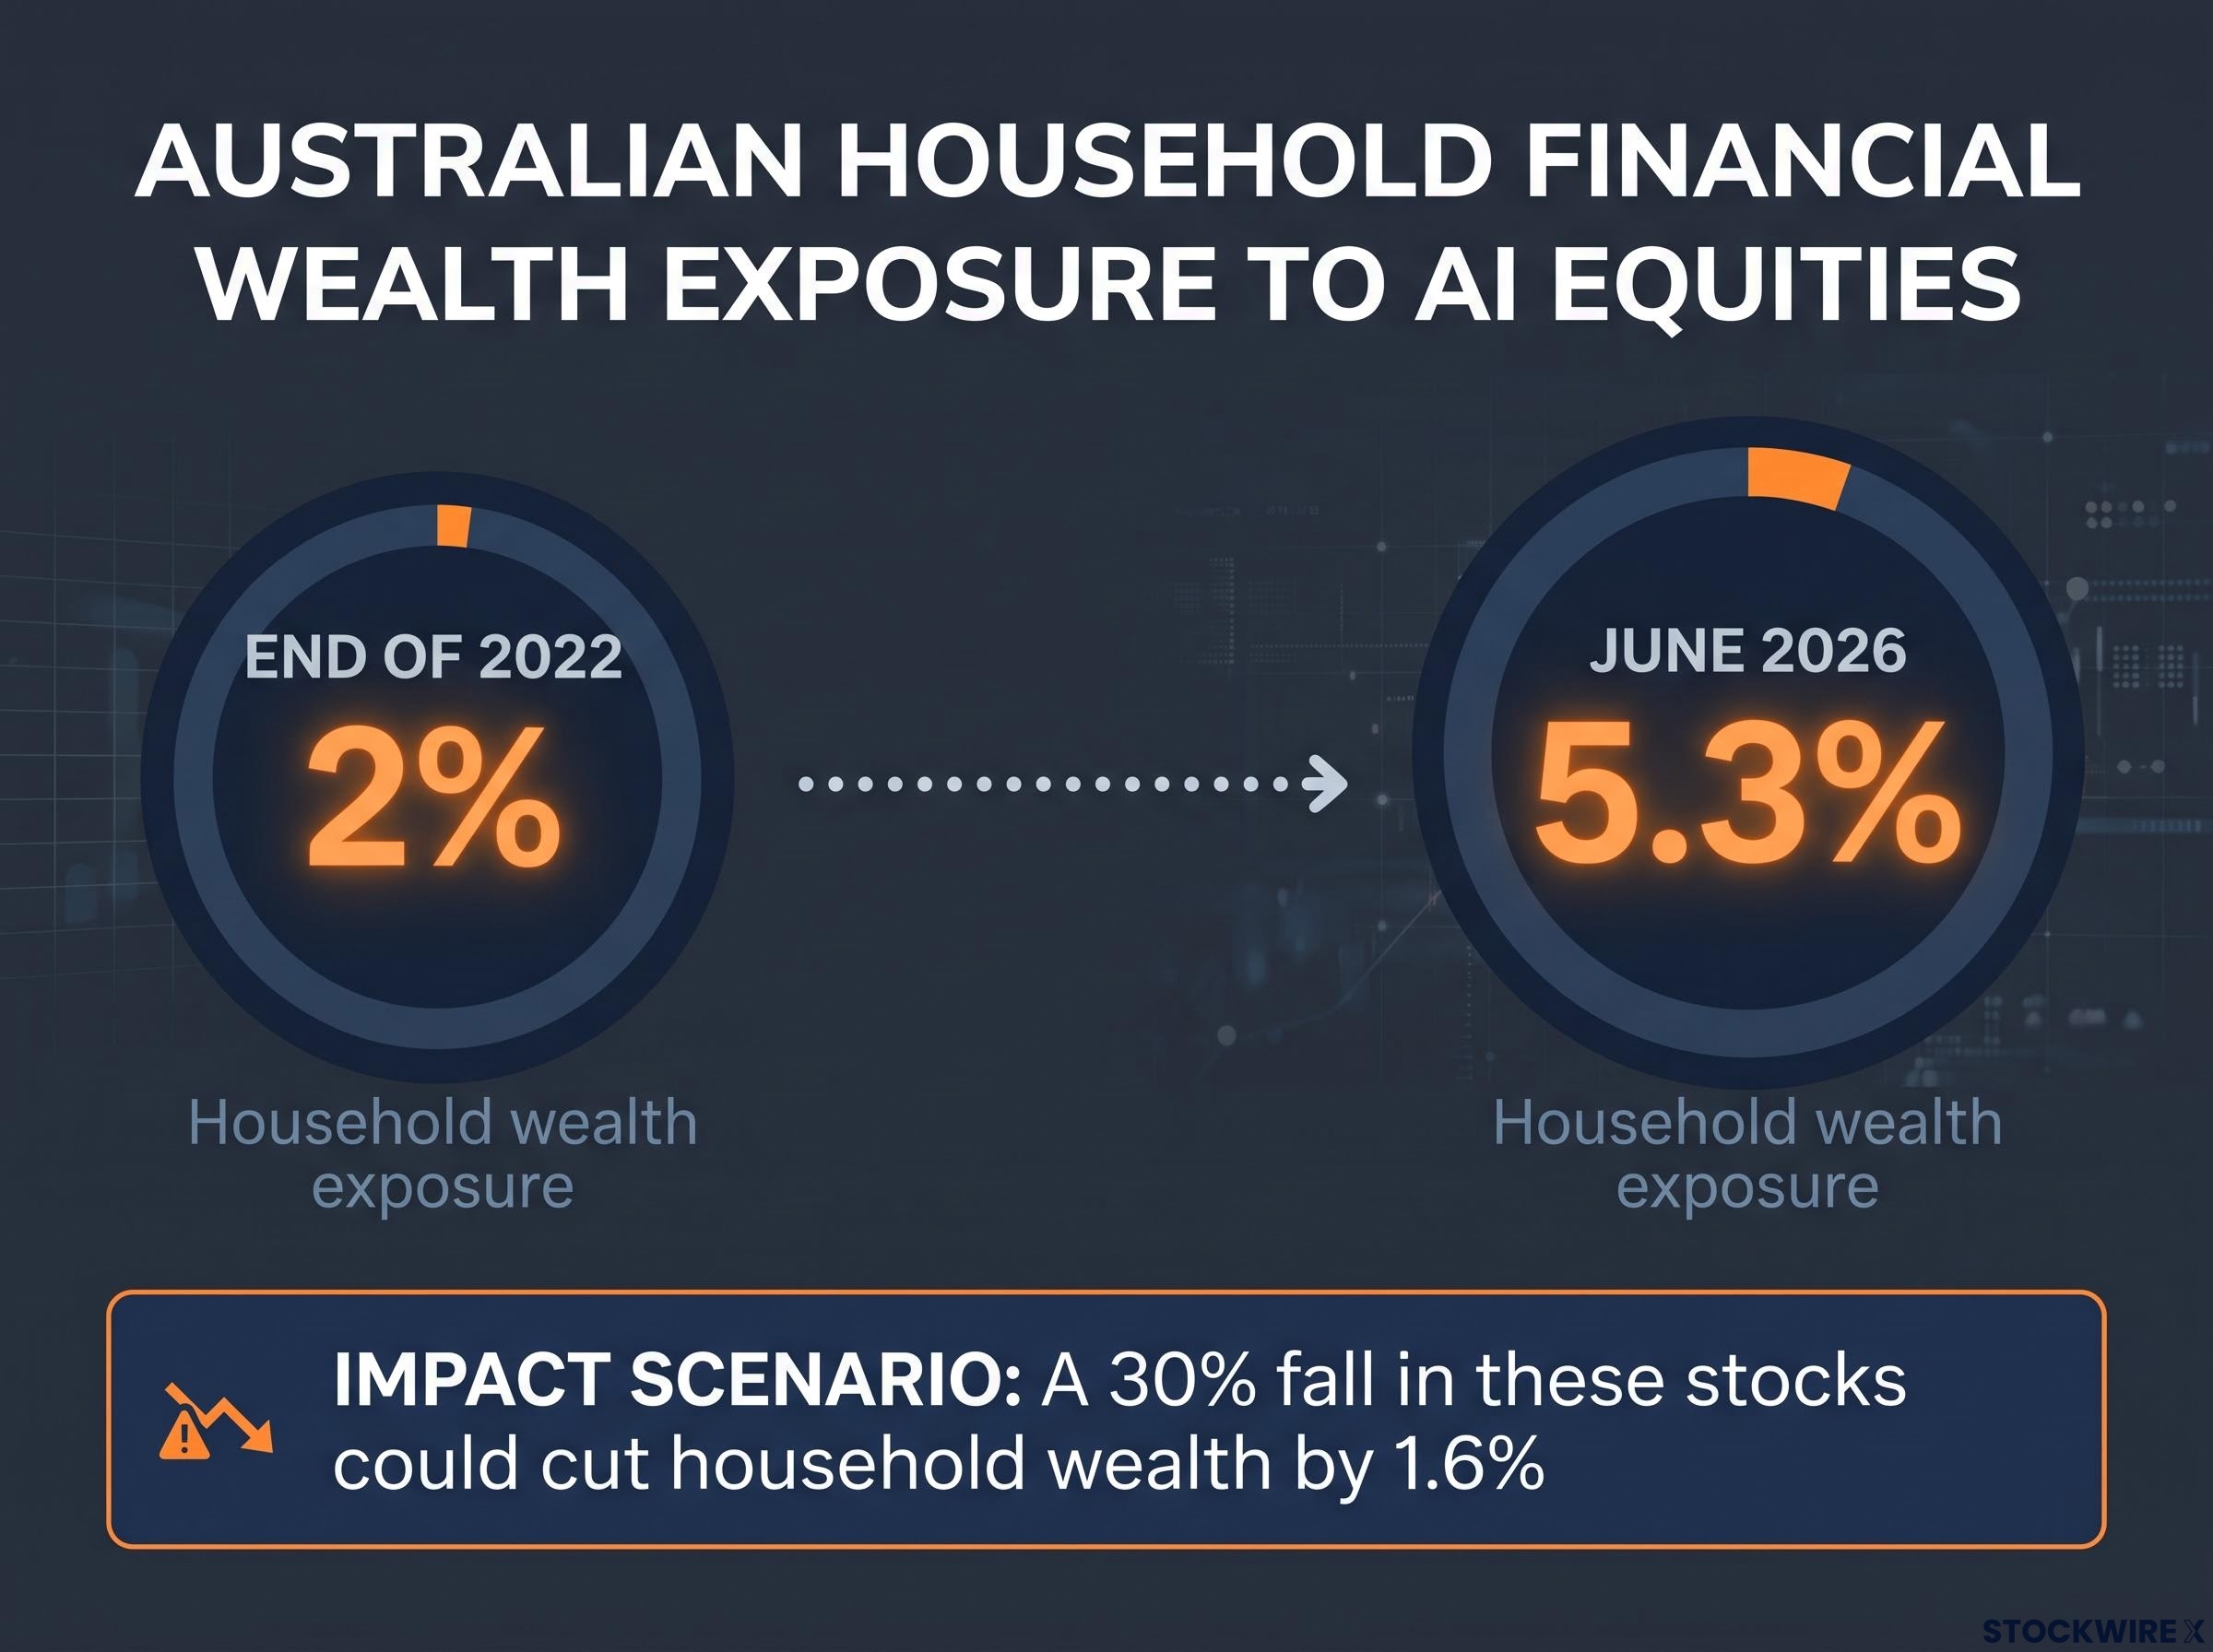
Australian household wealth exposure to AI grew from 2% at the End of 2022 to 5.3% by June 2026, where a 30% fall could cut total wealth by 1.6%.
The channels are mostly indirect: global ETFs, international options inside super, US-dollar assets, and Australian suppliers of electricity, engineering, mining and copper to data-centre builders. AustralianSuper’s Mark Hargraves reportedly said AI and AI-related stocks reached roughly 40% of the global equities market (unverified). Principal Asset Management’s Magdalena Ocampo has reportedly warned that cap-weighted indices, which size each holding by its market value, grow more sensitive to a narrow group of firms as those weights rise (also unverified).
Super concentration risk is a structural feature of benchmark-driven funds, with a balanced option estimated to carry roughly 7-14% in AI-linked US technology because market-cap weighting hands the biggest companies the biggest slice.
This is where the difference between real and apparent diversification counts.
| Feature | True diversification | Apparent diversification |
|---|---|---|
| Economic drivers | Holdings respond to different forces | Holdings respond to the same AI spending cycle |
| Asset classes | Shares, bonds and other assets | Mostly shares under different fund labels |
| Regions | Spread across markets with different leaders | Global funds dominated by US mega-caps |
| Cash flows | Earnings from unrelated sources | Earnings tied to the same handful of companies |
If your super and ETFs are all cap-weighted global funds, you may own far more of the same AI names than the number of funds suggests. Check the top holdings before you assume you are diversified.
Healthy reset or early bubble warning? Weighing the evidence
Once you know where the exposure sits, the next question is whether the fall is a warning or a healthy clear-out. Each side has a strong case.
| View | Core argument | Caveat |
|---|---|---|
| Healthy correction | Clears crowded positioning and separates profitable AI firms from those relying on distant assumptions | A 10% fall can still leave stocks priced for very fast growth |
| Early bubble warning | Concentration is extreme, recalling the dot-com era | Today’s leaders earn real revenue and profits |
| Spending-cycle reset | Financing, permitting and timing pressures, not the end of AI adoption | Delays can still hit equipment orders and supplier earnings |
The bubble case draws its force from concentration. Antipodes’ Vihari Ross reportedly put the top 10 stocks at about 40% of the global index and compared that with the dot-com period (unverified). The 2000 precedent is sobering: the internet did change the world, yet many richly valued firms failed and the Nasdaq took years to recover.
Semiconductor concentration was already visible in June, when a Broadcom guidance miss triggered a 4.18% Nasdaq fall and passive index holders discovered semiconductor exposure close to five times higher than two years earlier.
The reset case is just as persuasive. Invesco argues the pressure comes from financing, permitting and timing rather than any retreat from AI itself. Capital Group’s Karen Choi reportedly said regulatory uncertainty is more likely to hit projects planned for 2028-30 than committed 2027 spending (unverified), and Morningstar Australia judged that an AI-spending slowdown alone is unlikely to cause a recession.
The tension sits in the earnings. AI leaders produce real revenue and profit, but those profits are being valued against very large spending plans that are sensitive to the cost of debt. Recent history offers no single answer:
- 2022 tech correction: higher rates compressed growth valuations even where the technology worked, and the adjustment ran deeper and longer than one bad day.
- 2000 dot-com crash: concentration and valuation mattered, and recovery took years.
- January 2025 DeepSeek fall: Nvidia and the AI trade recovered as cheaper inference was seen to expand demand.
- April 2025 tariff shock: the Nasdaq fell 5.82% on 4 April 2025 and markets recovered quickly, though that does not guarantee the same path now.
Corrections have ended in weeks and in years. Do not read Monday’s bounce as proof of either the buy-the-dip case or the bubble case. The next earnings and spending figures will decide which view holds.
The dates that will test the AI trade, and what to check in your portfolio
That evidence starts arriving next week. Nvidia reports its October-quarter results on 17 November, the nearest test of confidence in the AI trade. On the Australian side, Selfwealth listed earlier dates for the jobs and inflation releases, but the ABS release calendar is the official source and is used here.
- 17 November: Nvidia earnings. Analyst estimates, not company guidance, sit around US$108-108.8 billion in revenue and US$2.47-2.49 earnings per share.
- 24 November, 11:30am AEDT: ABS October labour force. This release shows whether higher rates are cooling the jobs market.
- 26 November, 11:30am AEDT: ABS October CPI. This inflation reading bears on whether the RBA can hold steady.
- 8 December: RBA decision. Selfwealth lists this as the final rate decision of 2026.
The RBA’s 3 November Statement on Monetary Policy forecast headline inflation peaking at 4.5% in the December 2026 quarter, with a return to the target midpoint later than earlier expected. Sticky inflation keeps rates higher, and higher rates raise the cost of capital for the AI build-out as well as for Australian borrowers. Each date tells you something different, so watch them together rather than reacting to any single release.
The RBA November Statement on Monetary Policy also pushes the return to the 2-3% inflation target out to mid-2028, a longer runway of restrictive settings that matters for any capital-hungry sector.
Past performance does not guarantee future results. Analyst estimates are subject to market conditions and various risk factors.
Questions to ask about your own holdings
- Do your top holdings overlap? Compare the top 10 positions across your ETFs and super options.
- How much sits offshore? International super options and US-dollar assets carry most of the AI exposure.
- What else do you own? Franklin Templeton Australia reportedly noted bonds and liquid alternatives can offset concentrated AI-equity risk (unverified). Copper and resources run on a different earnings driver, but they are no guaranteed hedge because they remain tied to Chinese demand, commodity prices and equity markets.
What the correction changes for diversified investors, and what stays unresolved
This was a genuine Nasdaq correction, not a passing scare, and Monday’s rally left it in place. For Australians, the larger risk is unlikely to be direct Nvidia ownership. It is the concentration that can sit unnoticed inside super, global ETFs and cap-weighted funds.
The case against a bubble rests on real revenue and earnings. The case for caution rests on how heavily those earnings depend on large, debt-sensitive spending plans. Both can be true at once.
Nvidia’s results, the late-November jobs and CPI data, the RBA’s December meeting and the new US Congress’s stance on AI and data centres will start to settle the question. Until then, further volatility is possible, and your own holdings deserve a closer look.
This article is for informational purposes only and should not be considered financial advice. Investors should conduct their own research and consult with financial professionals before making investment decisions.