Yesterday’s October inflation print missed forecasts by the smallest margin the data allows. Headline consumer prices rose 0.4% for the month against a consensus of 0.3%, and core prices rose 0.3% against 0.2%. Even so, Nasdaq futures fell about 1.4%, the 10-year Treasury yield jumped roughly 7 basis points to about 4.94%, and gold dropped around 2.6%. If you assume the size of a miss sets the size of the move, the CPI report and the market reaction to it should make you think again.
The Bureau of Labor Statistics (BLS) released the data at 8:30 a.m. ET on Tuesday, 10 November 2026. It did not publish year-over-year rates, because the 2025 federal shutdown left a gap in the prior-year comparison base.
That matters if you hold stocks, bonds or futures through data days. A rounding-error surprise can still hit every asset class at once.
Three forces explain why: the expected path of Federal Reserve policy, how traders were positioned going in, and the inflation era you are investing in. Once you can read those three, you also have a practical way to cut your risk before the next release lands.
Why did a 0.1-point miss move stocks, yields, the dollar and gold at once?
At 8:30 a.m., your screens would have shown everything moving at once.
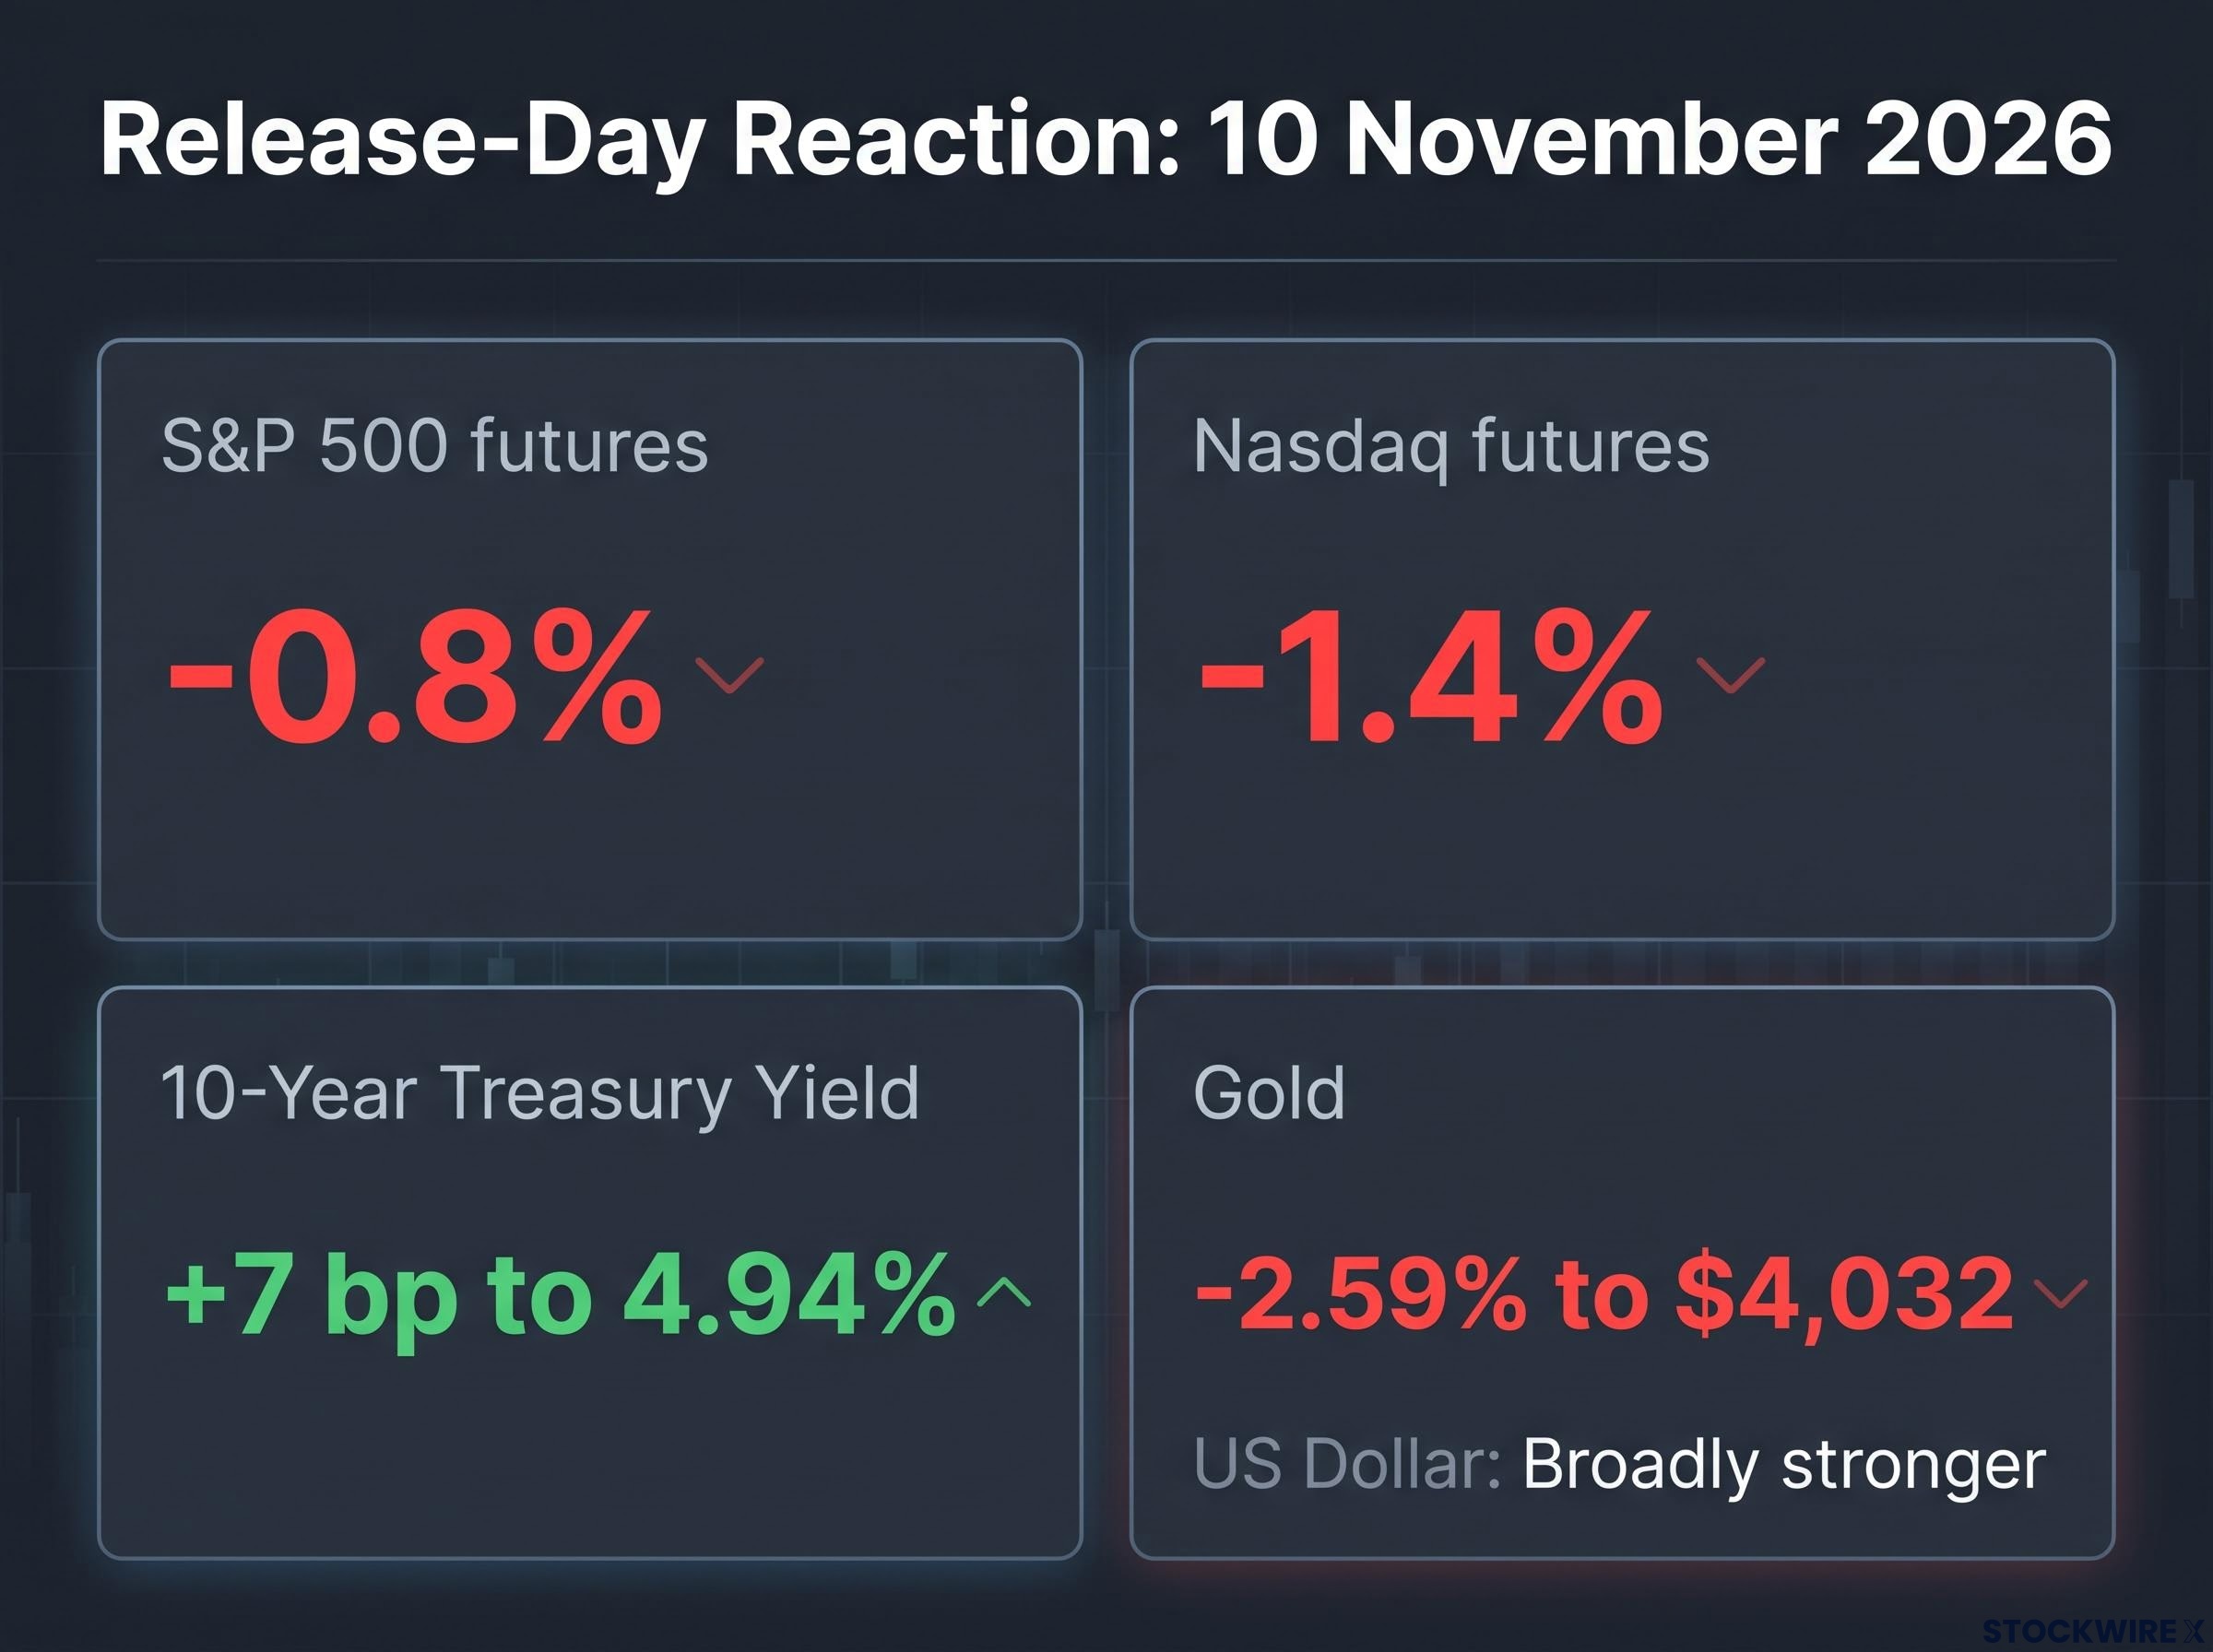
On 10 November 2026, the release reaction saw S&P 500 futures at -0.8%, Nasdaq futures at -1.4%, and the 10-Year Treasury Yield at +7 bp to 4.94%.
| Asset | Release-day reaction (10 November 2026) |
|---|---|
| S&P 500 futures | About -0.8% immediately after the release |
| Nasdaq futures | About -1.4%; Composite closed about -0.74% |
| 10-year Treasury yield | Up about 7 bp to roughly 4.94% (Schwab) |
| US dollar | Broadly stronger |
| Gold | About -2.59% to roughly $4,032 |
Timing changed the picture. Charles Schwab’s opening snapshot showed the Nasdaq briefly higher on an unrelated tech bounce, before the CPI-driven reversal dragged it down by the close.
These moves were not four separate stories. They were one story told four ways: the market repriced what the Fed would do next.
The conditions were stacked. Both measures ran hot, core printed 0.3% for a third straight month, and a December hike was already largely priced. Analysts had expected annual rates of about 3.9% headline and 2.8% core, according to Trading Economics, but those were forecasts rather than official BLS readings.
Your read of a CPI surprise depends heavily on how much of the December hike pricing was already in the market, because supply-driven energy inflation and a split committee mean a hold, not a hike, would have been the bigger shock.
The Waller trigger Fed Governor Christopher Waller had said a core CPI reading of 0.3% or higher would require the Fed to consider a 50 basis point hike in December. Yesterday’s print met that threshold.
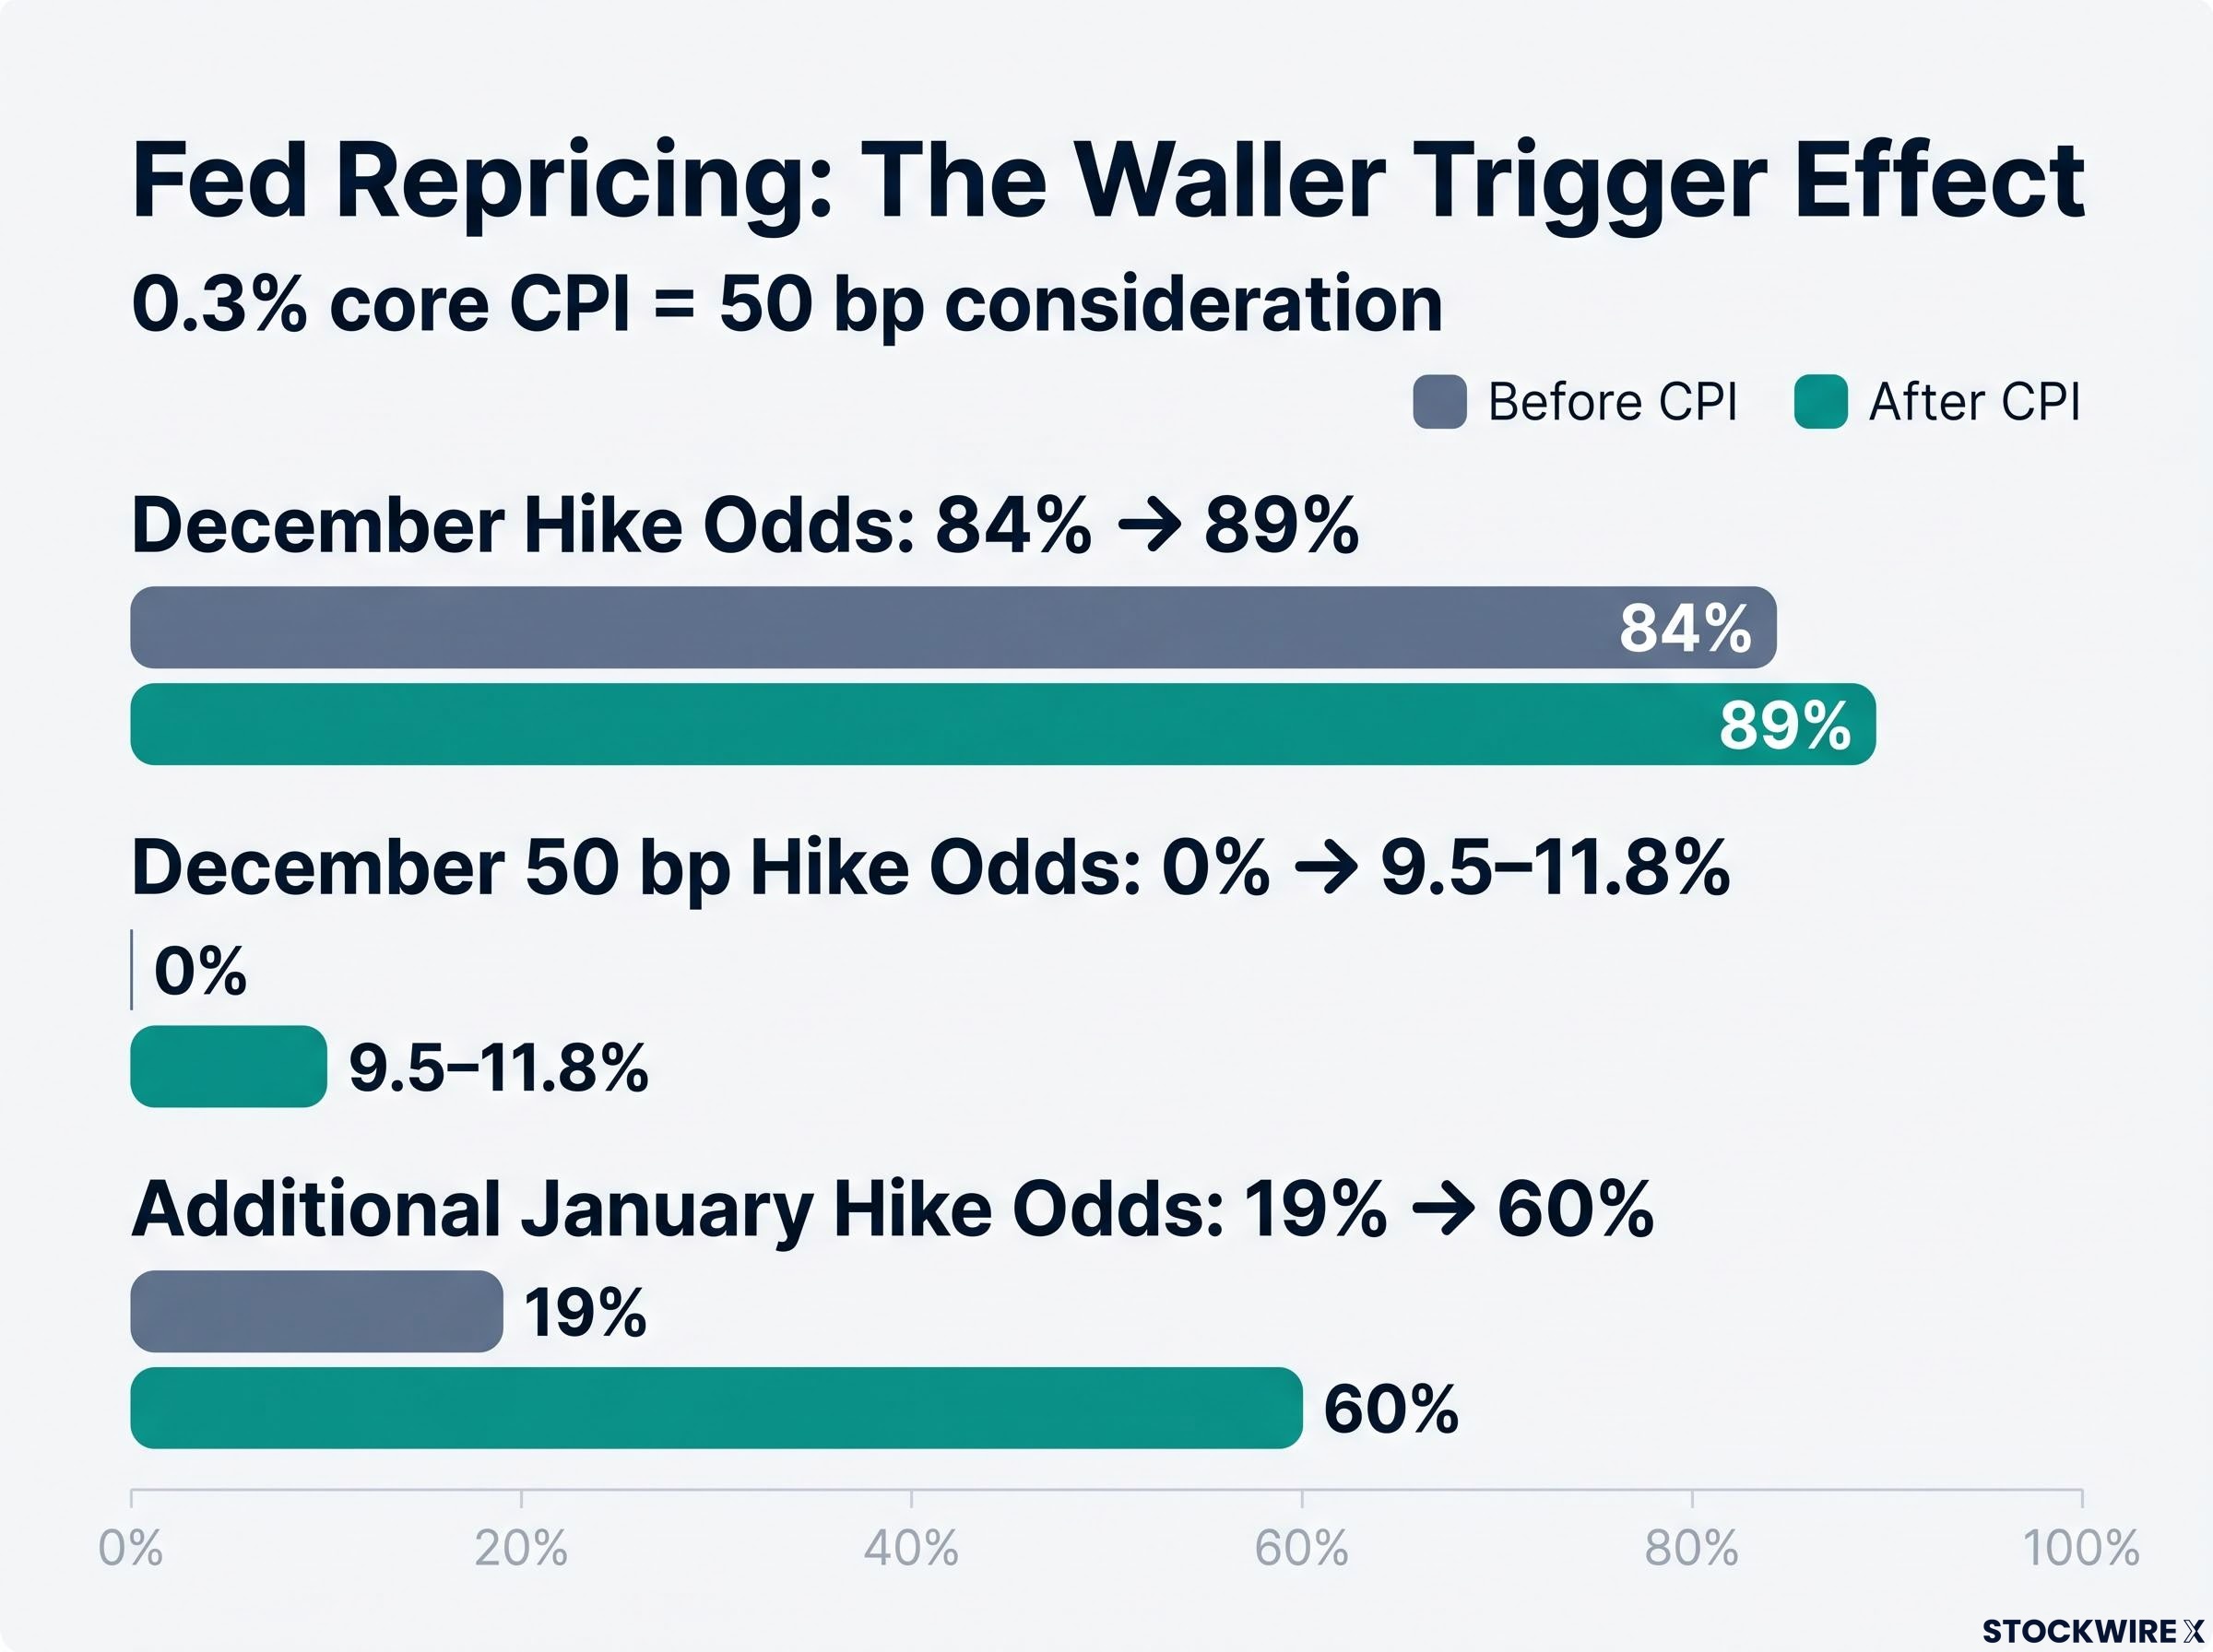
For a 0.3% core CPI, December Hike Odds went from 84% to 89% and Additional January Hike Odds went from 19% to 60%.
| Measure (CME FedWatch) | Before CPI | After CPI |
|---|---|---|
| December hike odds | About 84% (9 November) | About 89% (Reuters) |
| December 50 bp hike odds | About 0% | About 9.5-11.8% |
| Additional January hike odds | About 19% | About 60% (Cboe account) |
How rate futures turned the print into a 50 bp question
The Fed moves in steps: 25 or 50 basis points, one hike or two. When a small miss shifts the odds between those steps, prices react far more than the miss itself would suggest. This effect is called convexity, meaning the price response grows faster than the change in the input.
December 2026 SOFR futures (SR3Z6) show this in practice. These contracts track the average overnight lending rate expected in that month, so a falling price means traders expect a higher policy rate. No reliable before-and-after price series was available, but the direction was clear.
The question to ask on any CPI day is not how big the miss was. Ask what it did to the odds of the next Fed decision.
When big ASX news breaks, our subscribers know first
How do positioning and short covering amplify a CPI surprise?
The policy path explains the direction of the move. Positioning helps explain its speed.
Look at what speculators were doing in long-dated Treasury futures beforehand. Commodity Futures Trading Commission (CFTC) data, reported by Macro Agent Desk on 8 November, showed the following for 30-year bonds:
- A speculative net short of about 126,000 contracts on 13 October
- A net short of about 9,097 contracts at the 3 November report
- About 10,041 contracts of covering in the latest week
The short that vanished In about three weeks of reporting, the speculative bet against 30-year Treasuries shrank from roughly 126,000 contracts to about 9,097.
A short position profits when bond prices fall. Short covering means buying bonds back to close that bet, and that buying pushes prices up and yields down. The source behind the episode described the position unwinding over roughly six weeks, leaving fresh capital ready to re-enter on the day.
So part of the autumn bond rally may have been forced buying rather than a new conviction that inflation was easing. By Tuesday morning, most of that buyer had gone.
When the hot print arrived, it raised expected Fed rates and removed a source of demand at the same moment. There was little cushion left.
The pattern can run the other way as well. On 13 October 2022, Reuters described an initial selloff followed by a strong equity rebound as traders covered shorts in an oversold market. Policy repricing and positioning often operate on the same day, and the hosts discussing yesterday’s release admitted that market readings of CPI or jobs data can seem random, with headlines easy to mix and match after the fact.
A quiet bond rally into a data release is not necessarily a sign of conviction. Check positioning before you assume the next move will be cushioned.
Why does the same CPI surprise mean different things in different eras?
If yesterday’s reaction looks extreme, that is partly because you are judging it against an older era. The same surprise carries a different meaning depending on where inflation and interest rates sit.
Then versus now
| Era | Regime | What a hot CPI meant |
|---|---|---|
| 2010s | Subdued inflation; Fed often near the lower bound; gradual normalisation expected | Often welcomed as a sign of a healthy economy; limited impact on discount rates |
| 2022-2026 | Persistent inflation; rates used as an active tightening tool; repeated terminal-rate repricing | Directly lifts expected short rates, real yields and the return required from long-duration assets |
2022 showed how sharp the current regime can be in both directions. The September 2022 CPI, released on 13 October 2022, showed 8.2% headline and 6.6% core annual inflation. The 2-year yield rose about 23.5 bp and the 10-year about 14 bp, according to Reuters.
A month later, the cooler October 2022 print, released on 10 November 2022, sent the 10-year down about 31 bp and the 2-year down about 30 bp. Stocks rallied hard. The 2022 figures are labelled inconsistently across sources, so treat them as illustrations rather than precise benchmarks.
Part of the reason inflation prints now carry so much weight is that Chair Warsh has removed forward guidance, so you get no pre-signalled rate path and data releases absorb the repricing that speeches once spread out.
Why duration decides who gets hit hardest
A company’s share price partly reflects the present value of its future cash flows. Present value is what money arriving later is worth today, after discounting it at an interest rate:
PV = Σ CF_t / (1+r)^t
The rate, r, sits in the denominator. When rates rise, cash flows expected far in the future shrink the most. Analysts call these long-duration stocks because their value depends on earnings many years away.
That makes the damage uneven, even within tech:
- Most vulnerable: businesses whose growth is expected 5-10 years out, unprofitable or lightly profitable tech, small unprofitable names in the Russell 2000, and highly leveraged companies
- Less affected: cash-rich mega-caps such as Nvidia, Google, Meta and Microsoft, which have near-term cash generation and liquid balance sheets as a cushion, although they can still fall
The hosts discussing the release said they would not trade the Fed through tech stocks. Before you predict a reaction from an old CPI day, ask which regime you are in and how long-dated your own holdings are.
How should you size trades around a CPI release?
Understanding the mechanism helps. Your contract count is the part you actually control.
Data-day risk has a different shape from normal-day risk. Spreads widen and prices can gap, so stops may fill well past your intended level. First moves can reverse within minutes as traders parse core, shelter and revisions. Stocks, bonds, the dollar and gold can move together, which weakens your diversification just when you need it, and futures leverage magnifies all of it.
Practitioners agree on the response. Admiral Markets recommends smaller positions around major releases because of wider spreads, slippage and sudden jumps. Tastylive’s futures sizing guide notes that a standard /NQ contract can swing roughly $7,000 in an ordinary daily move, points smaller accounts towards /MNQ, and warns against sizing a position simply because your buying power allows it.
| Standard contract | Micro equivalent | Micro point value | Sizing example |
|---|---|---|---|
| E-mini S&P 500 (ES) | MES | $5 per point | Five micros instead of one e-mini |
| E-mini Nasdaq-100 (NQ) | MNQ | $2 per point | Smaller accounts can use MNQ for finer adjustment |
The tastylive hosts made the point practically. A one-lot trader need not change anything, but a 10-lot trader might cut to about five, and anyone nervous should trim.
- Cut contract count before 8:30 a.m. Decide your release-day size the night before.
- Size from the potential release-day range. Do not base it on last week’s average move.
- Scale in. Avoid committing full size at the print; let the first reversal pass.
- Use micros for finer control. Swap one e-mini for several micro contracts.
- Assume stops will slip. Plan your maximum loss as if the price jumps straight through.
- Ignore spare buying power. Available margin is not a reason to add size.
Remember A micro contract is smaller, not risk-free.
Yesterday’s print rewarded traders who had already cut size and punished those sized for an ordinary day.
For traders wanting a mechanical sizing rule, our dedicated guide to fixed dollar risk position sizing shows how stop distance, not conviction, sets contract count.
What the October print teaches you to watch before the next data day
Three forces came together on 10 November. A December hike was already nearly priced, with a possible 50 bp tail. Treasury shorts had largely been covered, and in the current regime inflation data flows straight into rate expectations. Together they turned a small surprise into a move across every asset class.
Before the next release, check three things. Look at where rate futures and FedWatch odds sit, how crowded positioning has become, and what the current regime implies for a hot or cool number. Then set your contract size before the number lands, because a reaction cannot be predicted from the miss alone.
This article is for informational purposes only and should not be considered financial advice. Investors should conduct their own research and consult with financial professionals before making investment decisions.