Your super fund’s “balanced” option probably holds hundreds of companies. That does not mean your risk is spread across hundreds of companies. Yesterday (26 October 2026), Reserve Bank of Australia (RBA) Assistant Governor Brad Jones told the AFR Super and Wealth Summit in Melbourne that a great deal of AI optimism was “priced into markets”, and super concentration risk is how that optimism ends up in your retirement savings without you choosing it.
By one arithmetic estimate, a balanced option can carry roughly 7-14% in AI-linked US technology. Whether yours sits at the low or high end depends on details most members never check.
Global sharemarket benchmarks now lean heavily on a handful of US tech giants, and Australian funds track those benchmarks closely. If sentiment towards AI turns, the same few companies could drag on balances right across the system, including yours.
Here is how that exposure gets into your account, roughly how large it is, why your exit options are narrow, and how to judge your own position calmly rather than in a panic.
How does a “diversified” super option end up so exposed to a few US tech stocks?
The reassuring picture goes like this. Your balanced option owns Australian shares, international shares, property, infrastructure and bonds, spread across hundreds of holdings. It looks like the definition of diversified.
The catch sits inside the international shares. Most premixed options track the same global index, and that index is market-capitalisation weighted. This means each company’s share of the index is set by its total market value, so the biggest companies automatically take the biggest slice.
Because of the cap-weighting feedback loop, each new dollar of passive inflow is channelled toward stocks that have already risen, which is why the largest companies keep taking a bigger slice of the benchmark.
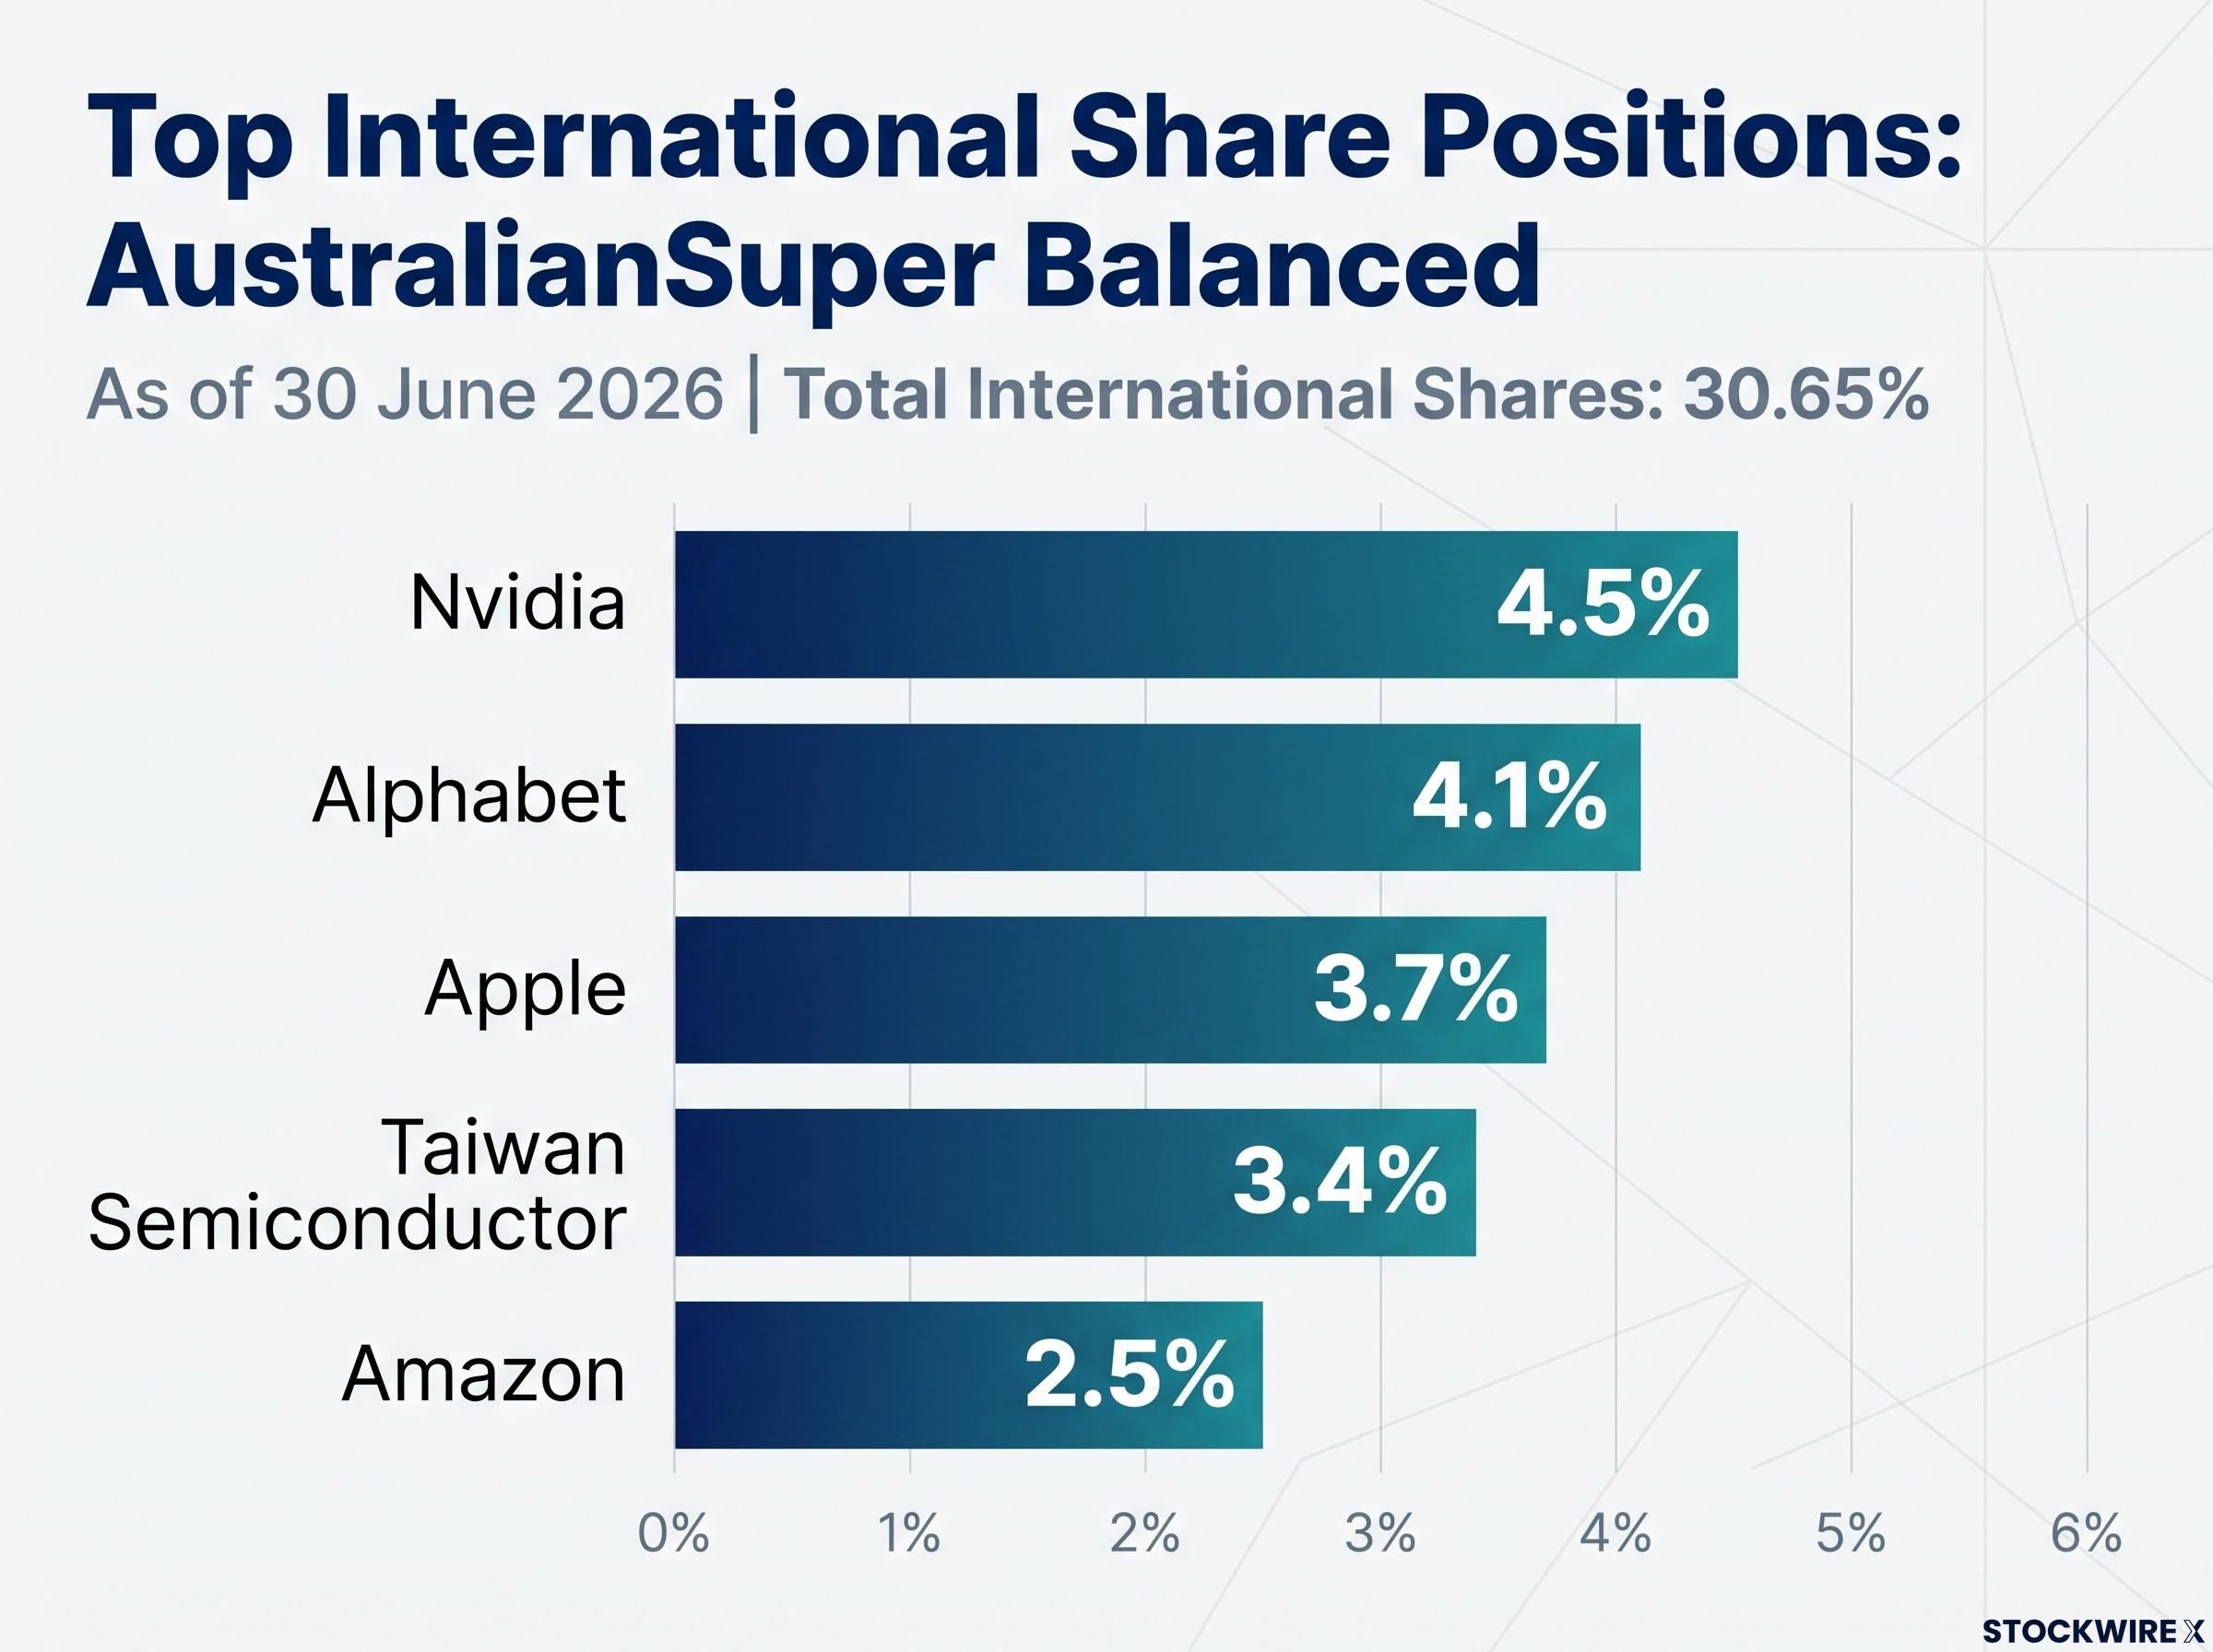
In the Vanguard MSCI International ETF (VGS), the top ten holdings make up about 27% of the fund, according to Morningstar Australia. AustralianSuper‘s Balanced option held 30.65% in international shares at 30 June 2026, and its fact sheet lists these top positions:
- Nvidia: 4.5%
- Alphabet: 4.1%
- Apple: 3.7%
- Taiwan Semiconductor: 3.4%
- Amazon: 2.5%
Macrobusiness estimates nine US tech-related holdings account for about 21.1% of AustralianSuper’s international-share portfolio. (The ABC put the option’s global equities at about 35%, a gap that likely reflects different classifications or dates.)
Jones pointed out that US IT earnings expectations beyond the next three years had recently been running at about 45% a year “forever”. He called valuations “punchy”.
Brad Jones, RBA Assistant Governor “Far be it for me to opine on whether that’s irrational or not. But clearly there was a lot of good news in the price.”
Why funds stay close to the benchmark
Morningstar’s Joshua Groot notes that managers tend to hug benchmarks, and the annual super performance test adds pressure to track broad indexes. Straying from the index and underperforming carries real consequences for a fund.
Morningstar’s Tyger Fitzpatrick adds that diversification can be illusory when several funds own the same mega-cap names. For you, that means owning a balanced fund is not the same as being protected from a US tech downturn.
When big ASX news breaks, our subscribers know first
What is the estimated dollar exposure across Australian super?
A percentage like 12% is hard to feel. Turn it into dollars and it lands differently.
Total super assets reached $4.7672 trillion at 30 June 2026, according to the Australian Prudential Regulation Authority (APRA). Earlier estimates used an older base of roughly $4.4 trillion, where a 7-12% allocation implied a quarter to half a trillion dollars.
Macrobusiness puts the figure at about $500-$600 billion, with a central estimate of $550 billion, based on average portfolio AI exposure of about 12%. AustralianSuper’s Mark Hargraves describes the exposure as material, but embedded in a diversified portfolio rather than a single thematic bet.
| Measure | Figure | Source | Status |
|---|---|---|---|
| Total super assets | $4.77T (30 June 2026) | APRA | Official |
| US tech/AI exposure | $500B-$600B (central $550B) | Macrobusiness | Estimate |
| Average portfolio AI exposure | About 12% | Macrobusiness | Estimate |
| AustralianSuper Balanced AI exposure | About 14% (arithmetic) | ABC | Estimate |
Now the honest pullback: no APRA or ASFA publication gives an industry-wide AI exposure figure. Every number beyond total assets is a third-party estimate.
Use it as a rough guide. If 10% of a $150,000 balance is tied to AI-linked US tech, that is about $15,000. Growth options can run higher; UniSuper High Growth holds 51% in international shares.
Why is this AI buildout different from the dot-com boom?
The tempting comfort is that you have seen this before. Tech soared in 1999, crashed, and the world moved on.
Jones turned that comparison around. The late-1990s boom was “principally equity financed”, meaning investors bought shares and wore the losses. Today’s buildout increasingly relies on debt in “more opaque forms”.
Brad Jones, RBA Assistant Governor The current cycle uses “vendor financing structures” and “circular financing”, making it harder to assess than the dot-com era.
The Conversation described how the loop can work:
- A chipmaker or cloud provider finances a customer, such as a data-centre builder.
- The customer buys chips or computing capacity.
- The supplier books sales and the customer books investment.
- Revenue and valuations rise.
- Those gains support further financing.
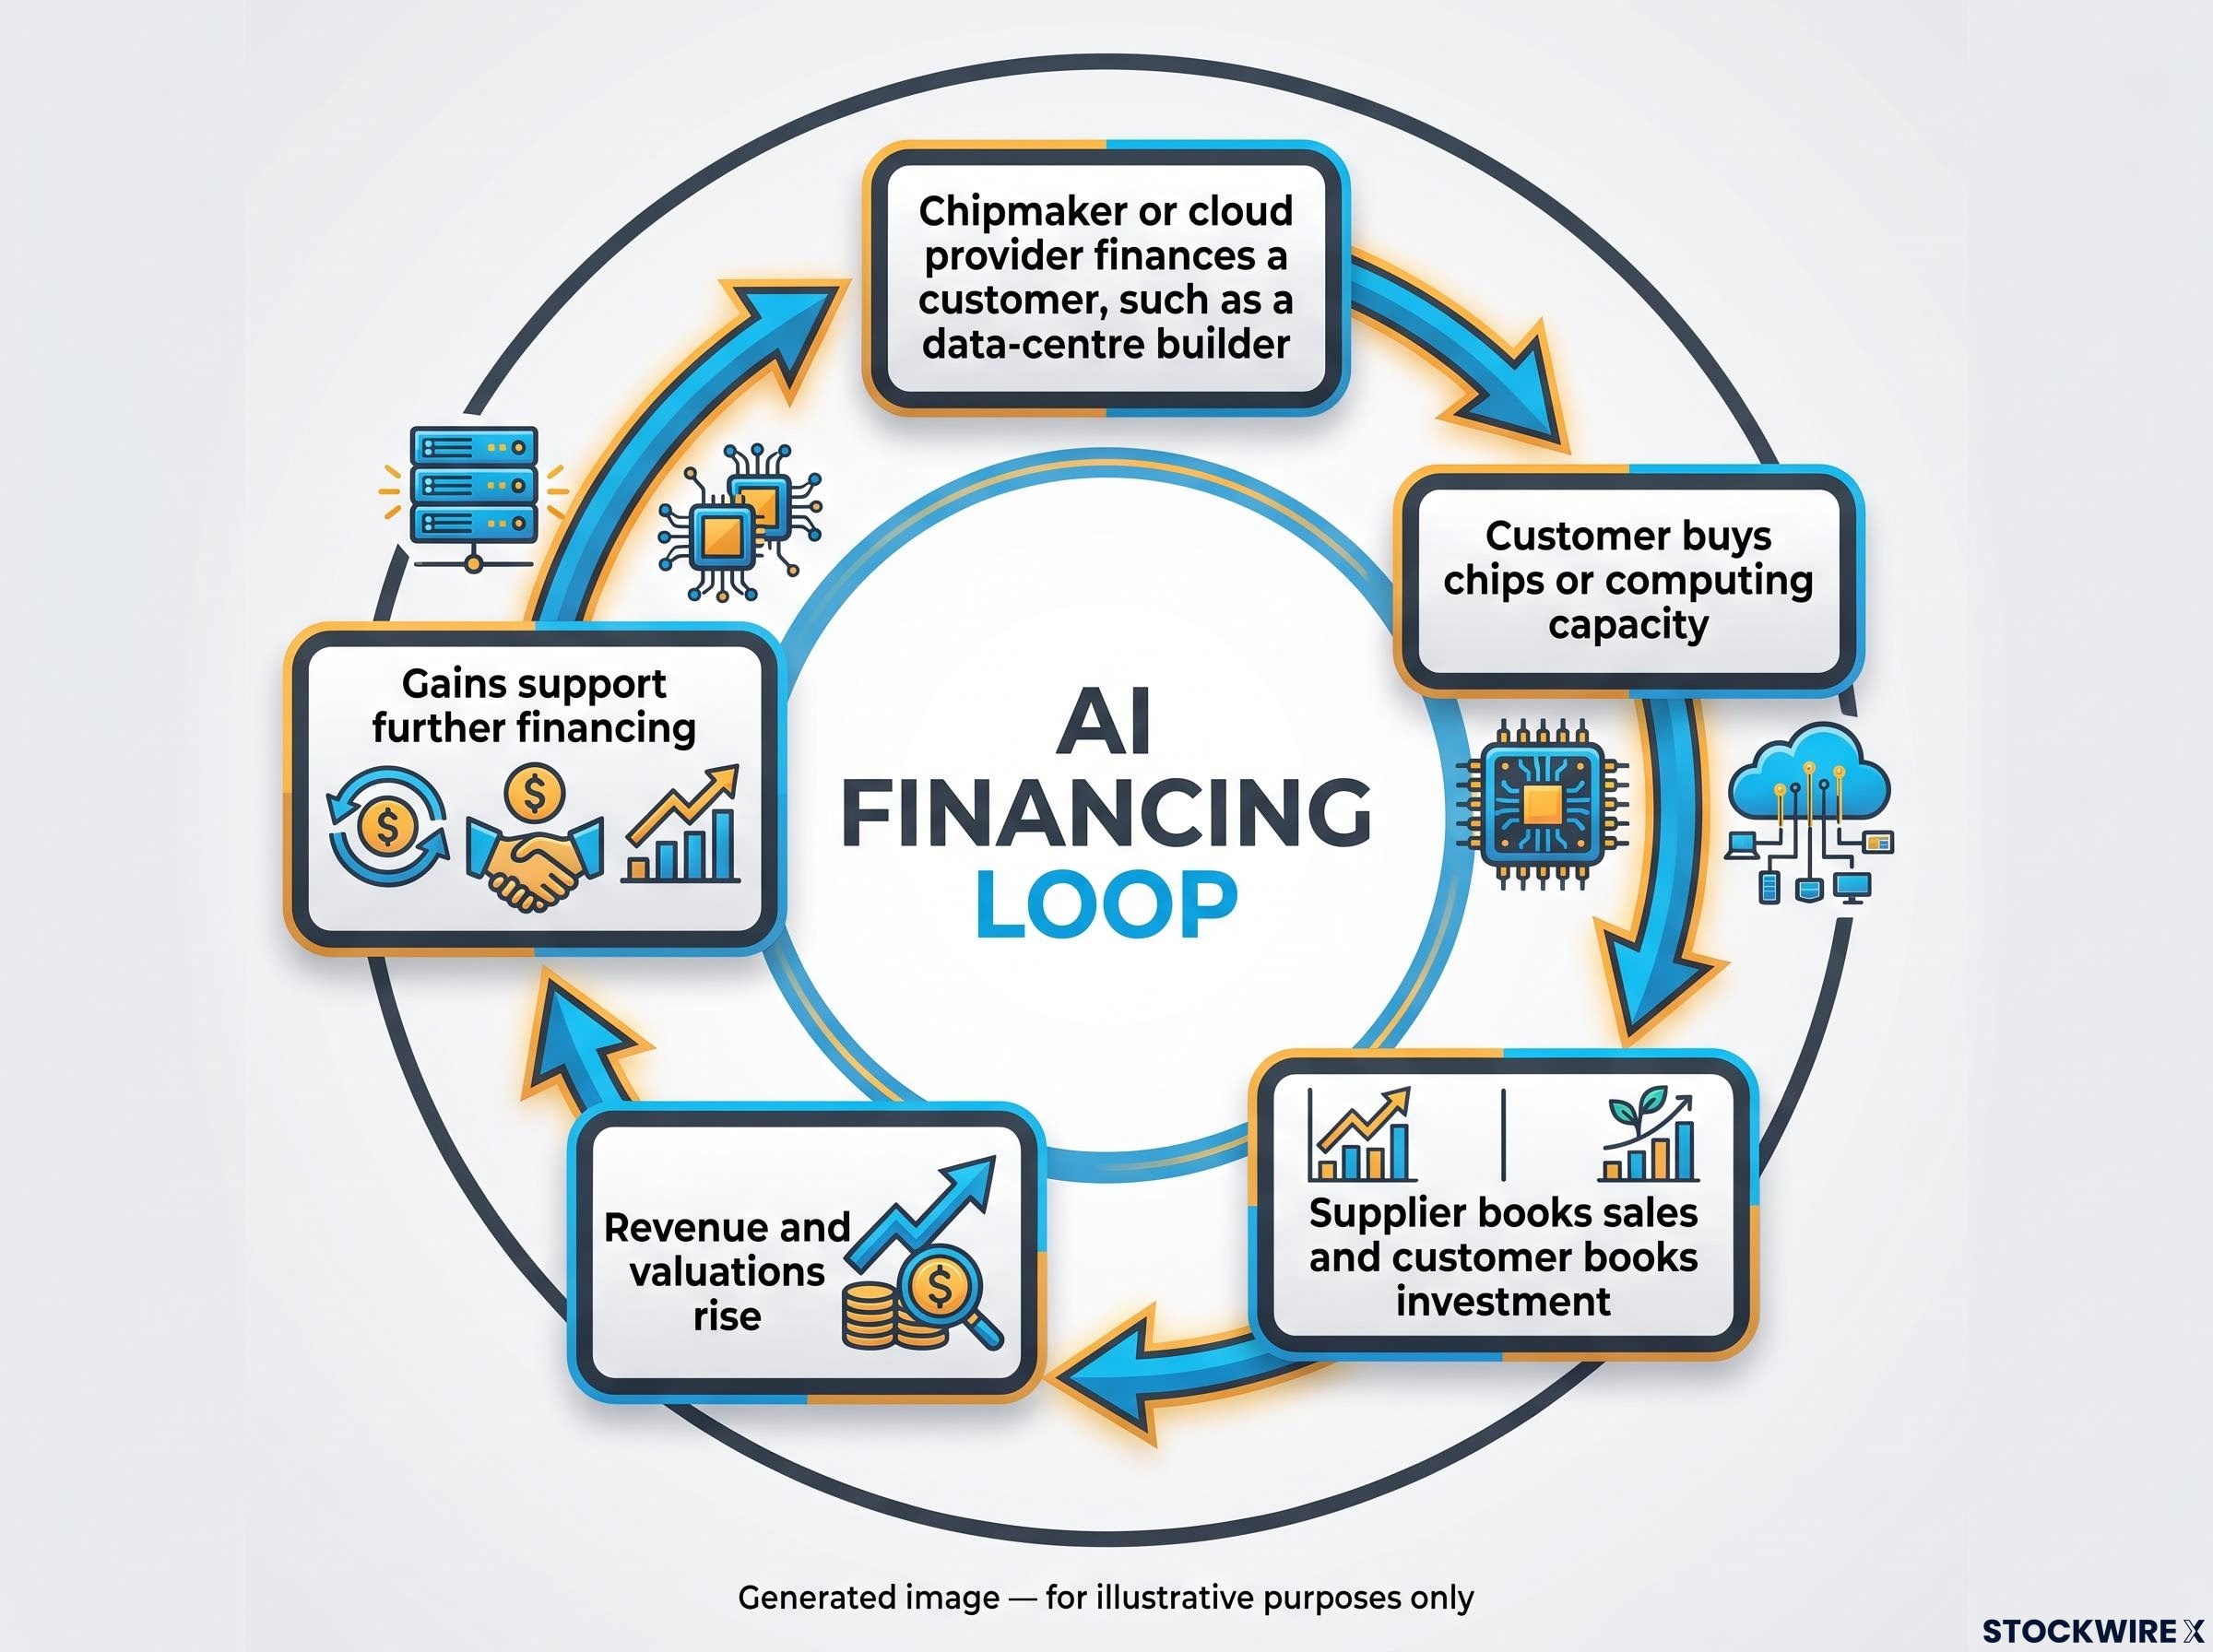
The RBA’s Financial Stability Review flagged “pockets” of higher-risk companies and warned that a sentiment shift could expose a financing cycle grown “more opaque and circular”. The weak points include overbuilding, rapid obsolescence, power constraints, high interest costs, weak monetisation and customers unable to repay debt.
This is not simply 1999 again. AI has real customers, physical data centres and visible spending, and Morningstar frames valuation as the immediate concern alongside power and water-use risks.
What should unsettle you is the financing, not the technology. The question is whether prices and the debt behind them survive a mood shift, which is exactly what flows through to your benchmark-driven holdings. Jones said regulators are examining these structures closely.
The Bank for International Settlements has also flagged circular financing loops, including hyperscaler-to-neocloud compute arrangements, warning that internally recognised revenue may mask how much independent end-user demand actually exists.
What can you actually do on a standard super menu, and why do members make it worse?
Default menus usually offer a balanced or growth option, a conservative option and cash. None lets you strip out US mega-cap tech while keeping other growth assets.
| Menu choice | What it does | Main trade-off |
|---|---|---|
| Stay diversified | Keeps benchmark exposure, including AI-linked tech | Concentration risk remains |
| Move defensive | Cuts share exposure overall | Also cuts unrelated growth assets |
| Specialist option | Targets a specific strategy or region | Its own concentration and performance risks |
The narrow menu is only half the problem. The bigger danger is the behaviour it invites.
What the April 2025 switching tells us
During the April 2025 tariff sell-off, about 11,000 AustralianSuper members switched to cash, roughly 12 times the normal rate, AAP reported. Switching after a fall locks in the loss, then forces a second timing call on when to get back in, often after the rebound.
AustralianSuper’s own hypothetical shows the cost.
Key figure A member who moved from Balanced to Cash on 23 March 2020 and stayed there until 30 June 2026 would have about $343,000, versus $553,000 had they stayed in Balanced.
APRA’s inaugural System Risk Stress Test, published 30 June 2026, covered the four major banks and six large super funds, modelling withdrawals and switching well above COVID-era levels. It flagged mismatched assumptions about member behaviour, and found MySuper options raised illiquid allocations during stress, shifting liquidity and sequencing risk to members late in the scenario. Stress tests are scenarios, not forecasts.
Commentators including the Wealth Within hosts and Blueberry Markets analyst Zoran Caresovich argue many members do not know their fund or allocation, and younger investors have mostly known a bull market. Your biggest controllable risk is probably your own reaction to a fall, and cash is not automatically a safe long-term answer.
For members tempted to move after a fall, our dedicated guide to switching super to cash shows how missing a single month’s recovery erodes retirement balances.
What do past sell-offs say about how bad this could get?
Measured numbers tell a calmer story than some commentary. In April 2025, the S&P/ASX 200 fell from 8,558 on 14 February 2025 to 7,343 on 7 April 2025, then recovered to 8,274 by 14 April, according to the ASX.
Rest reported a fall of up to 10.2% over several days, a 13.4% rebound, and April finishing up 3.6%. Claims by the Wealth Within hosts of a 20-25% fall are not supported by ASX data.
The GFC was harder. Rest describes a 17-month bear market from October 2007 to March 2009, and the ASX 200 only passed its October 2007 high in January 2020, a little over 12 years later, not the 17 years the hosts cited.
| Episode | Peak-to-trough | Recovery | Source |
|---|---|---|---|
| April 2025 tariffs | Up to 10.2% over days | 13.4% rebound; April up 3.6% | Rest, ASX |
| GFC | 17-month bear market | A little over 12 years to new high | Rest, ASX |
| Dot-com | Equity-financed boom and bust | Not quantified in research | RBA (Jones) |
The hosts also pointed to COVID, 1987 and the 1970s as differently shaped recoveries, though no named expert comparison was available. The lesson for you: recoveries have ranged from weeks to over a decade, so the real question is whether your time horizon can absorb a long one.
A note on market breadth claims
The hosts claimed a few tech leaders are propping up the index and that 50-60% of US stocks are in 30-50% corrections. These claims have not been independently verified.
Morningstar’s sturdier version is structural: a portfolio can hold many names yet still depend on the same AI, growth and US tech factors. Morningstar suggests US value, US small-cap and selected non-US markets as ways to reduce that dependence.
Checking your own exposure without reacting to the headline
You can run a useful check this week without changing anything:
- Read your option’s top holdings and sector weights, not just its name.
- Look through overlapping funds and ETFs that hold the same mega-caps.
- Match your option to your time horizon.
- Remember default options may hold unlisted assets that value and trade differently during mass switching.
- Avoid switching on headlines.
- If de-risking suits you, consider staged or rules-based changes.
If you are retired or close to it, sequencing risk matters most. Ask whether your cash-flow needs can be met without selling growth assets after a fall.
Large funds are adapting too. Morningstar’s Asset Owner Perspectives found Australian and NZ asset owners turning to total-portfolio approaches, private markets, infrastructure and real assets. Jones also said the sector is well placed to withstand significant stress.
General advice warning This information is general in nature and does not consider your personal circumstances. Where retirement timing, pension drawdowns, tax or a large balance are involved, consider licensed personal advice.
Checking holdings and horizon is a sensible response. Reacting to headlines is where the documented losses came from.
What the RBA warning changes, and what it does not
Jones highlighted a structural feature of benchmark-driven super, not a crash forecast, and he said the system is well placed to handle stress. Three points carry forward: your exposure is real and potentially large but estimated; debt-funded financing makes this cycle harder to read; and your own behaviour is the factor most within your control.
Watch for further RBA and APRA commentary, developments in AI financing structures, and your fund’s next performance and holdings disclosures. The decision in front of you is not whether to flee, but whether your option still fits your horizon.
This article is for informational purposes only and should not be considered financial advice. Investors should conduct their own research and consult with financial professionals before making investment decisions. Past performance does not guarantee future results, and estimates cited are subject to market conditions and change.