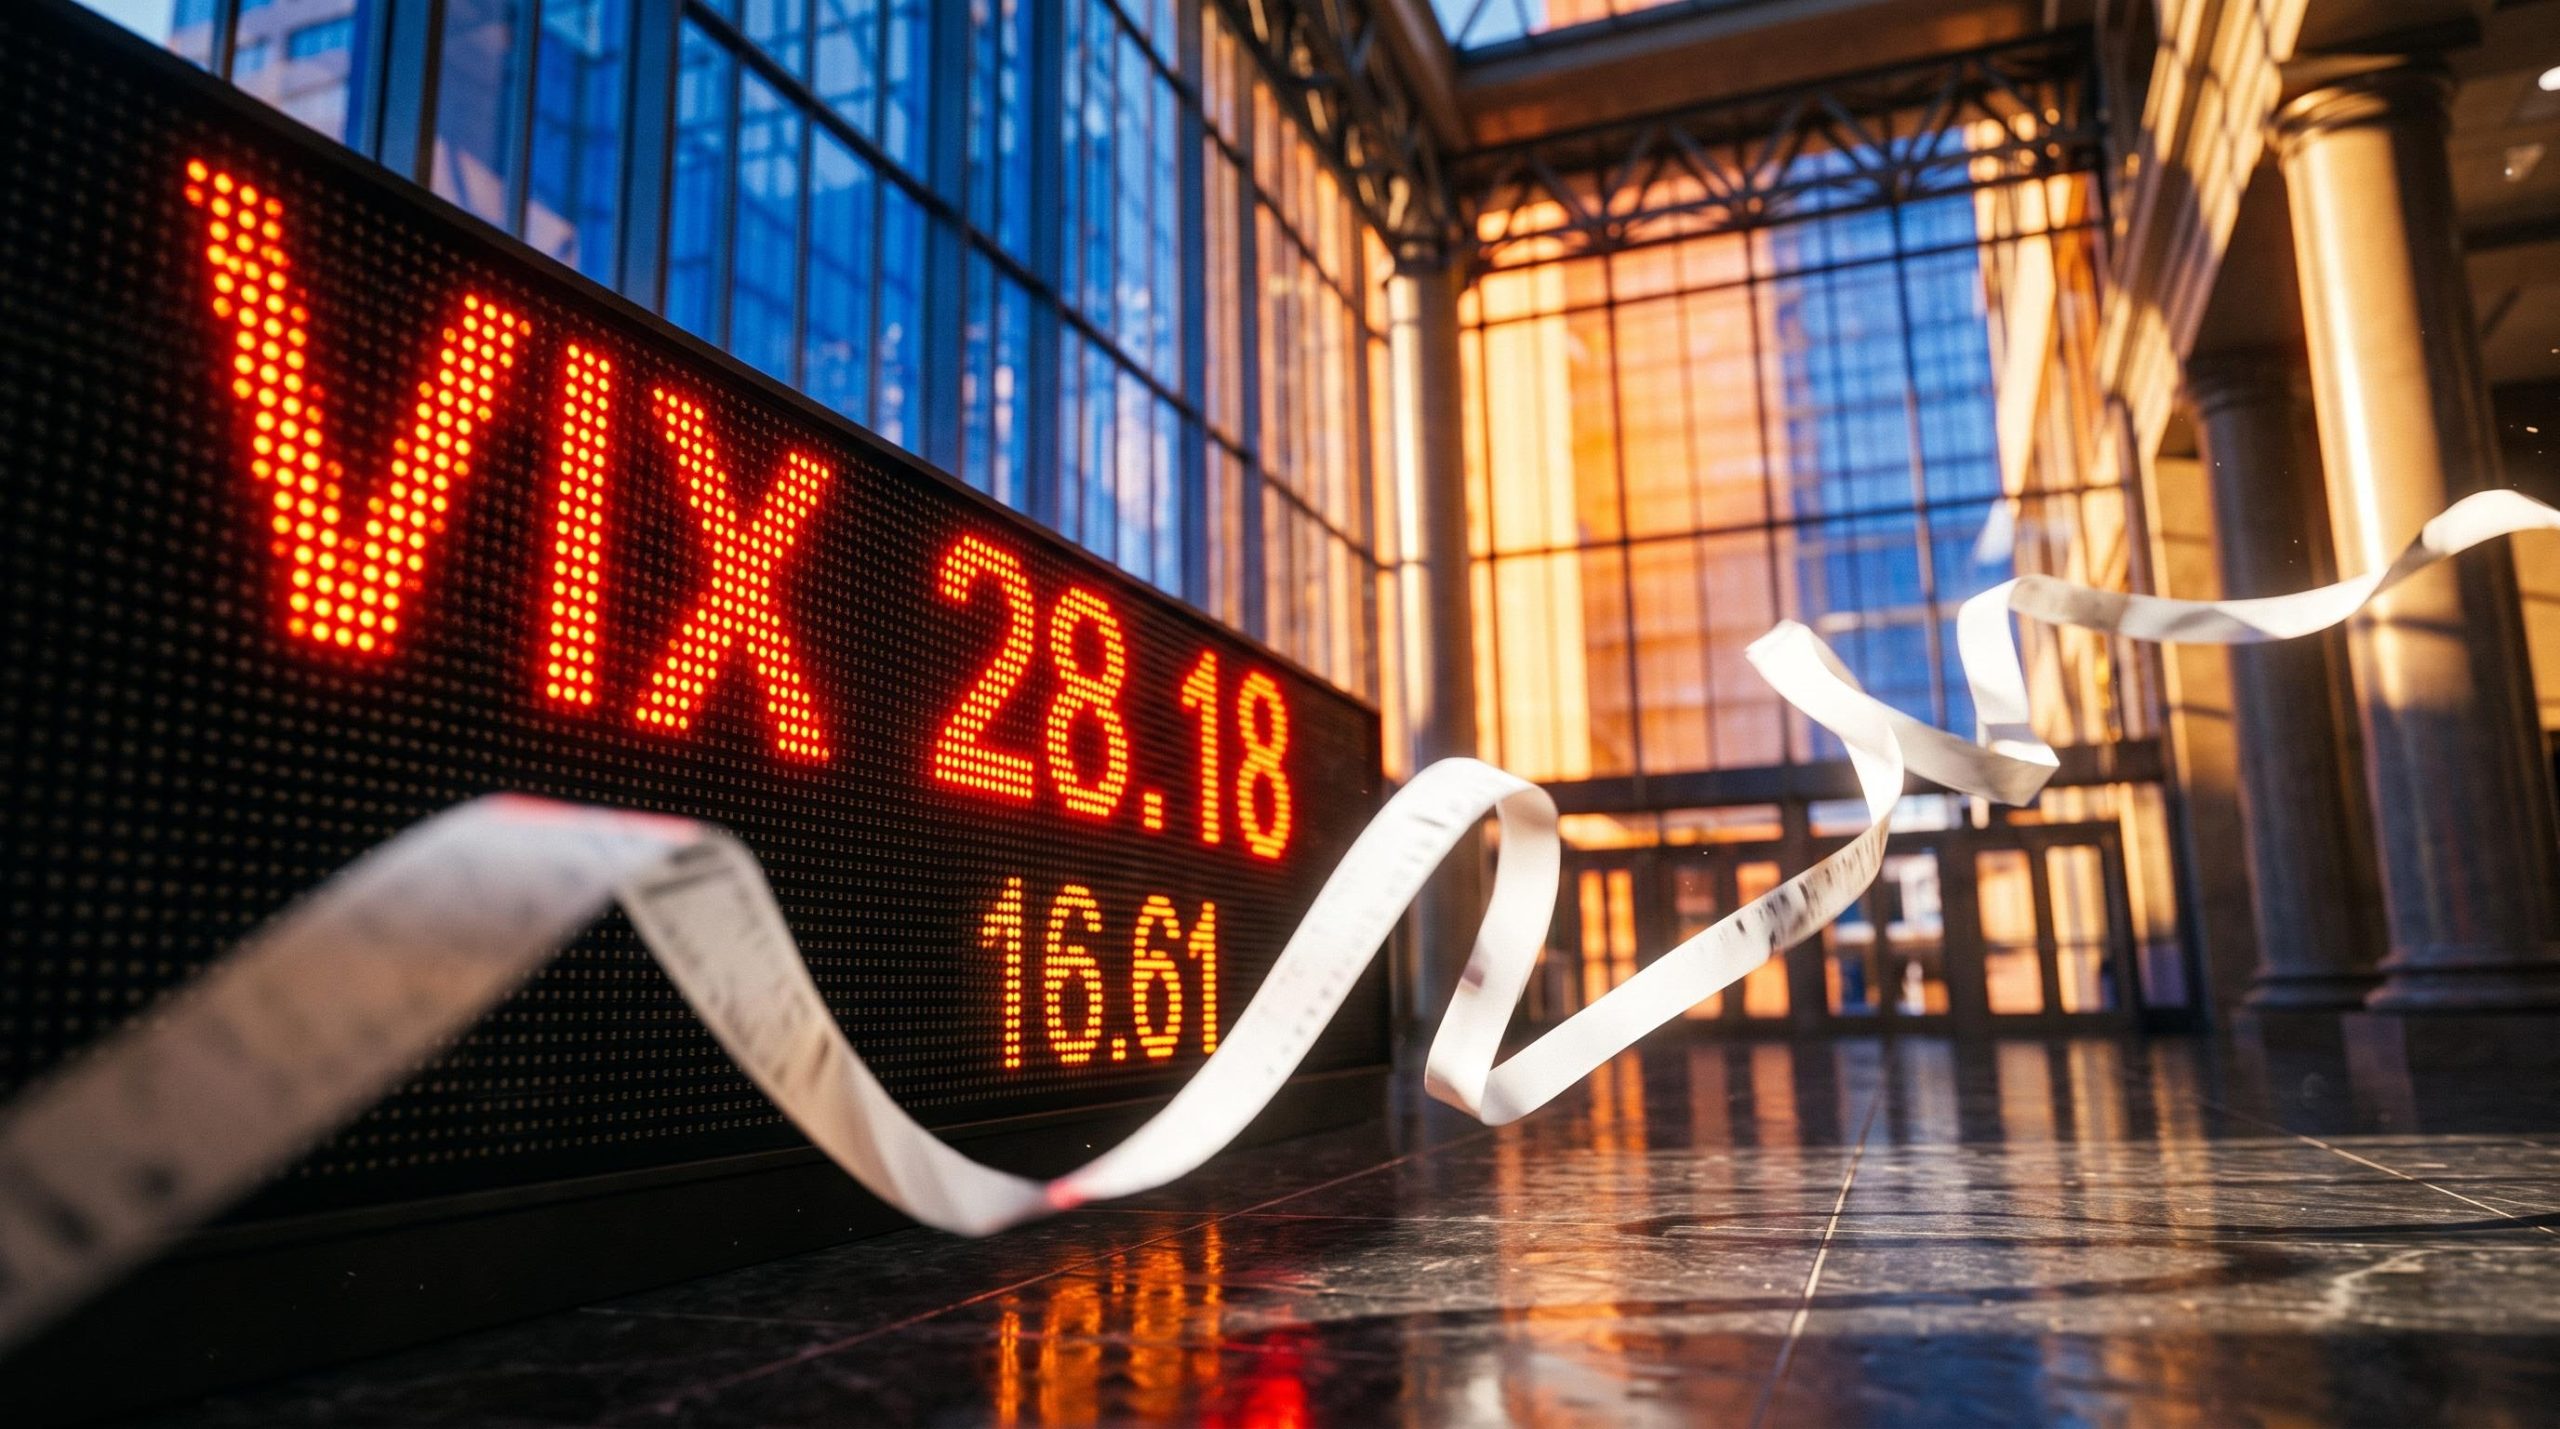
A falling VIX feels like relief, but it does not mean the danger has passed. The Cboe Volatility Index (VIX), Wall Street’s gauge of expected S&P 500 swings over the next 30 days, closed at 16.61 after the midterm rally on 4 November 2026. One session later it had jumped 69.66% to 28.18. By 10 November it was back at 19.46.
That kind of VIX whipsaw is not the market reacting to one headline. It is the market working through unstable positioning, and the swings will likely keep coming until something genuinely clears the risk.
The S&P 500 closed at 7,688.62 on 4 November, then dropped to 7,353.73 a day later. Reuters reported the Nasdaq’s worst session in 19 months.
Here is a plain-language framework for what is happening: why volatility flips this fast, which S&P levels matter and why, what macro forces sit on top, and which dated events in the next fortnight could finally settle things.
Why did the VIX swing from 16 to 28 and back in a week?
Start with the raw sequence, because the numbers tell the story better than any summary.
| Date | S&P 500 | Nasdaq Composite | VIX |
|---|---|---|---|
| 4 Nov 2026 | 7,688.62 (+1.58%) | 25,736.51 (+1.44%) | 16.61 |
| 5 Nov 2026 | 7,353.73 (-4.36%) | 24,315.00 (-5.52%) | 28.18 |
| 10 Nov 2026 | n/a | n/a | 19.46 |
On 5 November, the Nasdaq 100 fell more than 6%. The VIX close of 19.46 on 10 November comes from Cboe data via MarketWatch.
Rare company The 5 November VIX jump was the third-largest one-day percentage rise since 1990, behind 5 February 2018 (+115.6%) and 18 December 2024 (+74.0%).
Now look at the pattern underneath. Volatility rises when markets fall and collapses when they rally. Neither move settles anything.
Either way, big percentage drops in the VIX after a spike are common, and they are not proof the market has cleared.
Whether a sharp VIX spike is worth fading depends on the regime, and VIX regimes have shifted structurally since 2017, with the classic contrarian pattern holding mainly at extreme readings far above 28.
A VIX that has fallen from 28 to 19 tells you volatility was repriced, not removed. Treat calm sessions as part of the pattern rather than an all-clear.
When big ASX news breaks, our subscribers know first
How does dealer gamma create the 7,700 and 7,300 levels?
On a chart, 7,700 looks like a ceiling and 7,300 like a floor. Neither number is magic. Both come from how options dealers hedge their books.
What negative gamma does to price swings
Gamma measures how quickly an option’s sensitivity to price changes as the underlying index moves. Dealers who sell options to clients hedge that exposure by buying or selling the index, and the direction of their gamma decides whether that hedging calms or inflames the market.
- Negative gamma: dealers sell into declines and buy into rallies, which amplifies moves and makes support and resistance less reliable.
- Positive gamma: dealers buy dips and sell rises, which dampens moves and pins prices.
Think of negative gamma as a crowd that runs in whatever direction the room is already moving. Positive gamma is the crowd that pushes back.
Where the S&P levels sit
After Wednesday’s close, traders sold heavy volumes of S&P calls, creating large positive gamma at 7,700-7,800. That positive gamma was reported at roughly 2-3 times Tuesday’s level, and the zero-gamma pivot sat near 7,700. Below it, negative gamma lets volatility expand, accumulating toward 7,300 (also cited as 7,350), where the slope fades and selling pressure mechanically eases.
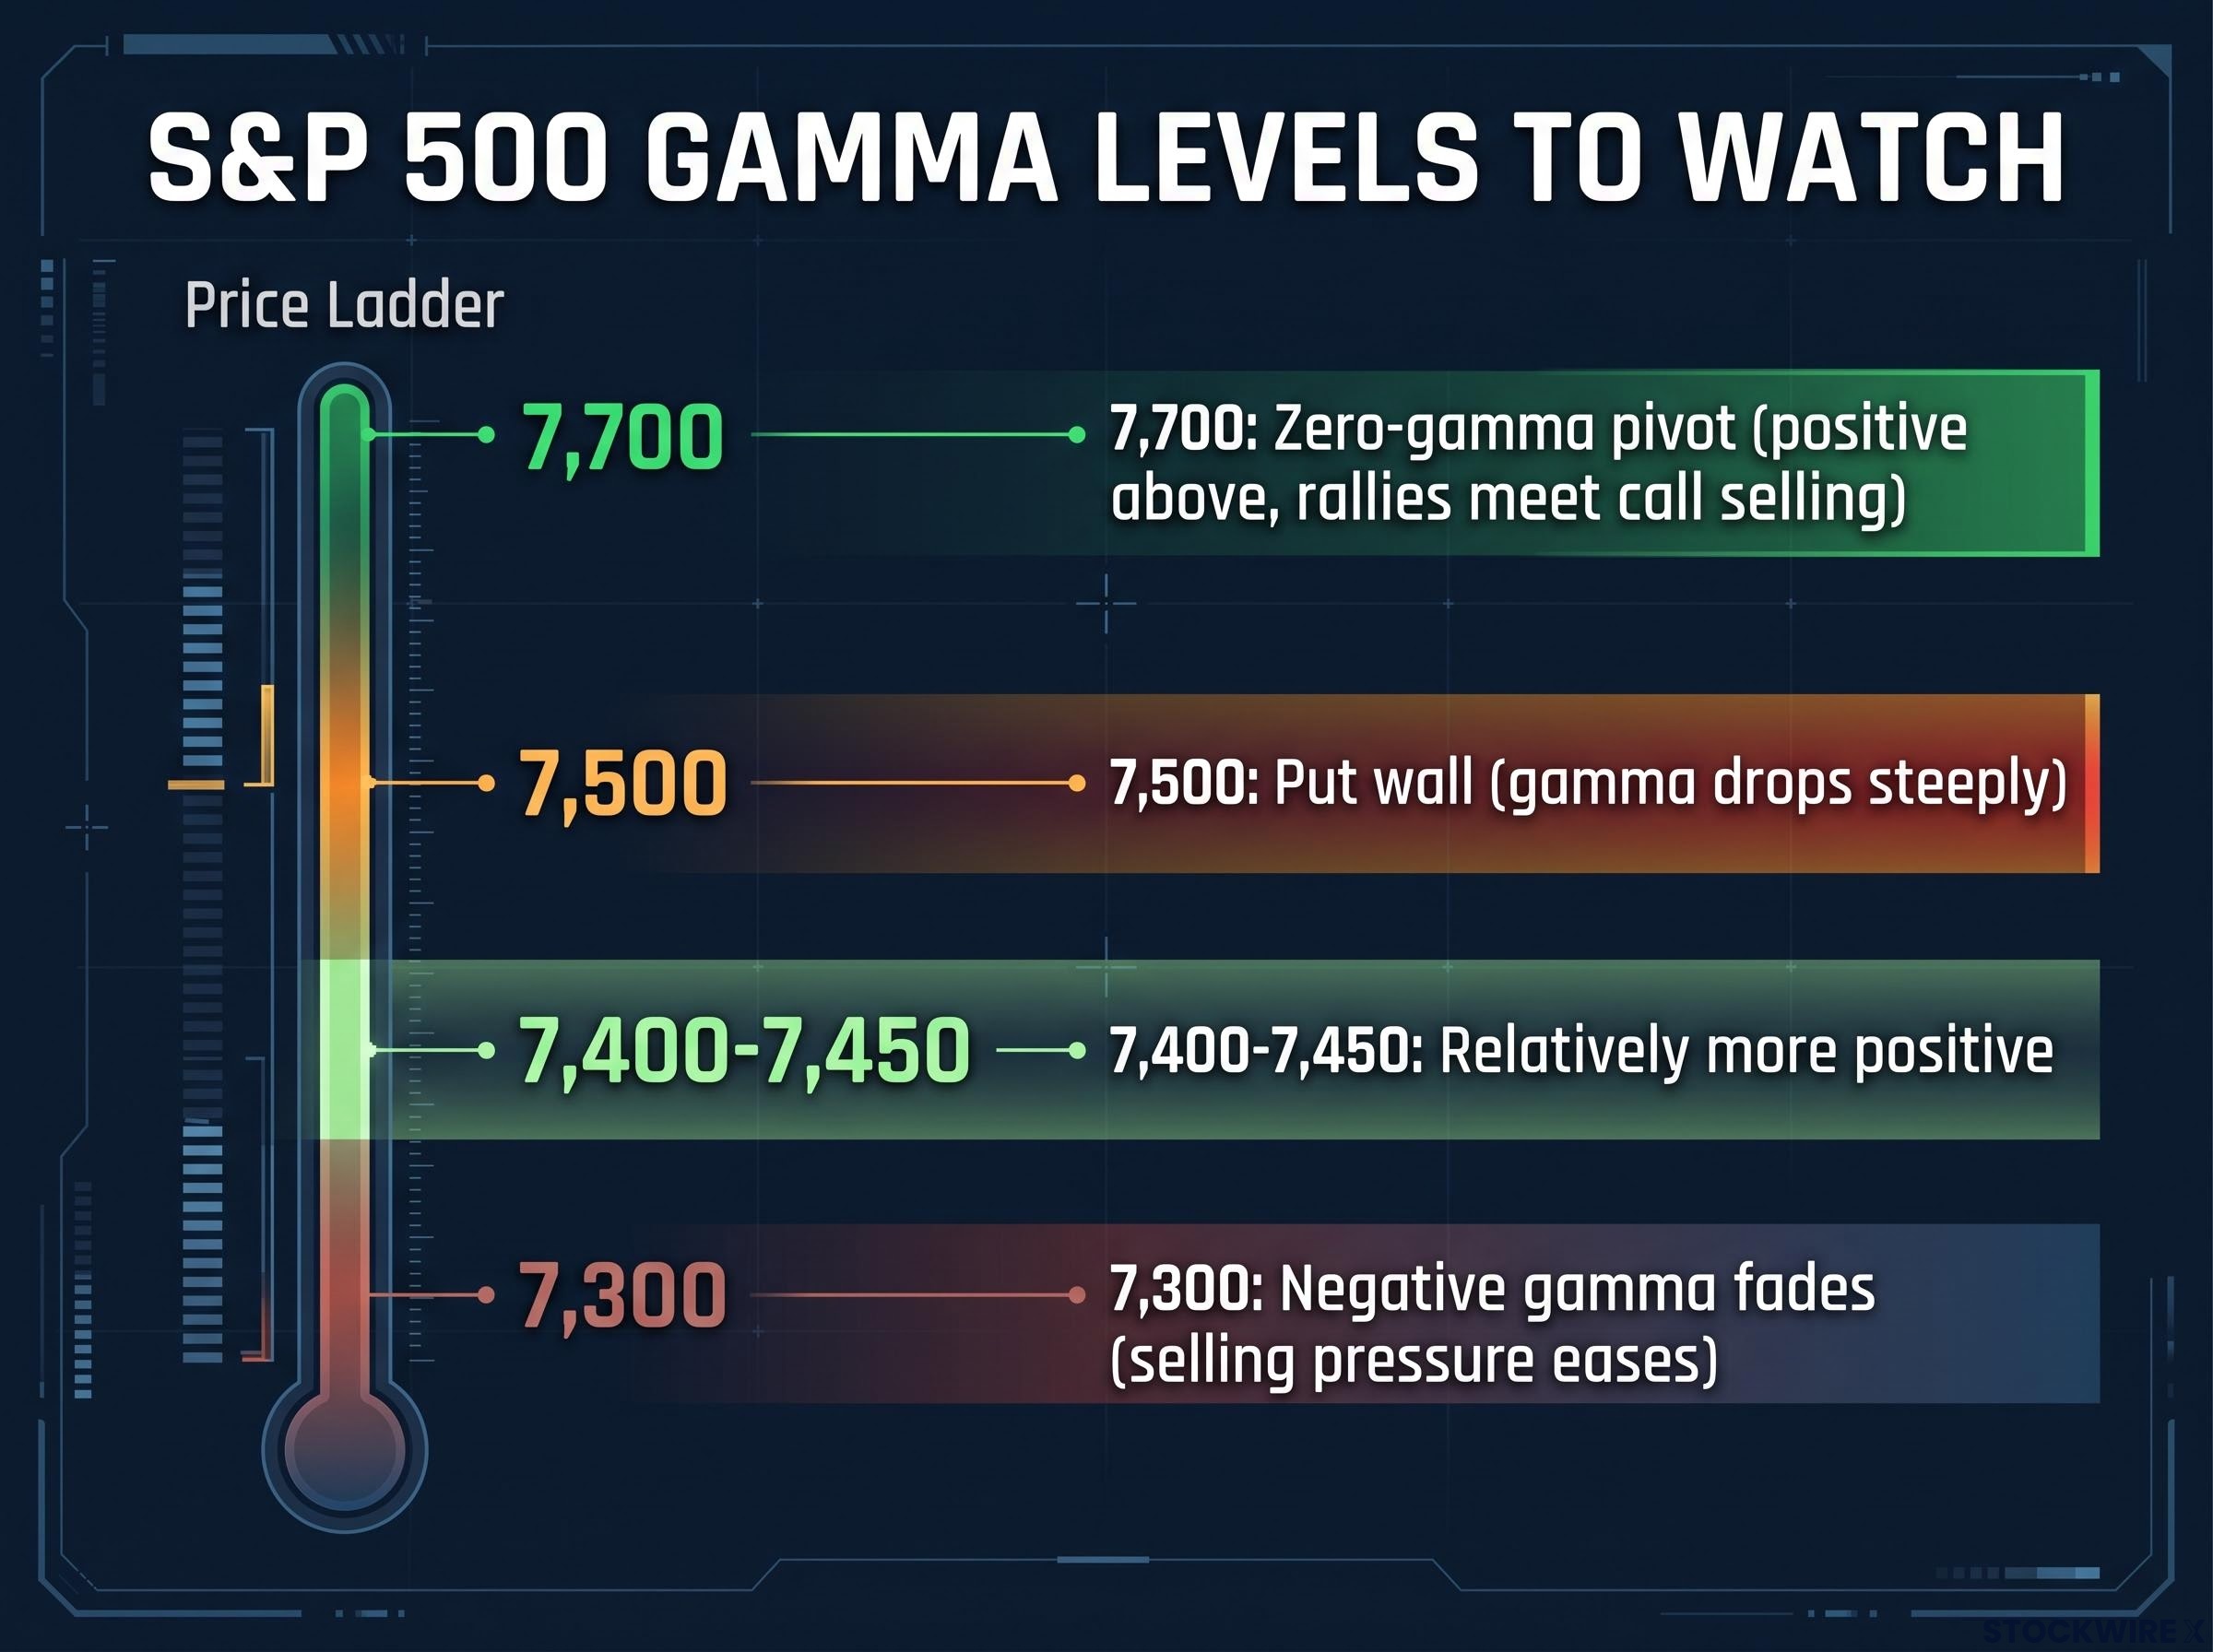
S&P 500 options positioning shows a zero-gamma pivot at 7,700 and a steep drop at the 7,500 put wall, with selling pressure easing near 7,300.
| Level | Gamma condition | Expected behaviour | Source | Confidence |
|---|---|---|---|---|
| 7,700 | Zero-gamma pivot; positive above | Rallies meet call selling | Proprietary positioning data | Mechanical estimate |
| 7,500 | Put wall; gamma drops steeply | Uncertainty re-intensifies below | Proprietary positioning data | Mechanical estimate |
| 7,400-7,450 | Relatively more positive | Possible pause in selling | Proprietary positioning data | Mechanical estimate |
| 7,300 | Negative gamma fades | Selling pressure eases | Proprietary positioning data | Mechanical estimate |
The Nasdaq showed the same mechanics. In QQQ terms, gamma turned more negative near 715 and flipped positive near 645, and the Thursday closing low near 6,478 lined up with where negative gamma dissipated.
Be clear about the source. These levels come from the commentator’s proprietary SGOI positioning data and SpotGamma-style commentary, and were not independently verified in accessible public sources. They go stale after large moves, and they show which levels matter if a decline happens rather than predicting one.
When the S&P approaches 7,700 or 7,300, expect the pace of the move to change, not necessarily its direction. These are zones to watch, not predictions to trade on.
Why did implied and realised volatility diverge?
Implied volatility is the size of the swings that options prices assume will happen. Realised volatility is the size of the swings the index actually produced.
On 4 November, realised volatility ran above implied in the S&P, the Nasdaq and the SMH semiconductor fund. Options were cheap relative to what the market was doing, and skews shifted into the close as traders bid up calls in anticipation of further gains.
Then Thursday dropped the index into negative gamma. Covering and deleveraging forced traders to pay up for protection, and the VIX overshot. By Monday and the following day, volatility had been crushed again.
Rebounds after a spike are often driven by short covering and de-risking rather than fresh buying, which helps explain why a green session can coexist with a VIX that stays elevated.
- Options underpriced: realised swings ran ahead of implied on the rally.
- Forced repricing: the fall into negative gamma triggered covering and pushed the VIX sharply higher.
- Volatility crush: as prices recovered, implied collapsed back toward realised.
Commentary-sourced reading According to the original commentary, 30-day realised S&P volatility was about 21% while the VIX sat near 20. No independently verified realised figure was found.
If that reading holds, options are no longer cheap. There is little room for the VIX to fall further without a clearing event, and the term structure already carries event premium for PPI, payrolls, retail sales, Nvidia earnings and VIX expiration.
A VIX below realised volatility tells you the market is underpricing swings it is already producing. Do not read a low VIX as protection.
How do falling oil, rising rates and an unwinding rotation add uncertainty?
On the surface, the macro news improved. Underneath, the picture got more fragile.
Oil and the Iran headline
Brent crude fell below $90 a barrel on 10 November after Donald Trump said the Iran war was “effectively over”, down from $108.37 on 2 November. Headlines from Israel suggest no agreement has been signed, and a reversal higher would complicate rates.
Rates and the Fed
Rates rose anyway. The 10-year Treasury yield reached 4.88% on 10 November, and the 2-year jumped 19.1 basis points to 4.738% on hotter-than-expected inflation data and rising expectations of a Fed hike.
| Measure | Level | Driver | Date |
|---|---|---|---|
| Brent crude | Below $90 | Iran de-escalation comments | 10 Nov 2026 |
| 10-year yield | 4.88% | Hot inflation data, hike expectations | 10 Nov 2026 |
| 2-year yield | 4.738% (+19.1 bp) | Expectations of a more aggressive Fed | 10 Nov 2026 |
The rotation unwind
In October, the equal-weight S&P 500 beat the cap-weighted index by about 5.7 percentage points, the widest monthly gap since April 2009. Morningstar data cited by MarketWatch showed the correlation between the two fell to 0.56 on 3 November, the lowest since 1990. Then hedge-fund net leverage dropped about 5% in a single day, the fifth-largest fall since 2010, as the 5 November selloff hit AI and chip names hardest.
Rate-sensitive sectors such as financials, biotech, housing and industrials fell on Thursday too, undercutting the very rotation meant to cushion tech. iCapital offered a counterpoint: correlations, volatility and high-yield spreads rose, but not to prior panic levels, which points to a severe event rather than a fully systemic one.
With oil no longer the main pressure, rates and positioning are now the live variables. The hiding places you might have used in October are no longer safe.
Which catalysts and seasonal patterns could finally clear the risk?
The next fortnight packs several potential turning points into a tight window.
The dated catalyst runway
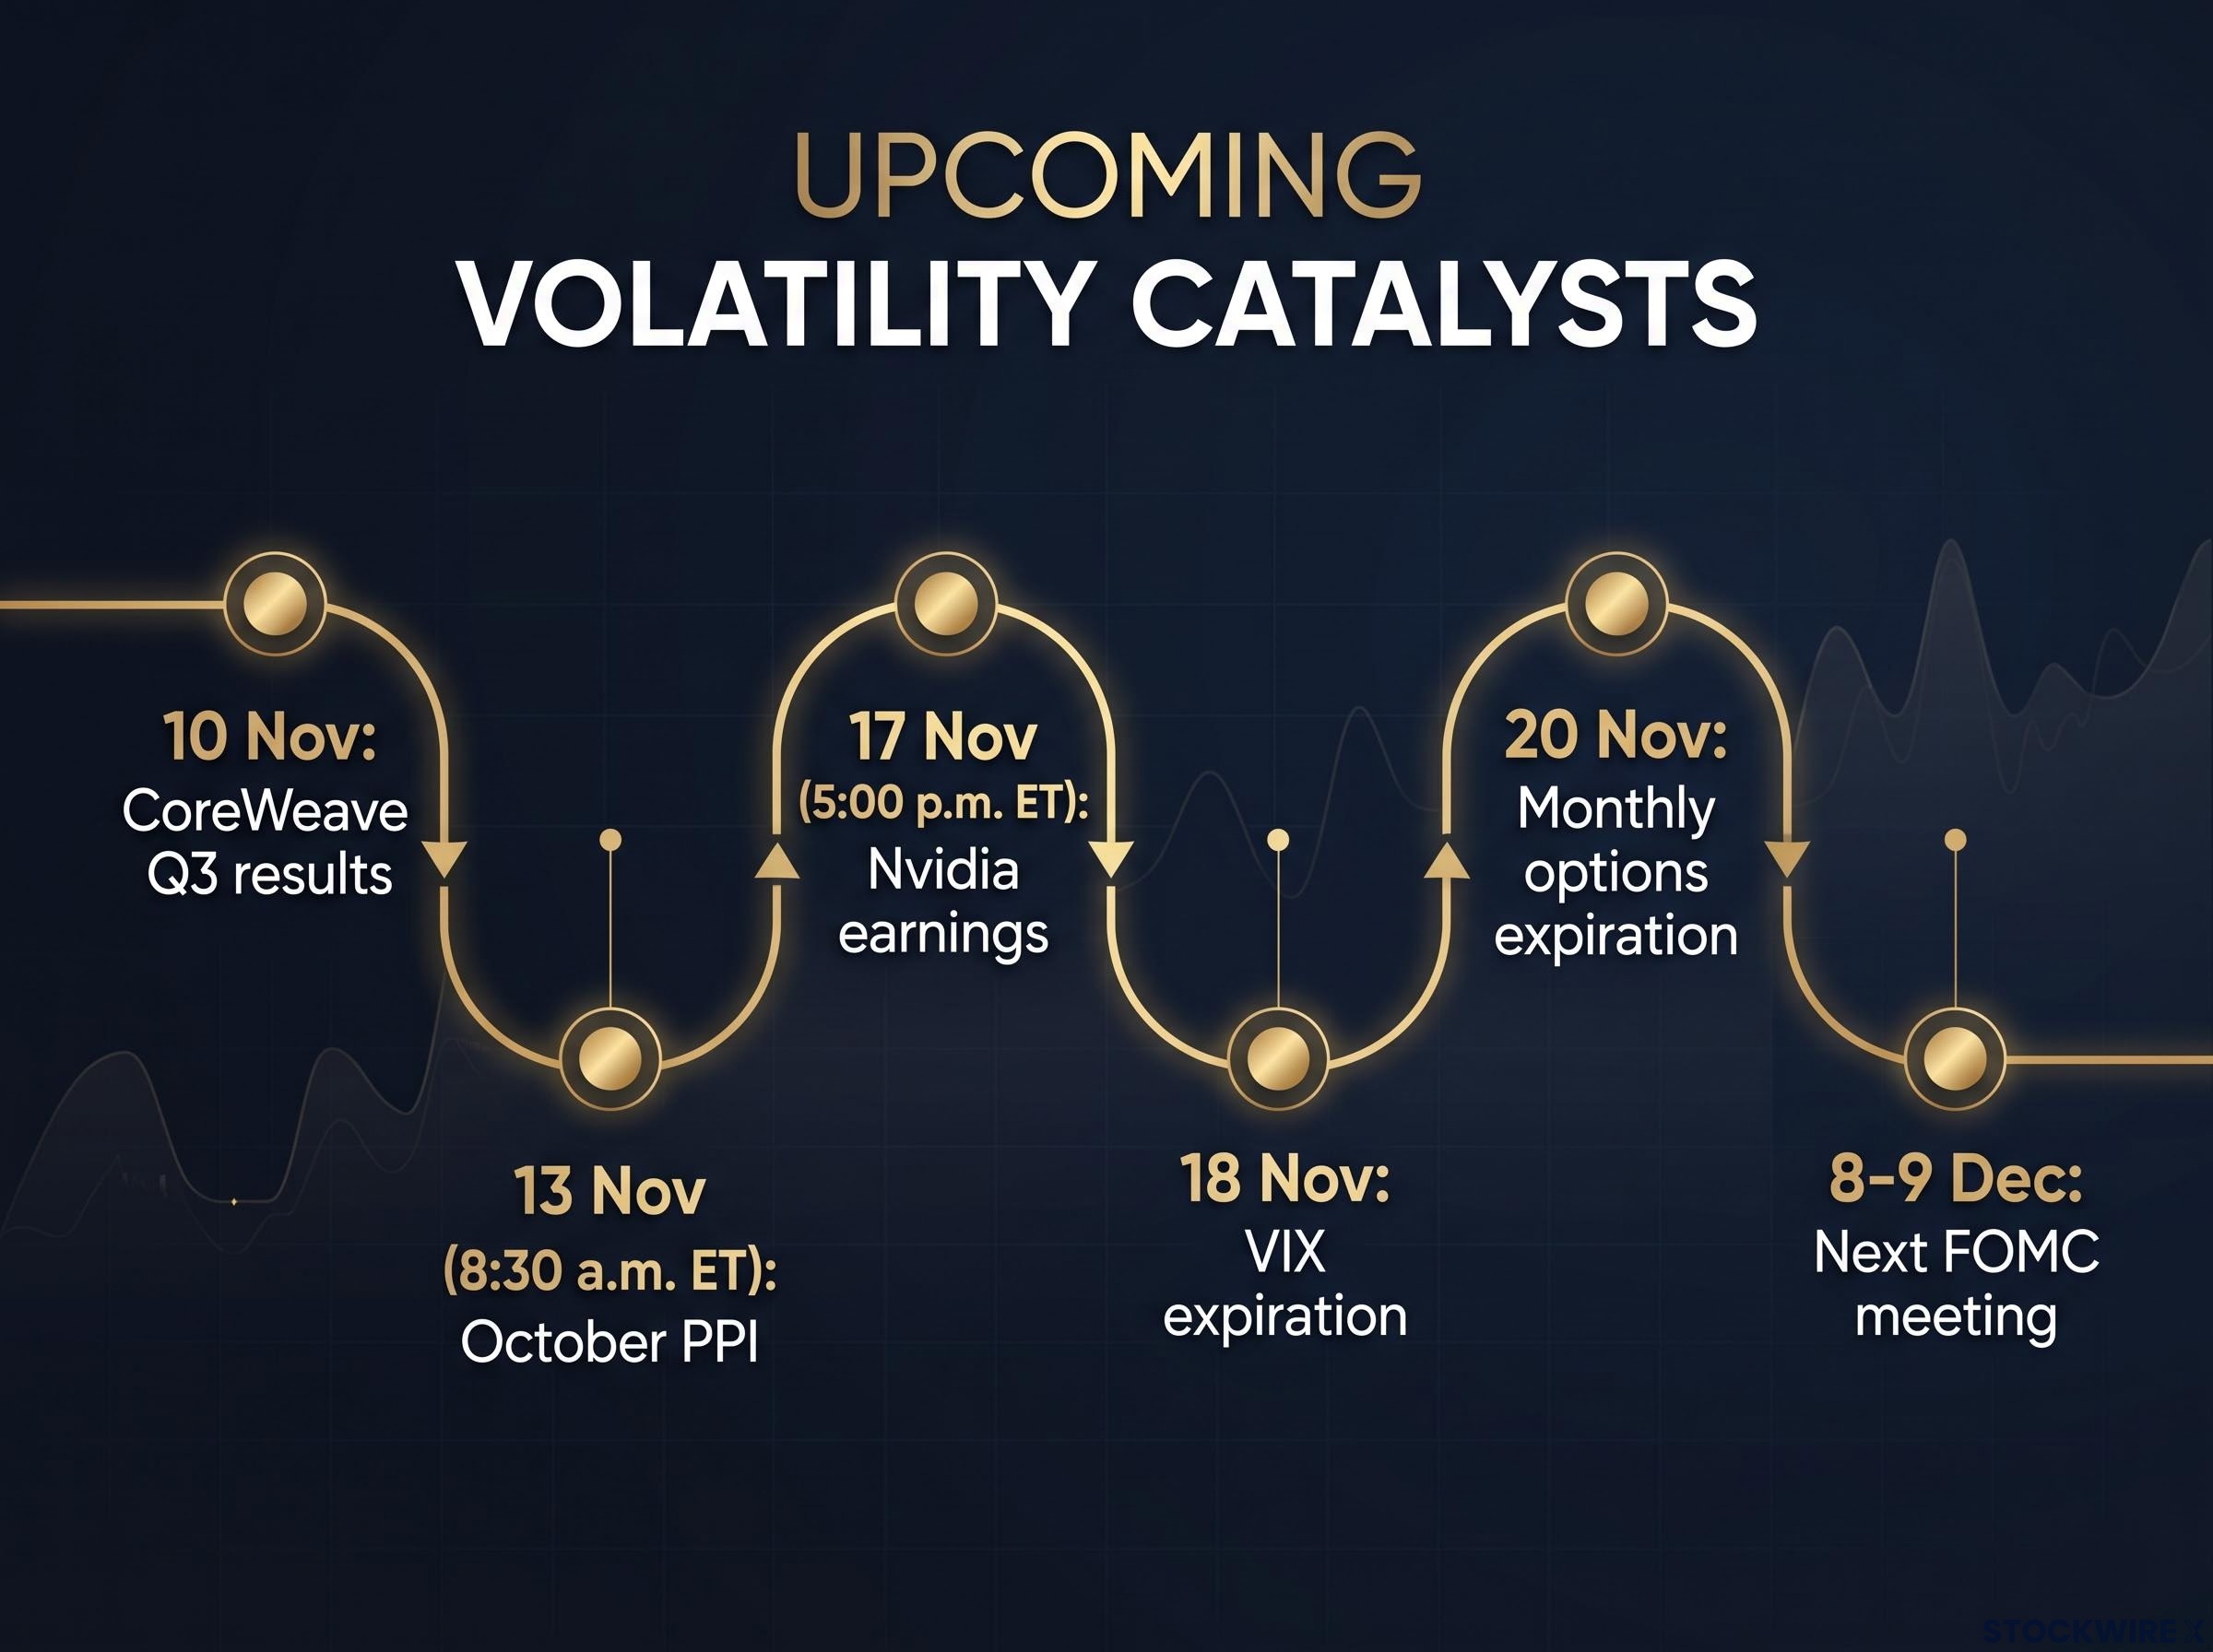
Key market risk events are concentrated between 10 Nov and 9 Dec, including critical inflation data and Nvidia earnings.
- CoreWeave Q3 results: after the close on 10 November, a read on weaker AI-trade names.
- October PPI: 13 November, 8:30 a.m. ET.
- Nvidia earnings: 17 November, around 5:00 p.m. ET.
- VIX expiration: 18 November (last trading day 17 November).
- Monthly options expiration: 20 November.
- Next FOMC meeting: 8-9 December.
Expiration matters because puts and VIX calls roll off. Once they are gone, dealers no longer need to hedge them, which eases the mechanical downside pressure.
The Thanksgiving scenario, and its limits
The commentary’s preferred scenario is a dip toward 7,300 into Nvidia, then a rally into the shortened Thanksgiving week, echoing last year’s roughly 5% decline into Nvidia expiration. It also argues stability is unlikely before 17 November unless the S&P reclaims 7,700.
Seasonality offers some support. Since 1960, the S&P 500’s median Thanksgiving-week gain has been 0.82%, positive in 45 of 65 weeks (69%). In nine of the ten prior cases where the VIX rose at least 50% in a day, the index was higher a month later, and a 247WallSt review found an average 17% gain a year after the 20 largest spikes, though that says little about the path in between.
There are limits. After Nvidia’s November 2025 report, the stock initially rose but the tech pullback continued. The SpaceX IPO shares fell about 5%, and the commentary flags liquidity needs for the Anthropic IPO as another weight.
These scenarios are speculative and subject to change based on market developments. Past performance does not guarantee future results.
Treat 17-20 November as the stretch where the risk could resolve in either direction. The seasonal tailwind does not remove the need for caution.
What to watch while volatility stays unsettled
You now have three lenses. Gamma positioning shows where moves are likely to speed up or slow down. Implied versus realised volatility tells you whether options are pricing the swings fairly. Oil, rates and the rotation unwind explain why the backdrop remains fragile.
Calm readings can be manufactured: large short-volatility exposure from systematic strategies suppresses the headline index without reducing underlying risk, which is why a quiet VIX is a poor all-clear.
Your decision points are concrete: whether the S&P holds or reclaims 7,700, whether it retests 7,300-7,350, and how it behaves through the 17-20 November cluster of Nvidia results and expirations.
Until one of those resolves, expect the swings to continue. They are the market’s way of searching for a clearing event, and the calendar now shows you when that search is most likely to intensify.
This article is for informational purposes only and should not be considered financial advice. Investors should conduct their own research and consult with financial professionals before making investment decisions.