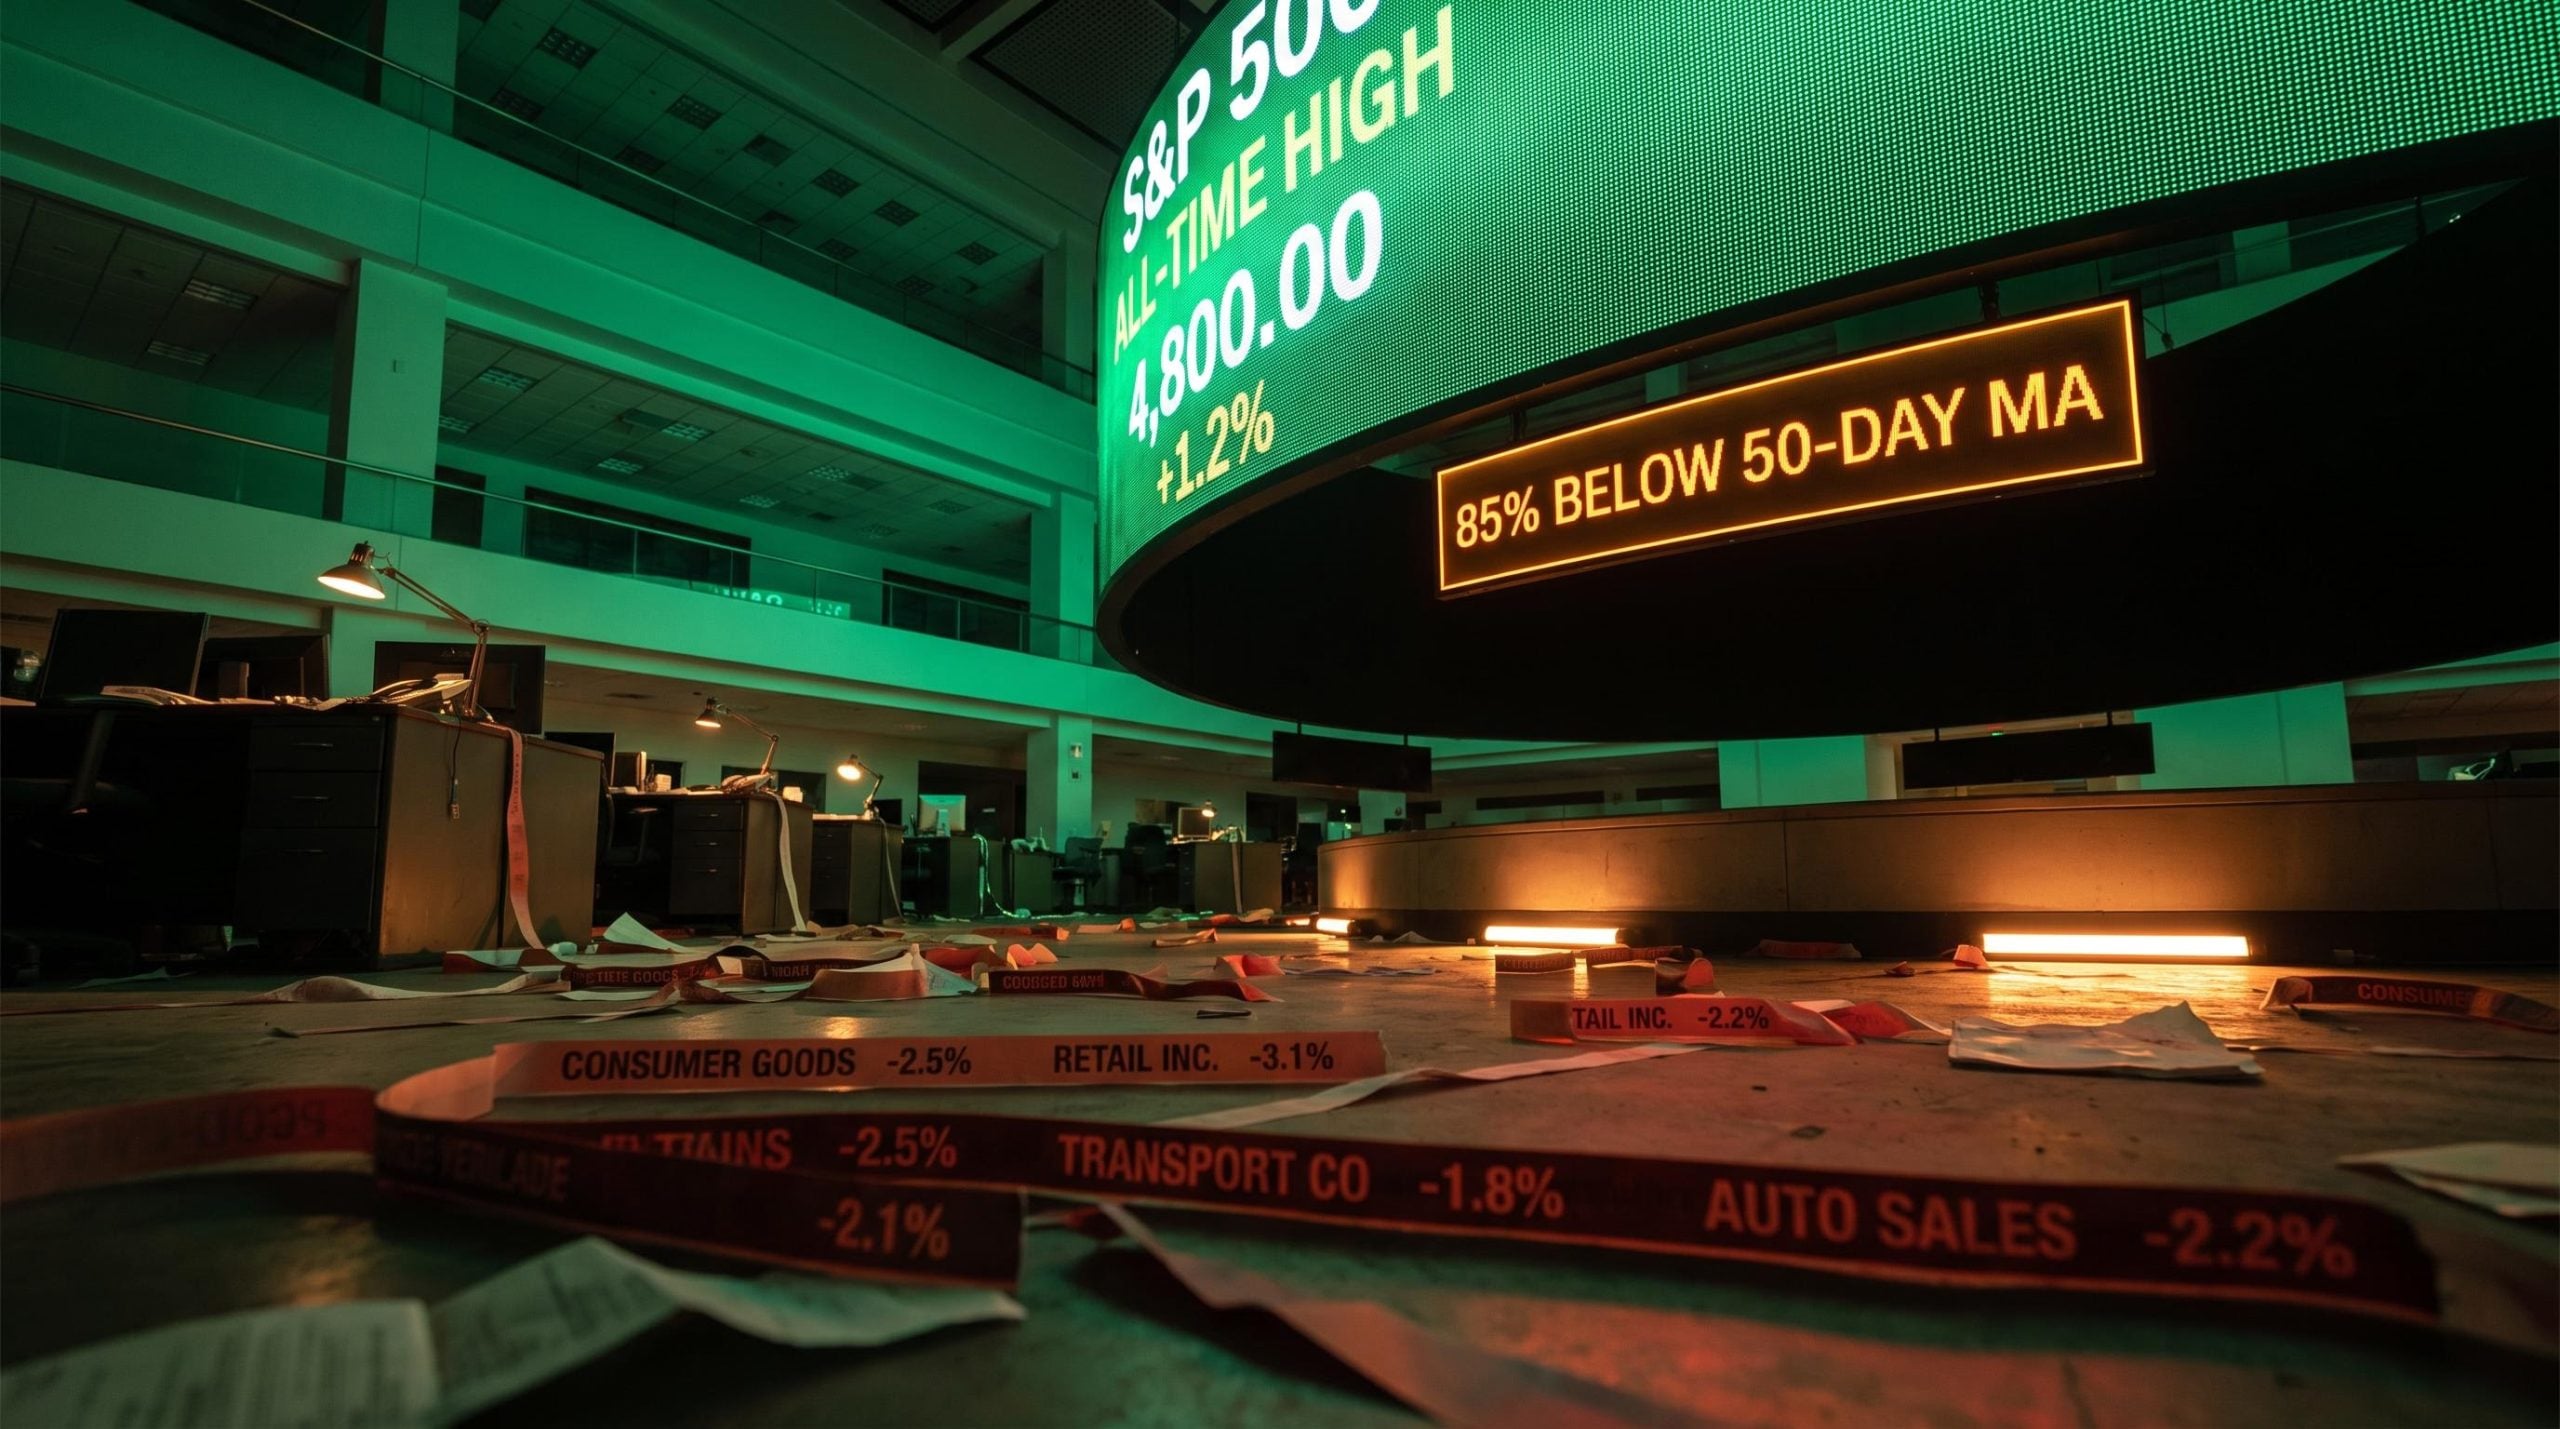
The S&P 500 and NASDAQ keep printing fresh records, and if you glance only at those numbers, the American economy looks like it is firing on every cylinder. Look one layer down, and a very different picture appears.
Beneath the headline euphoria of late 2026, the strength is dangerously narrow. A small cluster of artificial intelligence (AI) and mega-cap technology names is carrying the indices higher while retailers, banks, and transport stocks quietly erode. This is the defining feature of a narrow market rally: a handful of winners obscuring widespread weakness.
That gap matters because most investors own the market through index funds, which means the average portfolio may be far more exposed to a few crowded names than the balance implies.
Here is the framework for reading the real economic signals hiding beneath those record highs, so you can identify the vulnerabilities in your own holdings before the market does it for you.
The growing chasm between index headlines and market reality
Ask a floor-level practitioner what the market is doing and you get a very different answer than the ticker suggests. In late September, Chris Brecher, founder of TradingNest.tv and a former Chicago Board Options Exchange (CBOE) floor trader, ran a screen that captured the divide with brutal clarity.
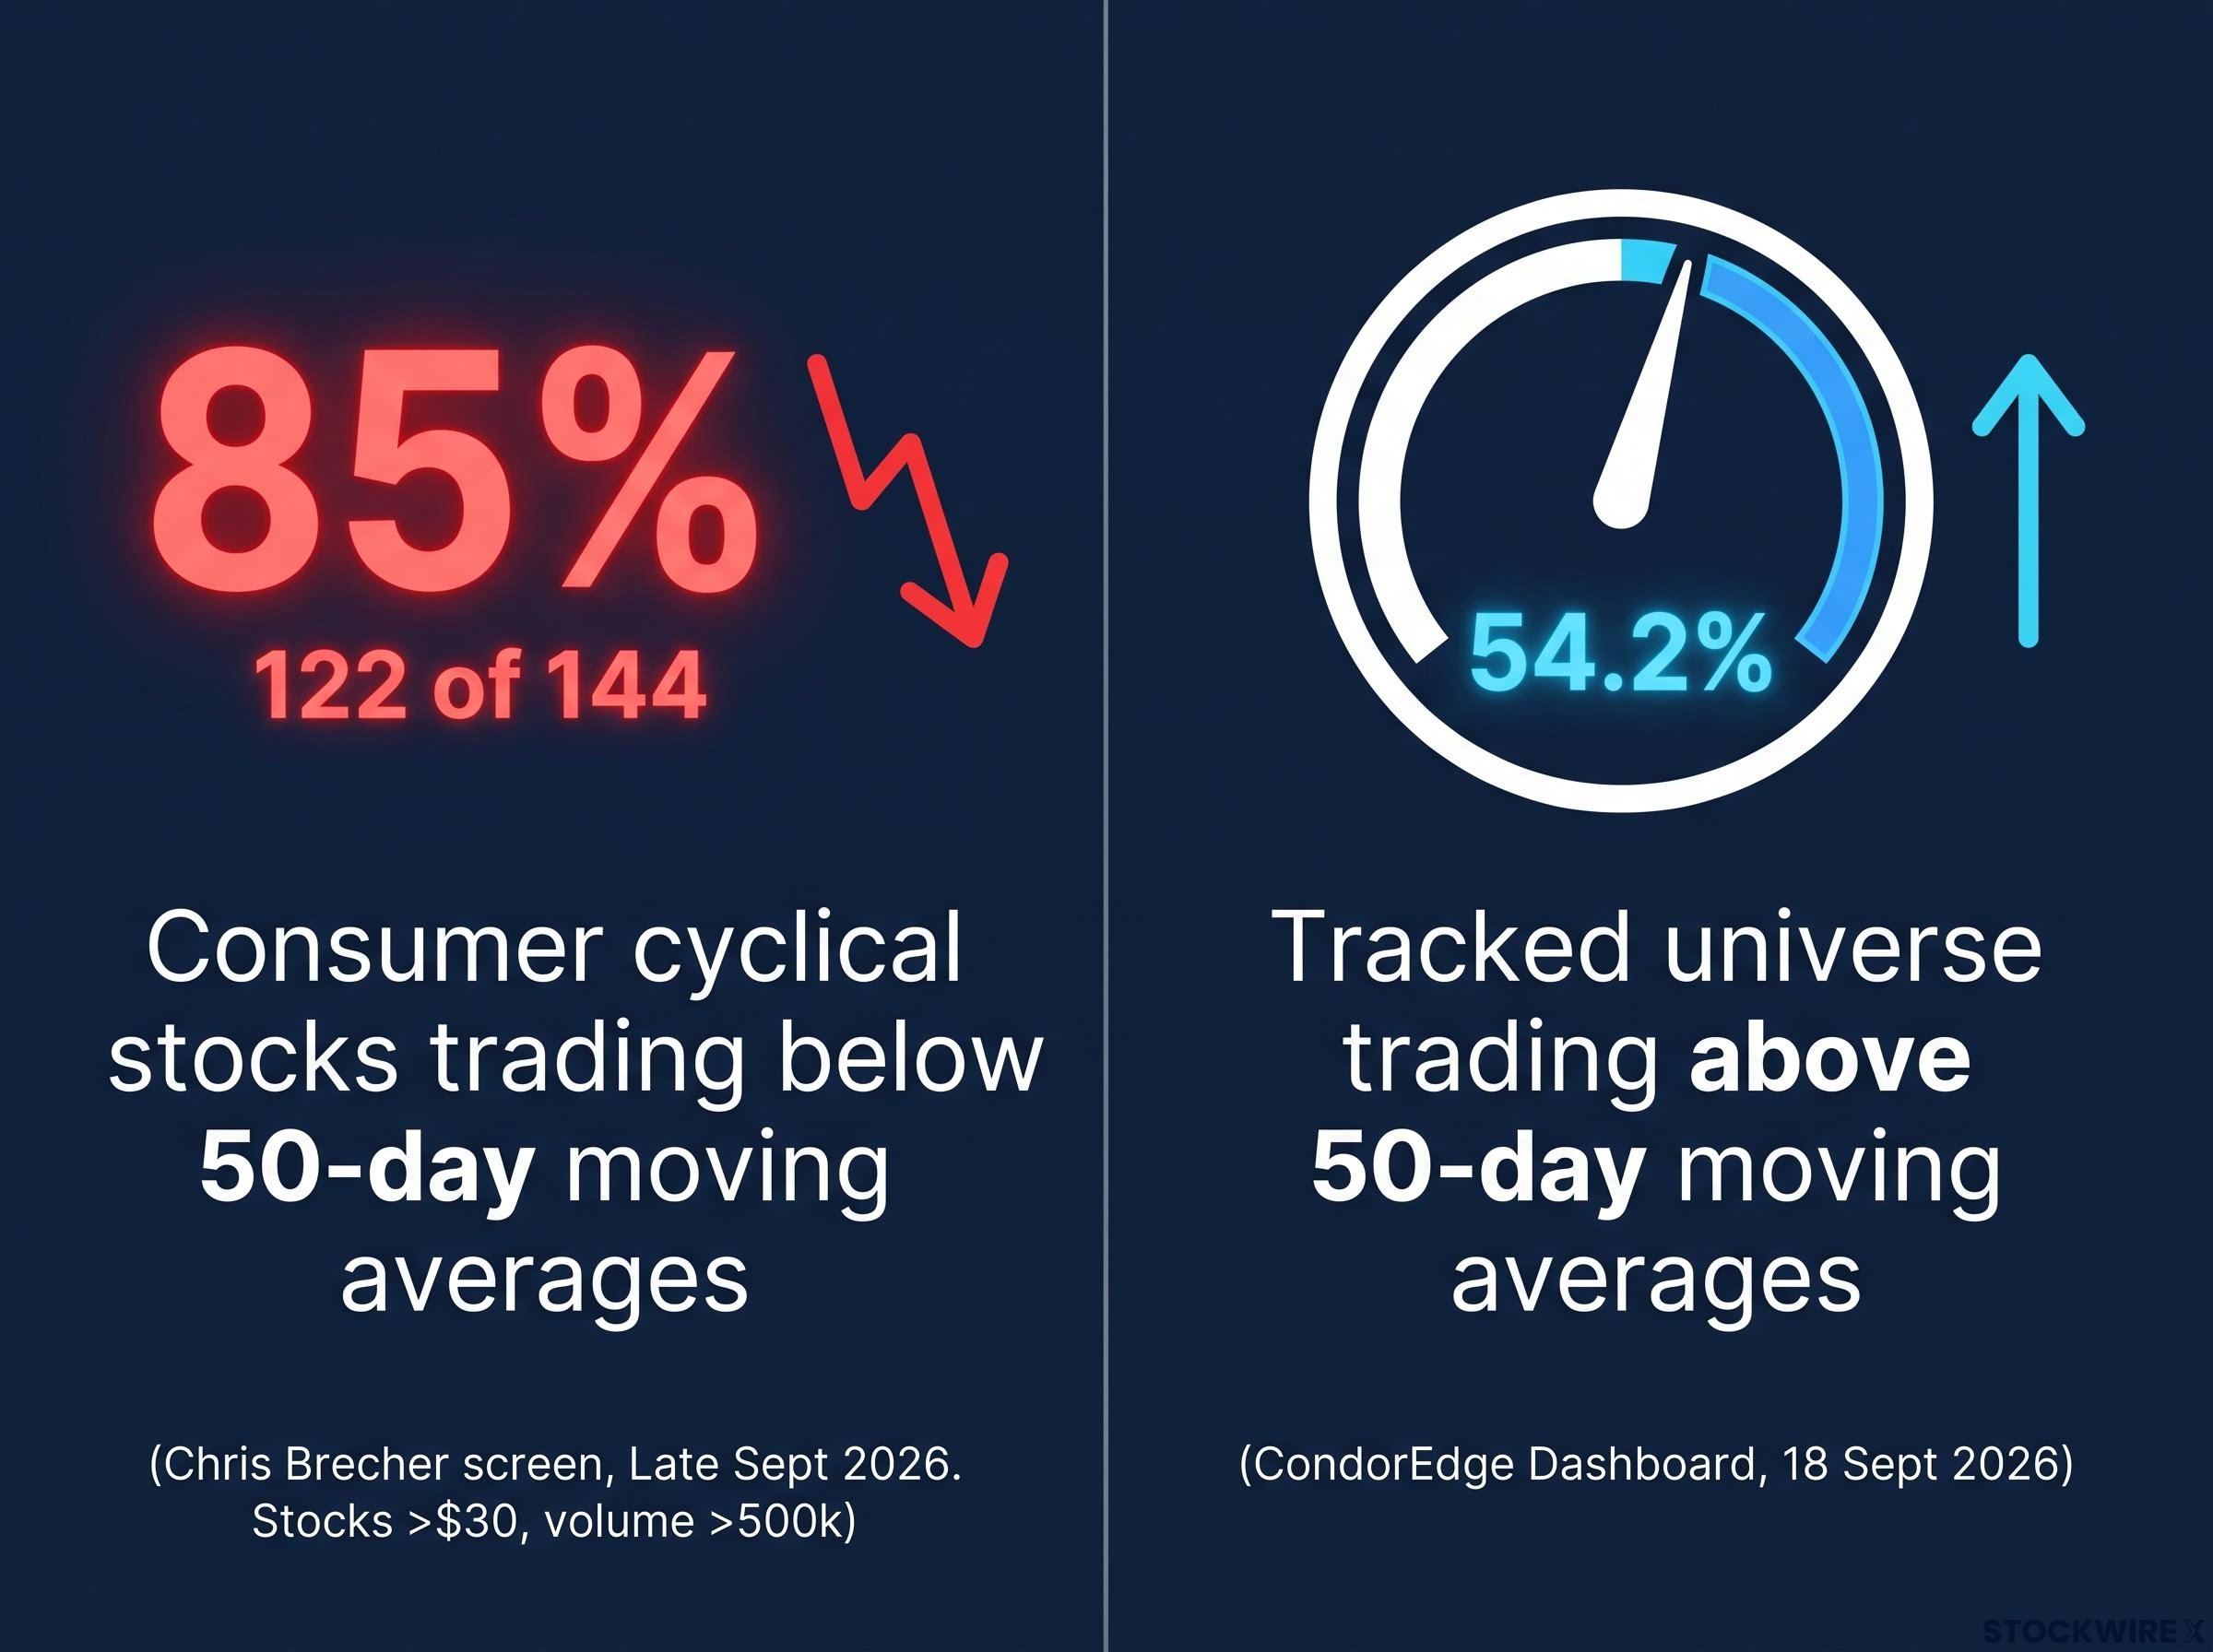
Filtering for consumer cyclical stocks priced above $30 with average daily volume over 500,000 shares, roughly 122 of 144 names, about 85% of that universe, were trading below their 50-day moving averages. The 50-day moving average is simply the average closing price over the previous 50 trading sessions, and slipping beneath it signals a stock has lost its short-term uptrend.
The reality beneath the rally Around 85% of screened consumer cyclical stocks were trading below their 50-day moving average in late September 2026, even as the NASDAQ notched fresh all-time highs.
The weakness is not confined to one corner of the consumer economy. It spans auto parts, internet retail, lodging, recreational vehicles, and travel services. Retail sector funds, high-yield bonds, bank indices, and transportation stocks were all sitting well below their short-term trend lines at the same time.
Transport had a specific problem layered on top: elevated diesel costs acting as a direct headwind for trucking names.
The broader breadth data tells the same story with less drama. CondorEdge’s Stock Market Breadth Dashboard, dated 18 September 2026, showed only 54.2% of its tracked universe trading above their 50-day moving averages. That means nearly half the market was already in a short-term downtrend while the indices celebrated.
Historically, market breadth readings as depressed as those recorded in mid-2026 have preceded drawdowns of 5-15% within 60 days roughly 80% of the time, a base rate that gives statistical weight to what the consumer cyclical screen was already signalling at the sector level.
Here is what that concentration tells you. When a few AI-related names drive the entire index, passive funds mechanically mask the decay spreading through traditional economic sectors. Your diversified portfolio might be far less diversified than the label suggests, because the weighting has quietly tilted toward the same crowded trade everyone else owns.
When big ASX news breaks, our subscribers know first
How capitalisation weights and buybacks distort the signal
If the economy is softening, why do the indices keep climbing? The answer sits in the plumbing of how those indices are built, not in market sentiment.
The S&P 500 and NASDAQ 100 are capitalisation-weighted, meaning each company’s influence is proportional to its total market value. Mega-cap technology and communication services firms carry outsized weights, so their strength can overwhelm weakness in dozens of smaller retailers, regional banks, and transport names combined.
Put simply, a struggling banking sector no longer drags the broad index down the way it once did. AI-driven giants have become large enough to keep the S&P 500 afloat on their own.
Index fund concentration risk compounds this distortion further: five mega-cap names controlled approximately 23% of the broad market index as of mid-2026, a level that has historically amplified drawdowns as sharply as it has inflated gains on the way up.
Layered on top of the weighting math is corporate financial engineering. Share repurchase programmes reduce the number of shares outstanding, which mechanically lifts earnings per share and supports the share price regardless of whether the underlying business is selling more to consumers.
That support is not constant, and this is where the vulnerability opens up. In the roughly five weeks before an earnings release, companies typically enter a buyback blackout period, voluntarily suspending repurchases. With that steady source of demand switched off, negative news and weak chart signals carry more weight than usual.
The structural factors keeping the indices aloft while the consumer weakens come down to three mechanisms:
- Capitalisation weighting: Mega-cap tech and communication services dominate index construction, so their gains dilute the visible impact of consumer sector declines.
- Share buybacks: Repurchase programmes lift earnings per share and prop up prices independent of consumer volumes, then pause during blackout windows before earnings.
- AI capital expenditure offset: Spending on AI infrastructure, cloud, and semiconductors drives strong technology and industrial earnings even when household consumption growth slows.

Understanding this machinery gives you permission to look past the headline number. A rising index in this environment does not necessarily reflect broad economic health; it can reflect investment-led corporate growth in a narrow slice of the market.
That distinction changes how you should read your own holdings. Instead of trusting the index level as a proxy for the economy, the more useful exercise is to assess each position by its actual exposure: is it riding the AI capital expenditure wave, or is it dependent on the consumer wallet that is now under strain?
Tracking the transmission of consumer credit stress
The market anxiety only becomes concrete when you look at what is happening to household balance sheets. The consumer cyclical weakness is not random; it has a catalyst, and that catalyst shows up in the credit data.
Federal Reserve Bank of New York data, published through its Liberty Street Economics research on 14 August 2026, showed that 12.92% of outstanding US credit card balances were 90 or more days delinquent in Q2 2026. That is a level of serious delinquency comparable to the stress that followed the 2008 financial crisis.
More telling than the level is the persistence. The same research noted that flows into serious delinquency, meaning the rate at which borrowers newly tip into the 90-day-plus bucket, have remained above Great Recession onset levels for the tenth consecutive quarter. This is not a one-off spike; it is a sustained trend.
FICO data reinforces the deterioration at the severe end. According to its US Bankcard Industry Benchmarking Trends report, two-cycle severely delinquent bankcard rates nearly doubled, rising from 1.1% in January 2022 to 2.1% in January 2026.
Federal Reserve FEDS Notes on consumer delinquency dynamics flagged that credit card and auto loan delinquency rates had reached levels not observed since the Great Financial Crisis, lending institutional authority to the pattern the New York Fed’s Liberty Street data captures at the balance level.
The picture is genuinely mixed, and that nuance matters for how much weight you place on it. TransUnion’s Q2 2026 report showed borrower-level 90-day delinquency at 2.26% while balance-level delinquency sat lower at 1.98%. The gap tells you the stress is concentrated among a growing pool of borrowers carrying smaller balances, largely a rising subprime population.
| Data Source | Metric Type | Q1/Q2 2026 Figure | Historical Context | Key Takeaway |
|---|---|---|---|---|
| NY Fed / Liberty Street Economics | Balances 90+ days delinquent | 12.92% (Q2 2026) | Comparable to post-2008 stress | Serious delinquency at multi-year highs |
| NY Fed / Liberty Street Economics | Flow into serious delinquency | Above Great Recession onset levels | 10th consecutive quarter elevated | Stress is persistent, not transitory |
| FICO | Two-cycle severely delinquent bankcard rate | 2.1% (Jan 2026) | Up from 1.1% in Jan 2022 | Nearly doubled at the severe end |
| TransUnion | Borrower vs balance-level 90+ DPD | 2.26% vs 1.98% (Q2 2026) | Driven by growing subprime pool | Distress concentrated in smaller balances |
The transmission mechanism explains why retail and transport stocks are breaking down first. Consumer financial stress starts as a spending slowdown, then flows into the fundamentals of the banks and credit card companies that extended the credit. Weaker retail demand, tighter lending, and rising defaults progressively feed up the chain.
Not every signal points to deepening crisis, and honesty about the data demands acknowledging that. KPMG’s August 2026 note found total delinquencies at 4.74% of outstanding debt in Q2, virtually flat, concluding that credit stress is elevated but not broadly worsening. Aggregate consumer debt has largely stabilised.
The nuance in consumer debt health matters here: credit cards represent only about 7% of total US household debt, so the severity of card delinquency data must be weighed against record household net worth of $184.1 trillion and near-historic-low mortgage delinquency rates that complicate a single-variable crisis thesis.
That leaves you weighing two truths at once. The persistent rise in severe delinquencies signals the consumer engine is sputtering, and you have to hold that hard data against the optimism of AI capital expenditure when deciding how much risk your own portfolio can carry right now.
Evaluating the vulnerability of concentrated leadership
Data explains the present. The harder question is what happens next, and that requires stress-testing your exposure to the handful of names holding the market up.
History offers a warning and a caveat in the same breath. Narrow leadership has preceded major tops, but it has also persisted far longer than sceptics expected before resolving.
Historical precedents for market bifurcation
The late 1990s is the reference point most strategists reach for. Technology and internet stocks powered the indices while traditional cyclicals and value names languished, and the eventual 2000 downturn became the textbook case of narrow breadth preceding a broad decline.
Yet that same period shows how patience can be punished. The Russell 2000 badly underperformed through 1999, then surged roughly 18% in the final quarter of that year, a late-cycle catch-up that caught the bears off guard before the top finally formed.
The 2015-2016 period repeated a milder version, with FANG names dominating returns while energy, industrials, and financials struggled, until factor leadership eventually rotated.
The strategist community is genuinely split on what this concentration means. On the cautionary side, Morgan Stanley’s Michael Wilson and Bank of America’s Savita Subramanian have argued that extreme concentration in mega-cap technology is a hallmark of late-cycle fragility, because a disappointment in just a few names can drag the entire index down.
On the sanguine side, Goldman Sachs strategists including David Kostin, alongside the BlackRock Investment Institute, have countered that concentration is justified when those companies deliver genuine outsized earnings and free cash flow tied to AI, cloud, and digital advertising.
Historically, these breadth divergences resolve in one of three ways:
- A broadening rally, where lagging cyclicals and small caps catch up to the leaders, as the Russell 2000 did in late 1999.
- A sharp correction in the leaders, where the crowded mega-cap names mean-revert and pull the index down with them.
- Prolonged persistence, where narrow leadership simply continues longer than expected, rewarding patience in the winners and punishing early rotation.
The practical read for you is uncomfortable but clear. Because concentrated leadership tends to resolve through either a sudden broadening or a violent correction, you cannot assume the current calm holds, and you need to know exactly how much of your return is riding on a small group of names.
Positioning for the resolution of a bifurcated market
The tension defining this market is between two forces pulling in opposite directions: robust AI capital expenditure lifting the index heavyweights, and deteriorating consumer credit health eroding everything else. Both are real, and the resolution will favour one over the other.
What to monitor from here matters more than any single data point. Watch the buyback blackout windows ahead of earnings, when the mechanical price support briefly switches off and weak names become more exposed. Watch upcoming retail earnings for confirmation of whether the credit stress is finally landing in reported results.
Balance is the operative principle in a bifurcated market. That means neither abandoning the structural AI winners nor ignoring the credit signals flashing across the consumer economy.
For investors exploring whether a broadening rally is the more likely resolution, our full explainer on small-cap rotation covers the institutional fund flow data, valuation discount, and historical precedents behind the Russell 2000’s recent outperformance of the S&P 500.
This article is for informational purposes only and should not be considered financial advice. Investors should conduct their own research and consult with financial professionals before making investment decisions. Past performance does not guarantee future results, and forward-looking scenarios are speculative and subject to change based on market developments.