
A trader who spent more than four decades in the options business, including years on the CBOE floor, eventually did something that would puzzle most retail traders learning the craft today. He almost entirely stopped buying options.
Not because he lost his conviction on direction. Because the mechanics of holding long calls and puts stopped making sense once he understood how markets actually behave for the majority of the time.
This is a practical case study in how professional options thinking evolves, and why the endpoint of that evolution matters if you are still standing at the starting line. The shift from directional buying to selling premium inside defined-risk structures is not a matter of taste. It is a response to a market that spends most of its life going nowhere in particular.
What follows is the practical logic behind a 40-year strategic evolution, and the specific decisions it suggests for anyone trading options with limited capital and limited screen time. You are about to get an insider account of why the tools most retail traders reach for first are often the ones professionals abandon last.
Why experienced traders stop buying options outright
Every new options trader starts in roughly the same place. Buy a call if you think it goes up. Buy a put if you think it goes down. Wait for the move, then collect.
It feels intuitive because it is directional and the risk is capped at what you paid. The problem is not the logic. The problem is what happens to that long option every single day you hold it.
That daily bleed is called theta, and it is the reason experienced traders drift away from outright long positions. Theta is time decay: the amount of value an option loses each calendar day purely because it has less time left to expiry. For a long option holder, theta is always working against you.
SEBI data from FY22-FY24 found 93% of retail derivatives traders lost money, a figure that illustrates precisely why the pattern of how options buyers lose money is not a random outcome but a structural consequence of theta erosion, implied volatility crush, and the compounding probability problem of needing direction, magnitude, and timing to align simultaneously.
What theta actually costs over time
Consider a hypothetical long call bought for a directional bet. Even if the underlying stock sits perfectly still, that option loses a measurable slice of value with each passing day. The closer you get to expiry, the faster that erosion accelerates.
Hold it for a week and the drip becomes a stream. Hold a near-expiry option for a month and time decay alone can dismantle the position, no adverse price move required.
Time decay erodes long options every day the market fails to move far enough, fast enough. Most days, it does not.
That last point is the whole game. According to the practitioner account behind this piece, markets spend the bulk of their time in moderate, choppy ranges rather than sustained directional trends, which structurally disadvantages any strategy that needs a large, fast move to pay off.
Empirical research on market trending versus reversion regimes supports the practitioner view that most financial markets spend the majority of their time in mean-reverting, range-bound conditions rather than sustained directional trends, which structurally disadvantages strategies requiring large, fast moves.
To profit from a long option, three things have to line up:
- You need to be correct on direction.
- The move needs to be large enough in magnitude to clear your premium plus the strike.
- The move needs to happen fast enough to beat theta.
Miss any one and you lose, even when your view is right. Over dozens of trades, that becomes a compounding probability problem rather than a single unlucky outcome.
If you have been buying options regularly and feel like you keep getting the direction right yet somehow still lose money, this is almost always why. Theta erodes the position before the move arrives, and understanding that is the prerequisite for every more sophisticated structure discussed below.
When big ASX news breaks, our subscribers know first
How the professionals shifted: from direction to structure
The move away from buying options is not a sudden conversion. It is a stack of realisations that eventually leave only one rational endpoint.
First realisation: markets are choppy, not trendy, most of the time. Second: theta is a constant tax on anyone holding long options. Third: capital and margin dictate what you can actually hold.
Put those together and the destination becomes obvious. Sell premium so theta works for you, and cap the risk so a single bad move cannot wipe you out. That is the logic behind vertical spreads, butterflies, and their more advanced cousin, the broken-wing butterfly.
The professional motivation here is not sophistication for its own sake. It is about choosing a trade structure where the market’s typical behaviour, moderate chop rather than a big directional trend, works in your favour rather than against it. The retail default does the opposite: buy the cheap option most likely to deliver a huge percentage gain, and accept the low probability that comes with it.
| Structure | Maximum loss | Theta profile | Margin treatment |
|---|---|---|---|
| Long call or put | Premium paid | Negative (works against you) | Full premium at risk |
| Standard butterfly | Defined at inception | Broadly positive near target strike | Favourable (capped loss) |
| Broken-wing butterfly | Defined but asymmetric | Positive, skewed by wing design | Favourable (capped loss) |
What makes a butterfly “broken-wing”
A standard butterfly uses equal distances between its three strikes, producing a symmetric payoff. A broken-wing butterfly deliberately breaks that symmetry by using unequal gaps, which shifts the payoff curve to one side.
Butterfly spreads have become more relevant as 0DTE contracts now account for roughly 65% of all SPX options volume, creating intraday volatility profiles that reward precision defined-risk structures over the directional long options that dominated retail flow in earlier eras.
The research offers a grounded put example on a stock trading at 100: buy the 105 put, sell two 100 puts, buy the 95 put. Skewing the wings widens the profit zone on one side while concentrating more risk on the other, and it can push the break-even further from current price. One SPX broken-wing butterfly example is described as placing the break-even roughly 26 points out-of-the-money at the time of the trade, though that figure is unverified.
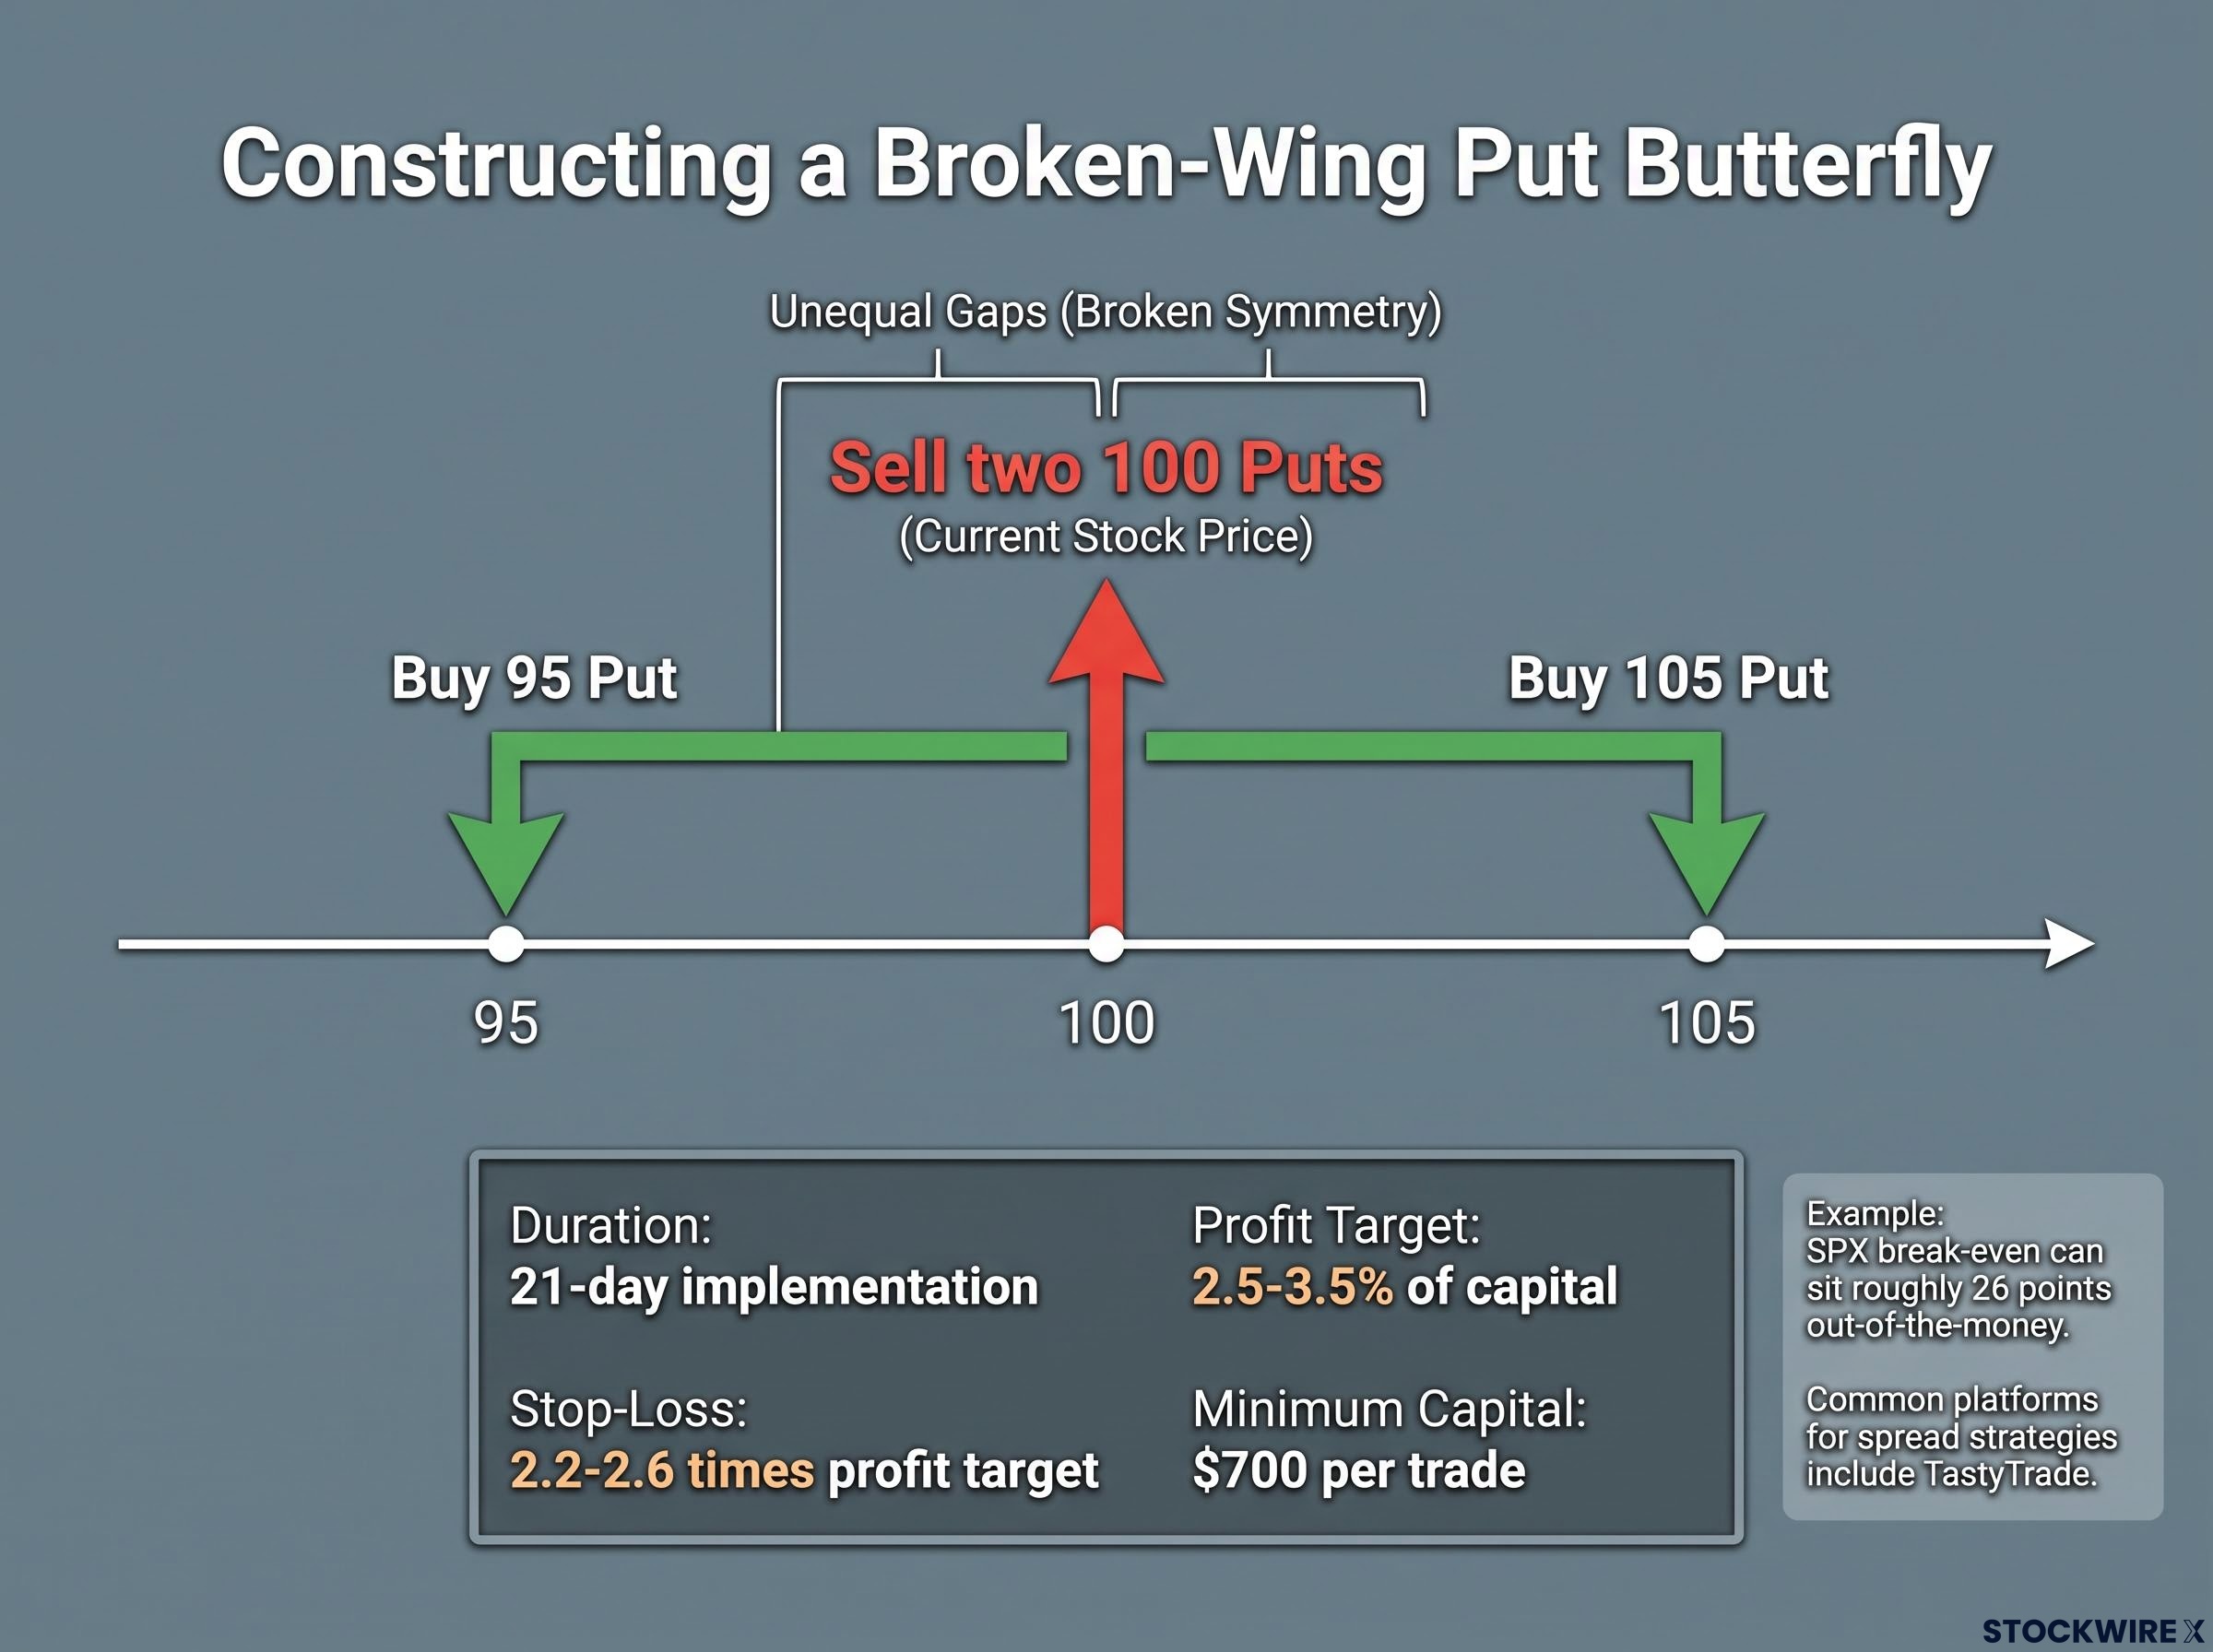
For retail traders wanting a systematic version, one 21-day broken-wing put butterfly implementation described in the research targets profits of 2.5-3.5% of capital, sets stop-losses at roughly 2.2-2.6 times the profit target, and recommends a minimum of $700 per trade to absorb drawdowns. Bajaj Finserv describes the same family of structures as a four-leg spread with unequal gaps between three strikes, and platforms such as TastyTrade are commonly cited in discussion of spread and butterfly strategies. The takeaway for you is that these structures let you harvest theta while keeping the worst case known in advance.
What options are (and why they behave the way they do)
Before going further, it is worth grounding the mechanics, because the strategies above only make sense once you feel how an option actually moves.
At its simplest, a call gives you the right to buy an asset at a set price, and a put gives you the right to sell at a set price. The premium is what the buyer pays for that right, and the seller collects it in exchange for taking on the matching obligation.
The trap is thinking of an option as a pure directional bet. It is not. It is a multidimensional exposure governed by the Greeks, and three of them matter most for everything covered here.
- Theta is time decay, the value an option loses each day as expiry approaches. It is always negative for a long option, so holding one means time is quietly draining your position even when the price sits still.
- Vega measures sensitivity to implied volatility, the market’s expectation of future price swings. If implied volatility rises, a long option gains value even if the underlying does not move at all, which means buying an option makes you implicitly long volatility.
- Delta measures sensitivity to the underlying’s price direction, how much the option moves for each dollar move in the asset. It is the closest thing to the directional bet most beginners think they are placing.
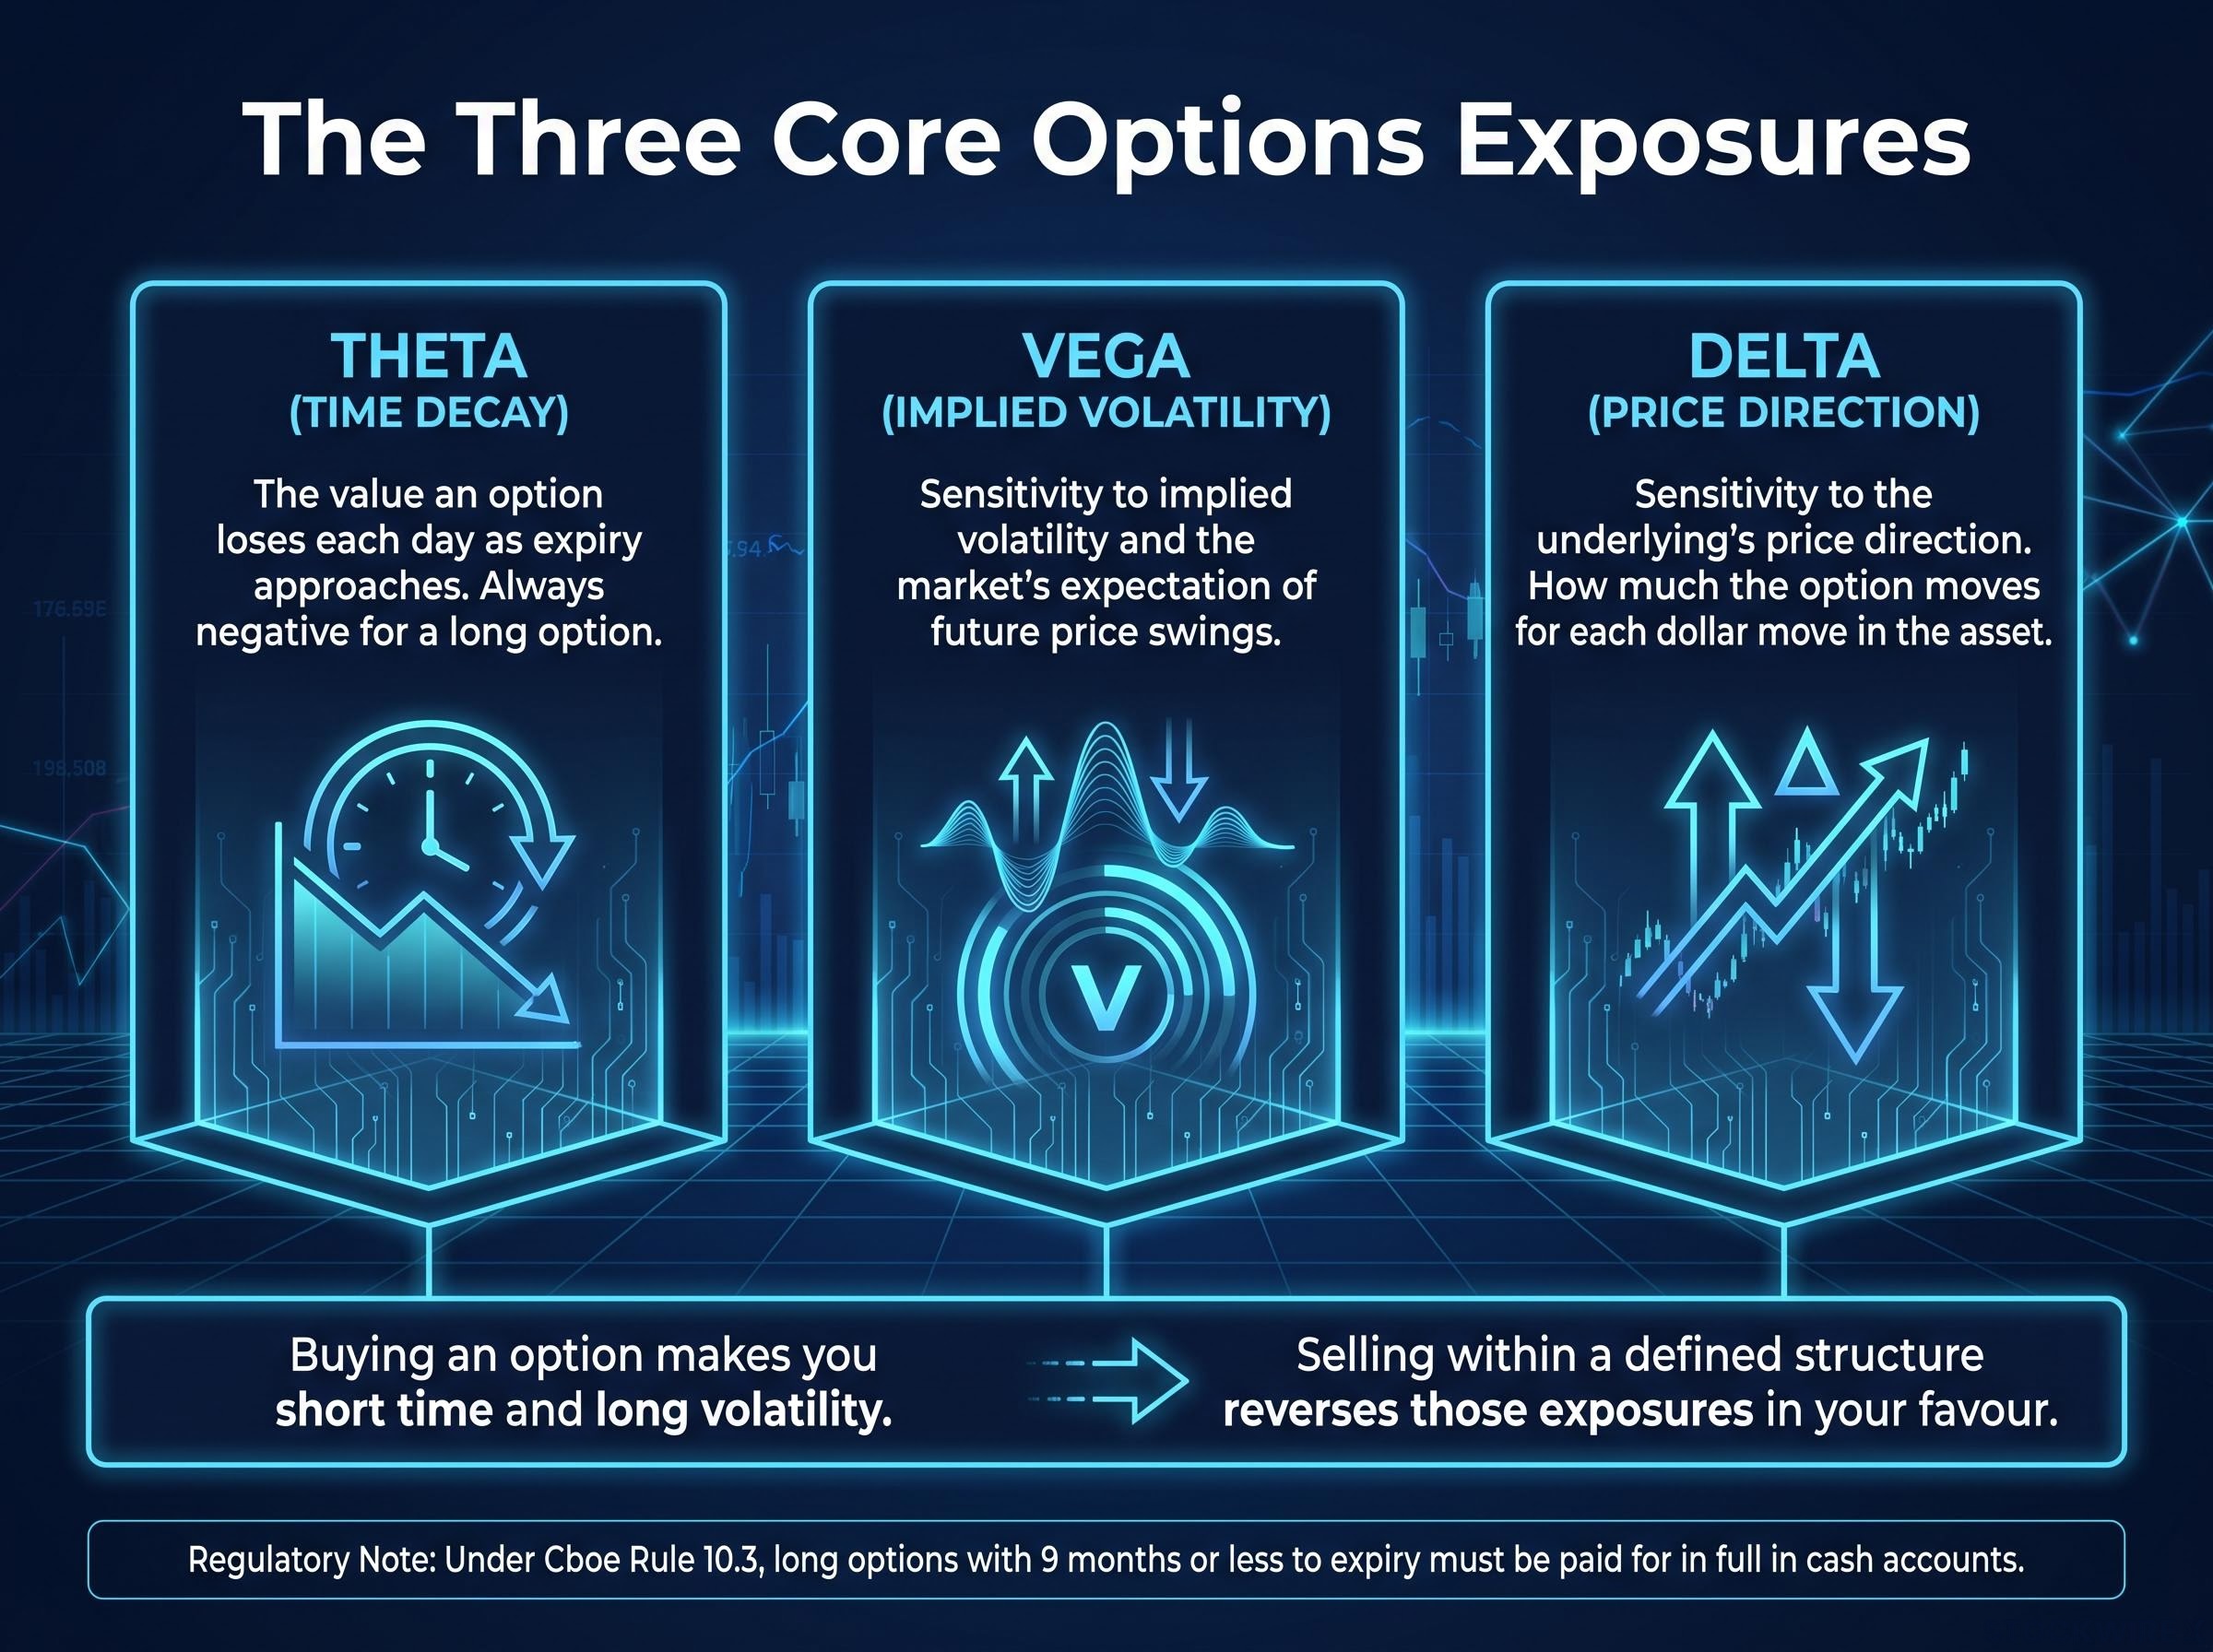
Here is where theta and vega interact in a way that matters for anyone who cannot watch positions all day. When you buy an option, time works against you and you are exposed to volatility swings. When you sell premium inside a defined structure, theta flips to your side, so the mere passage of time starts working in your favour.
Buying an option makes you short time and long volatility. Selling one within a defined structure reverses those exposures in your favour.
Regulation reinforces just how much is at stake in a long option. Under Cboe Rule 10.3, long options with 9 months or less to expiry must be paid for in full in cash accounts, treating the entire premium as at-risk capital.
Once you see that a long option is simultaneously a bet on direction, on time, and on volatility, the professional migration toward selling premium makes sense. It lets you choose which of those exposures to harvest, rather than carrying all three passively and hoping the price rescues you.
Why naked premium-selling stays out of reach for most retail traders
The natural next question is obvious. If selling premium is so advantageous, why not just sell options outright?
The professionals do exactly that for their own accounts. The reason you probably cannot is not skill. It is margin.
Selling a naked call or put, meaning without a protective long option behind it, exposes the broker to potentially open-ended losses, so they demand substantial collateral. According to IBKR data from September 2026, a naked stock option requires the premium plus the greater of 20% of the underlying price minus any out-of-the-money amount, or 10% of the underlying price. For index options, the same structure applies but with 15% in place of 20%.
The generic Reg T baseline, per OptionsNest data updated in July 2026, mirrors this: the greater of 20% of the underlying minus the out-of-the-money amount plus premium, or 10% of the underlying plus premium.
| Position type | Margin method | Example on a $100 stock | Capital efficiency |
|---|---|---|---|
| Naked short call | Premium + greater of (20% underlying − OTM) or 10% underlying | Roughly $2,000+ per contract | Low |
| Naked short put | Premium + greater of (20% underlying − OTM) or 10% strike | Roughly $2,000+ per contract | Low |
| Defined-risk vertical spread | Margin set to capped maximum loss | Limited to width of spread minus credit | High |
In plain terms, selling a single naked call on a $100 stock can tie up thousands of dollars, sharply limiting how many positions a retail account can hold at once. That is the specific reason a trader with a $25,000 account cannot simply replicate what a professional does. The formulas are not abstract regulatory text; they are the barrier itself.
How defined-risk changes the margin equation
Defined-risk structures solve this by capping the worst case at the moment the trade is opened. When the maximum loss is known, the broker can set margin equal to that worst case rather than to open-ended notional exposure.
The result is a far smaller and more predictable capital requirement. A vertical spread ties up only the width of the spread minus the credit received, not a large slice of the stock’s notional value. Cboe Rule 10.3 margin tables provide the regulatory basis for this favourable treatment of limited-risk combinations.
There is still a catch. FINRA Regulatory Notice 21-15 confirms that “almost all option spread transactions are required to be in a margin account,” so even the defined-risk path requires margin approval. Brokers are also permitted to layer additional house requirements on top of the regulatory minimum, which means the real barrier can sit higher than the formula alone suggests.
FINRA Regulatory Notice 21-15 confirms that almost all option spread transactions must be held in a margin account, meaning even defined-risk structures require broker approval before you can access them.
Using equity-bond correlation to validate chart-based entries
There is one more tool from the practitioner playbook worth understanding, and it is deliberately a secondary one. It does not generate trade ideas. It confirms them.
The methodology described in the research uses the relationship between equities and bonds as a second layer on top of chart-based signals. When both asset classes agree, a technical setup is treated as more reliable. When they disagree, caution is warranted.
Equity-bond correlation reached its most extreme negative reading since 1996 in mid-2026, according to UBS research, meaning the same cross-asset relationship the practitioner methodology uses as a confirmation filter has been operating in an unusually pronounced regime that amplifies both the signal’s reliability and the cost of ignoring it.
The core read is the classic risk-on, risk-off signal. Rising equities alongside falling bond prices, meaning rising yields, points to growth confidence and validates a bullish equity chart. Rising equities alongside aggressive bond buying, meaning falling yields, can hint at underlying macro stress and argue against aggressive premium-selling.
Bond proxies such as TLT or a broad aggregate bond index give you a practical, real-time instrument for tracking this relationship without needing a professional data terminal.
Applied to premium-selling, the logic is straightforward. Strong equity technicals with bonds selling off, a genuine risk-on backdrop, may support more aggressive out-of-the-money put selling. Equities rising while bonds also rally is a divergence that should prompt tighter risk limits or a preference for more conservative defined-risk structures.
Here are the four scenarios worth watching:
- Equities up, bonds down: risk-on, validates bullish equity setups.
- Equities up, bonds up: divergence, treat the chart signal with caution.
- Equities down, bonds up: risk-off, validates defensive positioning.
- Equities down, bonds down: correlation breakdown, extra caution across all positions.
Equity-bond correlation can flip sign in stagflationary or policy-surprise environments. It confirms a signal; it does not create one.
That caveat is important. The research is explicit that short-term flows, central bank activity, or policy surprises can temporarily overwhelm the usual macro relationship, so a confirmed chart setup can still fail. If you are entering premium-selling trades on charts alone, you are skipping the cross-asset filter professionals use specifically to avoid stepping into positions when macro conditions are quietly working against them.
What the professional journey actually suggests for your options approach
Strip away the mechanics and the 40-year arc points to a single lesson. The move from buying direction to selling structure is not about complexity. It is about aligning your trade with how markets actually distribute their outcomes, and with the capital you actually have.
The same practitioner spent roughly 13 years as a retail content provider, and that experience shaped a clear view: margin requirements make pure premium-selling inappropriate for most retail traders. Defined-risk structures are not a consolation prize. They are the correct tool for undercapitalised participants.
A sensible tiered progression looks like this:
- Understand theta thoroughly before ever holding a long option, so you know exactly what time is costing you.
- Qualify for and use a margin account to access defined-risk spreads and simple butterflies before attempting broken-wing structures.
- Layer a cross-asset correlation check onto your chart-based entries before committing to a premium-selling position.
None of this is passive or beginner-friendly. Even a defined-risk structure needs meaningful capital, with the systematic broken-wing example calling for at least $700 per trade, and FINRA confirms that spread transactions generally require margin approval. The research is candid about the demands: complex execution, sensitivity to volatility spikes, strict predefined exits, and the psychological grind of banking small, repeatable profits punctuated by the occasional large drawdown.
Defined-risk structures reduce margin and cap losses. They do not reduce the need for discipline, monitoring, and predefined exits.
The point is not to copy what a professional does. It is to understand why professionals evolved away from what most retail traders default to, and then make a more deliberate choice about the strategies you build your own approach around.
For readers wanting to connect the defined-risk framework to a broader measure of strategy quality, our full explainer on trading expectancy shows how win rate, average win, and average loss combine into a single metric that reveals whether a premium-selling approach has a genuine mathematical edge across a meaningful sample of trades.
This article is for informational purposes only and should not be considered financial advice. Investors should conduct their own research and consult with financial professionals before making investment decisions.
Past performance does not guarantee future results. Options strategies carry substantial risk, and figures cited here are illustrative and subject to market conditions, volatility, and individual broker requirements.