Most investors spend their election-cycle energy on the presidency. Which party wins the White House dominates portfolio conversations, media coverage, and the reflexive trades that follow election night. Yet some strategists argue the configuration of Congress after a midterm election has historically mattered more for equity returns than the occupant of the Oval Office. That inversion is worth sitting with, because it reframes where November’s real portfolio risk sits.
The November 2026 midterms are approaching with one of the most asymmetric prediction market setups in recent memory. Kalshi prices a Democratic House takeover at roughly 86%, making it a near-consensus base case already embedded in asset prices. The Senate, by contrast, sits at approximately 53% Republican and 47% Democratic, a genuine coin flip with a slight Republican lean. That split means the Senate result, not the House, is where unpriced event risk remains for equity investors.
Here is what prediction market odds, historical return patterns, and scenario analysis actually tell you about positioning ahead of November, and where the limits of that analysis sit. This is a framework for weighting scenarios, not a forecast.
The historical pattern linking congressional control to post-midterm equity returns
The broadest finding in the academic finance literature is straightforward: equities tend to drift higher in the 12 months following a midterm election, regardless of which party wins. That pattern holds across decades and configurations. It is one of the more durable seasonal observations in market history.
The post-midterm rally record across 19 cycles since 1950 holds without exception through recessions and financial crises, driven by uncertainty resolution rather than partisan outcome, which is precisely why the historical pattern supports staying invested regardless of which Senate configuration materialises in November.
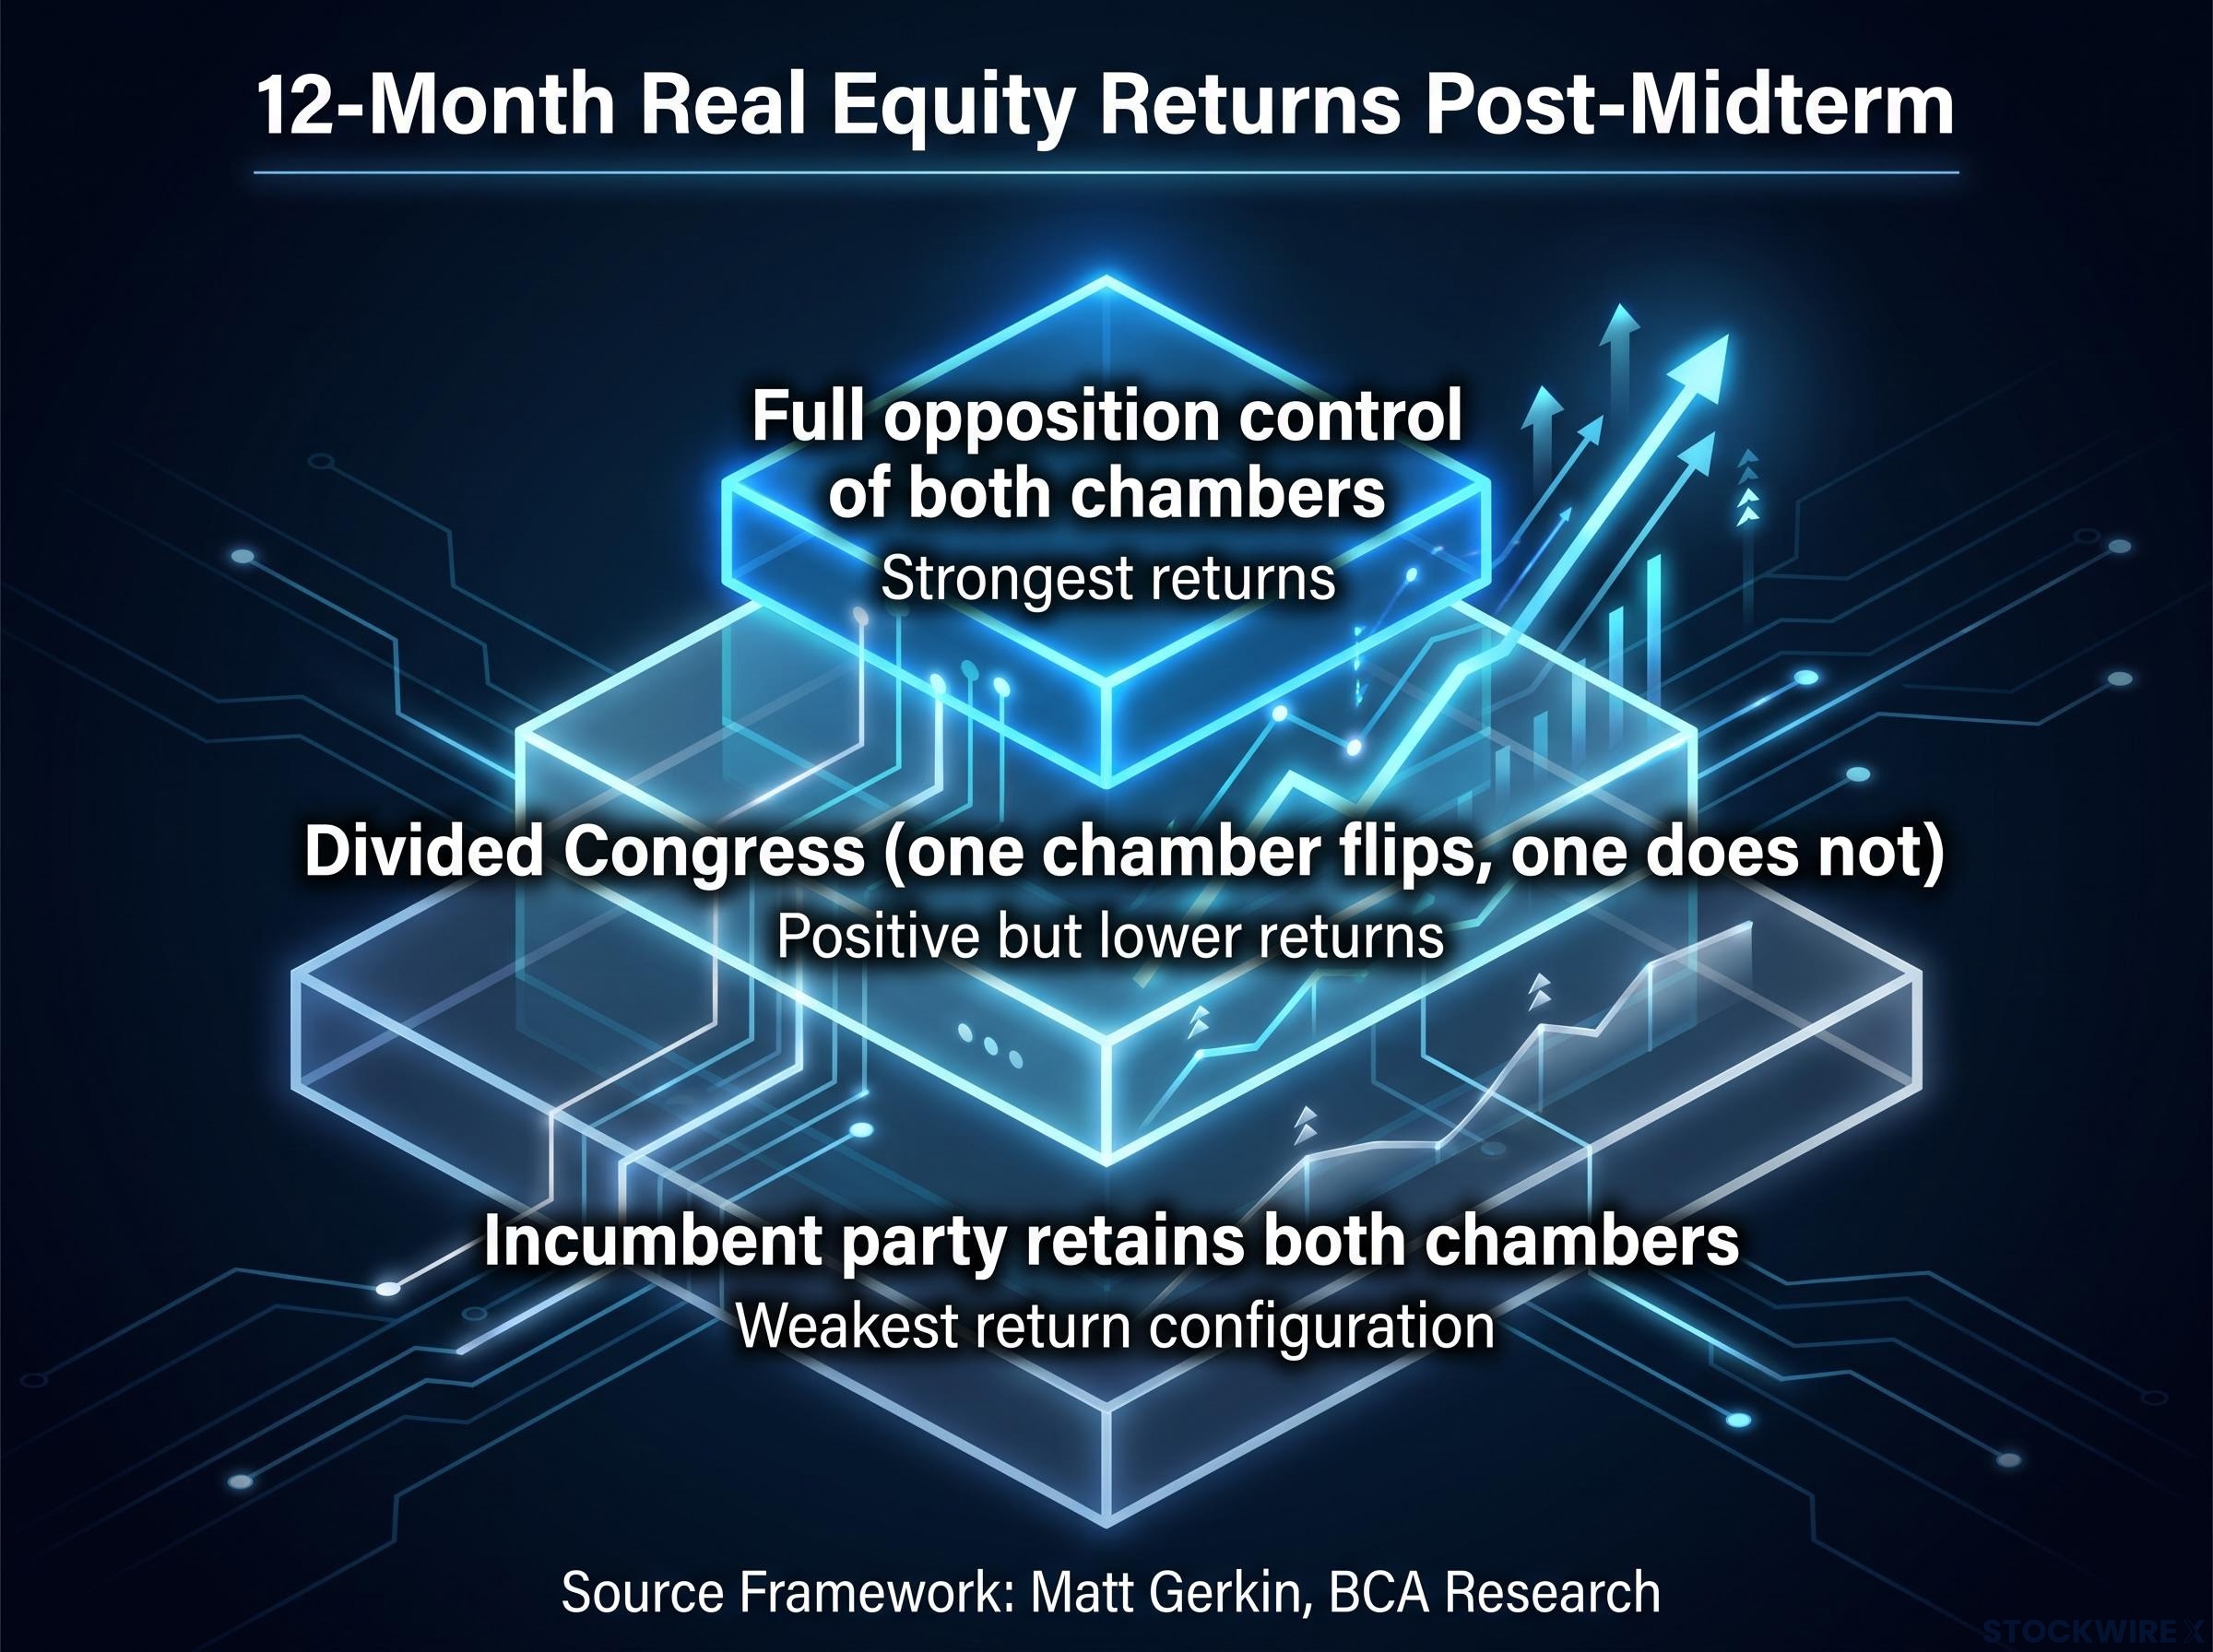
Within that general drift, Matt Gerkin, Chief Geopolitical Strategist at BCA Research, has offered a more granular decomposition. His framework ranks post-midterm real equity returns by the specific configuration of congressional control:
- Full opposition control of both chambers: Associated with the strongest 12-month real equity returns post-midterm
- Divided Congress (one chamber flips, one does not): Returns remain positive but historically lower than full-opposition-control outcomes
- Incumbent party retains both chambers: The weakest return configuration in Gerkin’s dataset
The mechanism behind the top-performing scenario is intellectually coherent. When the opposition controls both chambers, it inherits governing responsibility. Any legislation must still clear a presidential veto, which creates a natural moderating force on market-hostile proposals. The opposition is incentivised to demonstrate competence ahead of the next presidential cycle rather than obstruct, a dynamic Gerkin characterises as “govern to impress.”
The Gerkin/BCA Research finding: Full opposition control of both congressional chambers has been associated with the strongest 12-month post-midterm real equity returns, ahead of divided Congress and incumbent-retention scenarios.
What the data shows and where it runs out
The pattern is a useful lens. It is not a trading signal. Gerkin’s decomposition rests on a very small sample of modern midterms, and the observed differences in returns across configurations carry wide confidence bands. The broader academic literature supports the general post-midterm positive drift but does not robustly confirm that specific congressional configurations explain return differentials once macroeconomic conditions are controlled for.
Treat this as a scenario-weighting input: it tells you which configuration has historically been friendliest to equities, but it cannot tell you with statistical confidence that the configuration itself caused the returns.
A University of Canterbury working paper on midterm election returns, drawing on monthly US data from 1926-2022, found that higher equity returns around midterm elections all but disappear once returns are adjusted for risk, suggesting the drift primarily compensates investors for bearing market risk rather than reflecting a genuine configuration-driven premium.
When big ASX news breaks, our subscribers know first
What prediction markets are actually pricing right now
The House result is, for practical purposes, already decided in market pricing. Kalshi places Democratic House control at approximately 86%, a figure underpinned by several converging indicators: a roughly 5 percentage point Democratic lead in generic congressional polling, a presidential net approval of around negative 16%, only about 33% of voters believing the country is heading in the right direction, and congressional approval registering somewhere between 20% and 25%. Seat-shift projections point to Democrats picking up somewhere in the range of 20 to 40 House seats, comfortably clearing the threshold needed to unseat the Republicans’ razor-thin majority.
The Senate is a different story entirely. On Kalshi, the probability of Republican Senate control sits at roughly 53%, with Democratic control at approximately 47%. A punter placing $50 on a Republican Senate outcome stands to collect around $91 if that call proves correct, a payout structure that reflects just how close the market considers this race to be.
A $50 Kalshi wager on Republican Senate control pays roughly $91. That payout ratio tells you the market sees this as close to a coin flip, not a foregone conclusion.
The combination of these two readings produces four balance-of-power scenarios, each with approximate market-implied probabilities:
| Scenario | Approximate probability | Characterisation |
|---|---|---|
| Democratic House / Democratic Senate | ~40-47% | Democratic sweep |
| Democratic House / Republican Senate | ~39-40% | Split Congress (gridlock) |
| Republican House / Republican Senate | ~17% | Republican hold (underdog) |
| Republican House / Democratic Senate | ~1.7% | Near-impossible |
Note: balance-of-power scenario probabilities are derived from aggregated prediction market data and should be treated as directional estimates, not precise official figures. They are subject to daily movement.
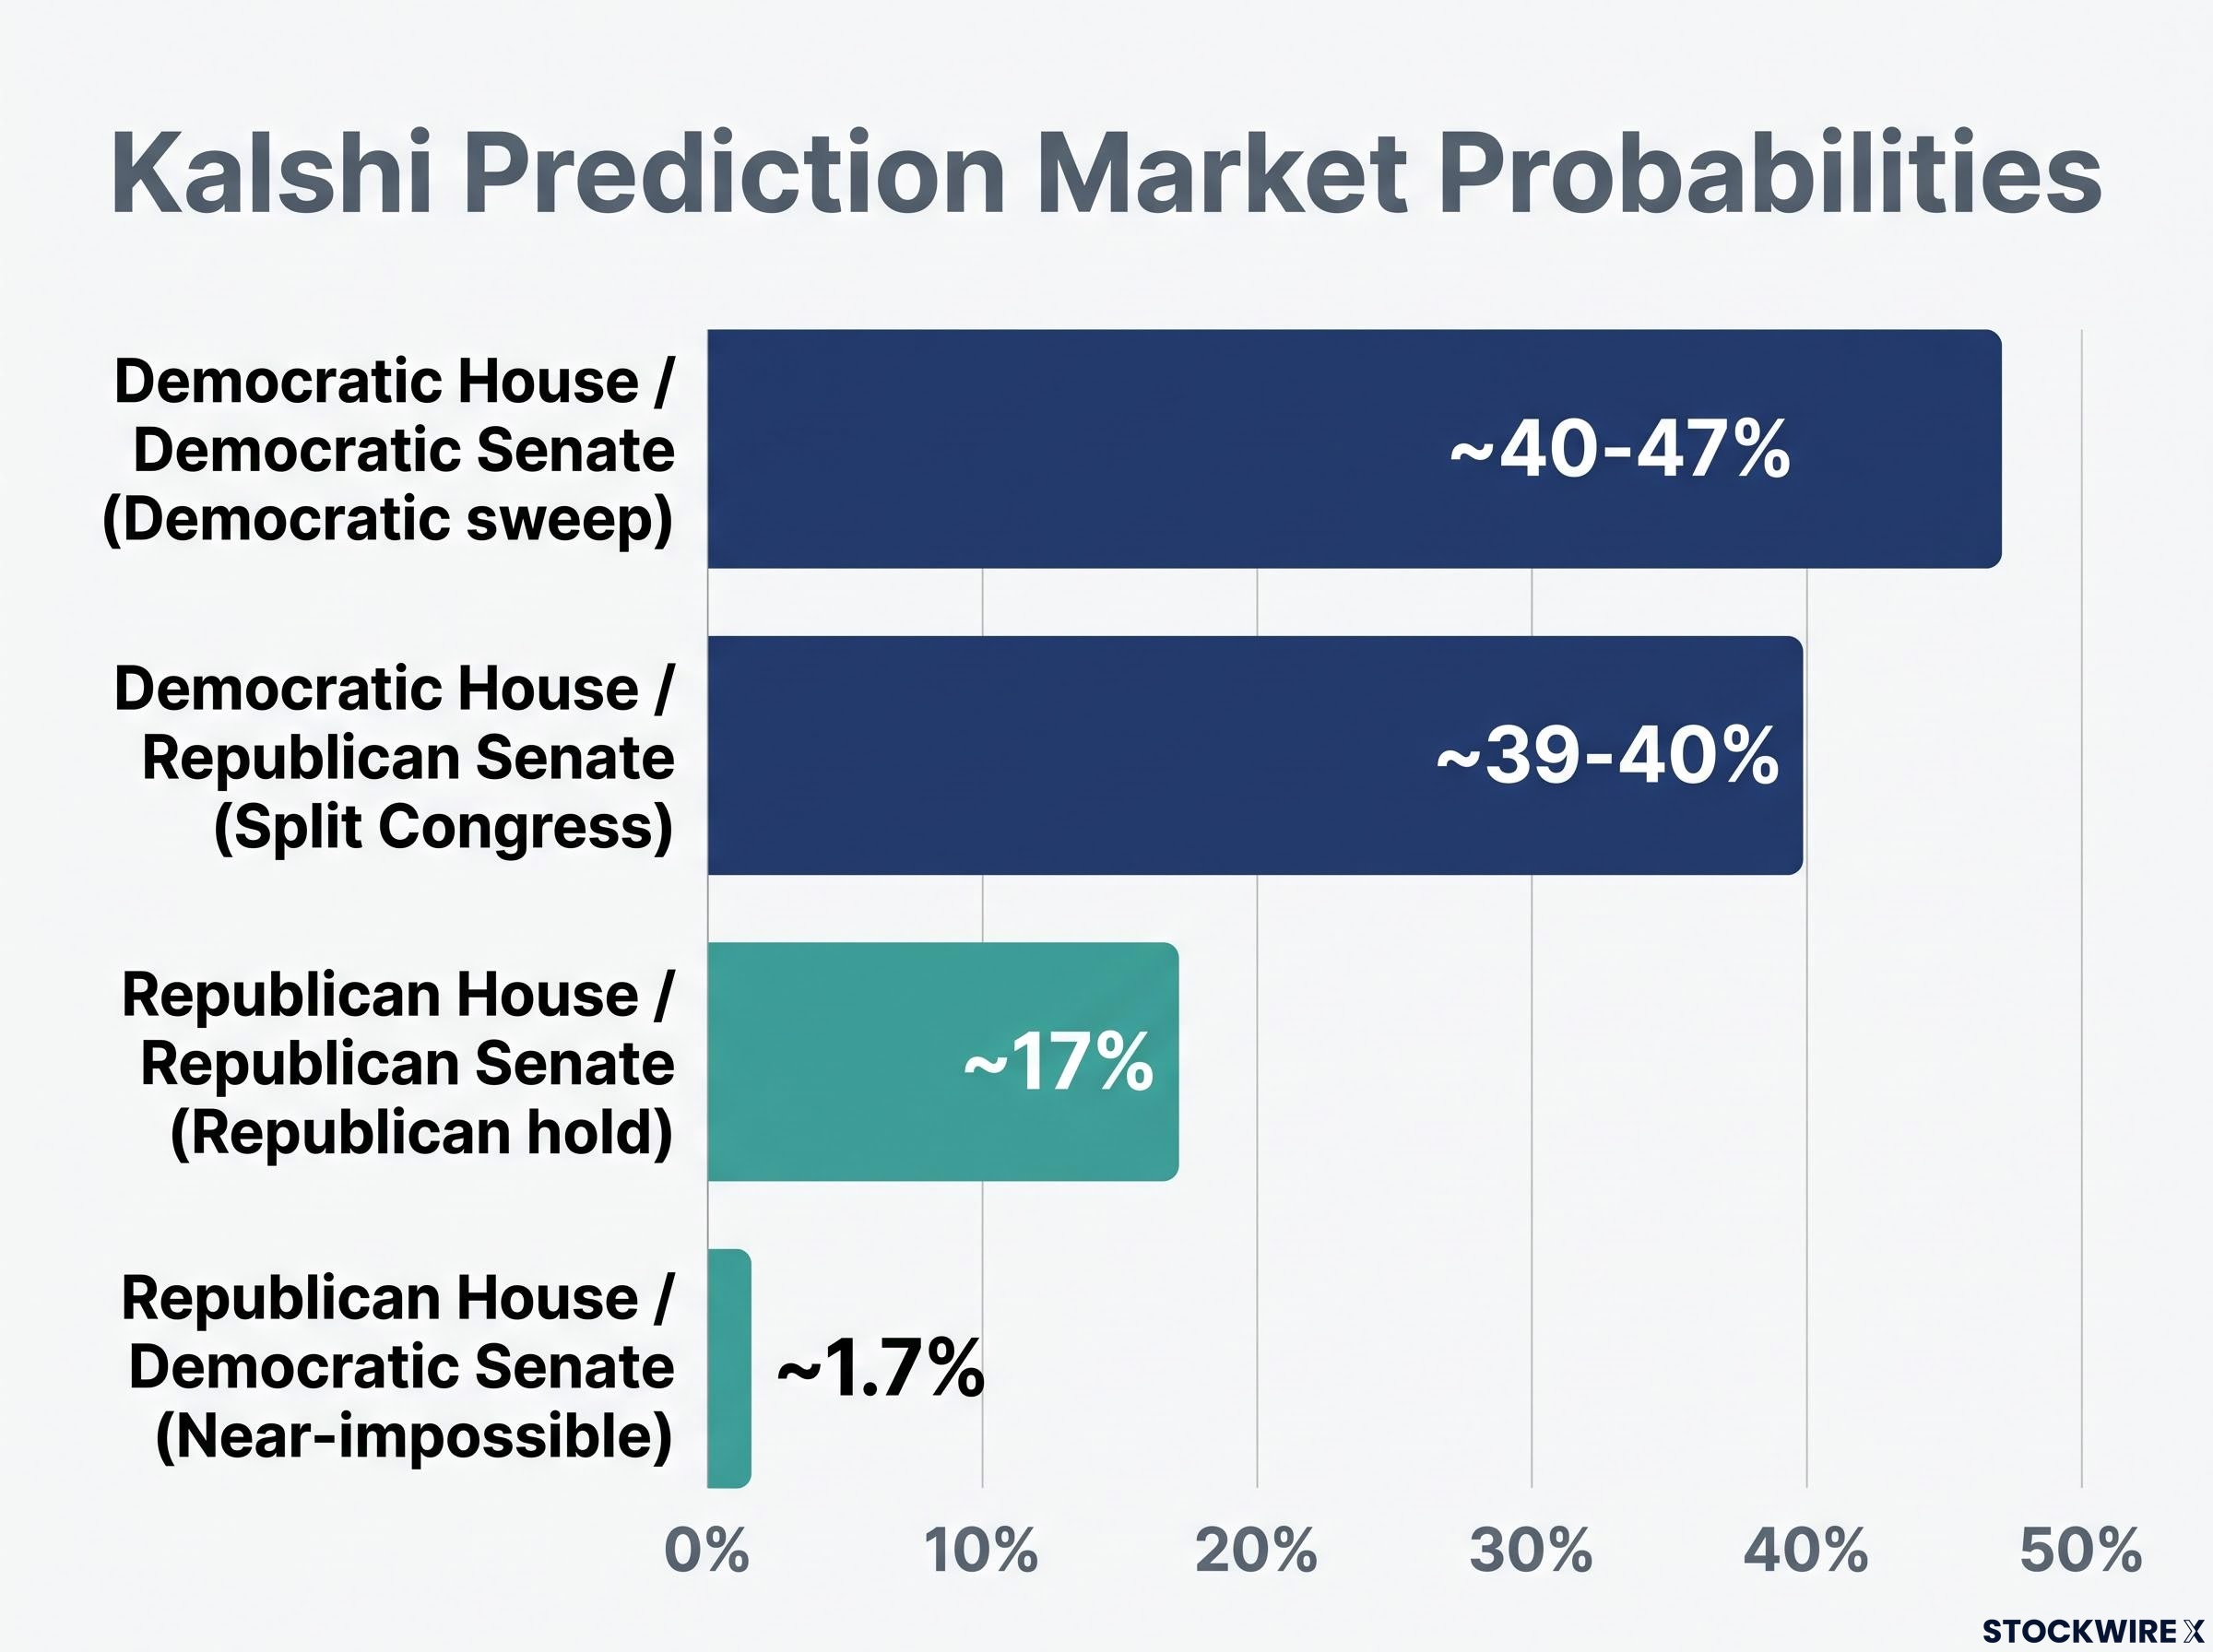
Because the House flip is priced in the mid-80s, investors who treat a Democratic House as a surprise catalyst are misreading the market structure. The Senate result is where the meaningful new information arrives on election night.
How each congressional scenario translates into market risk and opportunity
Probability weights are useful only if you know what each outcome actually does to the policy environment. Here is what the two dominant scenarios, and the primary underdog, look like from a portfolio perspective:
- Democratic sweep (approximately 40-47% probability). Full Democratic control of both chambers maps to the historically strongest post-midterm return configuration in the Gerkin/BCA framework. The mechanism is the “govern to impress” dynamic: Democrats with full congressional responsibility ahead of 2028 face incentives to pass constructive legislation rather than pursue partisan extremism, particularly since any bill still requires a presidential signature. The moderating force is structural, not ideological. The primary risk is that the “govern to impress” assumption does not hold and Democrats pursue legislative agendas the market views as hostile to capital formation.
Executive policy risk sits orthogonally to the congressional configuration the article maps: presidential tariff authority under Section 232 and Section 301 does not require congressional approval, meaning energy, manufacturing, and technology sector exposures face a policy variable that the Senate result alone cannot constrain.
- Split Congress (approximately 39-40% probability). A Democratic House paired with a Republican Senate is the gridlock configuration. Under this arrangement, the risk of government shutdowns rises, debt ceiling negotiations become a recurring source of instability, and federal spending is likely to drift along under continuing resolutions rather than active appropriation. The historical return data still shows positive post-midterm drift under divided government, but the path is bumpier. Policy uncertainty around brinkmanship episodes generates near-term volatility even if it does not determine 12-month aggregate returns. For investors managing short-term drawdown risk, this scenario deserves as much attention as the Democratic sweep, because its probability is nearly identical and its volatility profile is higher.
The Republican hold as tail risk, not forecast
- Republican hold (approximately 17% probability). Continued Republican control of both chambers sits clearly below the two dominant scenarios. This outcome would represent the largest prediction market miss of the current cycle and would likely force significant reassessment of equity sector positioning, particularly in energy, financial regulation, and fiscal policy. The research framework focuses primarily on the two dominant scenarios, but a 17% probability is not negligible. It is tail risk worth acknowledging, not ignoring.
How to use prediction market odds without mistaking them for certainty
Prediction market prices reflect the distribution of capital and judgement across market participants. They are not omniscient forecasts. They have been materially wrong in past election cycles, and the Senate odds have moved between slight Democratic and slight Republican leads over the course of 2026, illustrating the genuine uncertainty embedded in approximately 50/50 pricing.
Prediction market limitations are structural as much as informational: profit concentration among algorithmic and institutional accounts means retail participants who treat Kalshi pricing as a tradeable edge are operating in a demonstrably disadvantaged environment, separate from the forecasting accuracy question entirely.
The probability of a Republican Senate victory on prediction markets started declining from around mid-January and converged toward near-parity, with shifting macroeconomic and geopolitical conditions driving the movement throughout the intervening months. The precise drivers are debatable; the direction is not. Key battleground states, including Maine, Michigan, Ohio, and potentially Iowa and Texas, remain individually competitive enough that a single race outcome could tip the chamber. Republican base enthusiasm is characterised as at risk, while Democratic voter motivation is considered stronger, though these are soft factors that prediction markets partially embed but cannot fully price.
The scenario-weighting principle: With both dominant outcomes sitting near 40% probability, positioning as if either Senate result is certain introduces uncompensated scenario risk. The right posture is explicit scenario weighting, not a single directional bet.
For investors applying this framework, the practical principles are:
- Treat a Democratic House as the base case; it is already priced in the mid-80s
- Weight the two Senate scenarios near-equally rather than loading directionally on either
- Price gridlock risk (shutdowns, debt ceiling brinkmanship), not just ideological direction
- Use the historical pattern as scenario context, not a return forecast
- Build portfolio positioning around weighted scenarios, not a single predicted outcome
Reading the Senate result on election night as an investor
When results arrive on 3 November, the House outcome will almost certainly confirm what markets already expect. That is not the signal worth watching. The Senate result is where the meaningful new information sits, resolving approximately 40% of the analytical uncertainty about the post-midterm policy environment.
Here is the framework for processing what you see:
- Discount the House result if it confirms the expected Democratic flip. That outcome is already in the price. A Republican House hold would be the surprise, and at 14% probability, it would warrant significant reassessment.
- Read the Senate result as the primary signal. A Democratic Senate tips the balance toward the historically strongest return configuration per the Gerkin/BCA framework, with the small-sample caveat intact. A Republican Senate hold produces the split Congress, gridlock scenario with its associated brinkmanship risks.
- Map the outcome to the scenario framework and adjust positioning accordingly rather than reacting to partisan framing in media coverage. The question is not “which party won” but “which policy configuration just became operative, and what does it mean for sector exposure, volatility expectations, and the 12-month return environment.”
The general academic finding bears repeating: post-midterm equity drift is positive across configurations. That argues against panic-driven repositioning regardless of which Senate outcome materialises. The Senate result tells you which scenario to weight most heavily, not whether to be in or out of equities. Understanding that distinction is the difference between a strategic adjustment and a reactive mistake.
What November actually settles, and what it leaves open
Two scenarios, each near 40% probability. One Senate result that resolves the dominant uncertainty. A historical pattern that favours equities regardless of configuration but that cannot, on its small sample, promise you which configuration delivers the strongest returns.
The variables that will continue to matter after the ballots are counted have nothing to do with congressional composition alone: macroeconomic conditions, the Federal Reserve’s rate trajectory, and whether the winning configuration governs as the scenario analysis predicts or defies the historical pattern entirely. Congress is one input, not the input.
The Federal Reserve rate trajectory after November will matter as much as congressional composition for the 12-month return environment, particularly given that Kevin Warsh’s earliest policy signals under documented presidential pressure will be repriced by bond and equity markets faster than any legislative agenda clears committee.
The value of combining prediction market pricing with historical analysis is not in predicting the outcome. It is in building a probability-weighted framework before the result arrives, so that when the Senate race is called, you already know which scenario you are operating in and what adjustments, if any, your portfolio requires. That preparation is what separates informed positioning from political speculation dressed as investing.
This article is for informational purposes only and should not be considered financial advice. Investors should conduct their own research and consult with financial professionals before making investment decisions. Past performance does not guarantee future results, and the historical return patterns discussed rest on limited datasets that carry wide confidence bands.
—