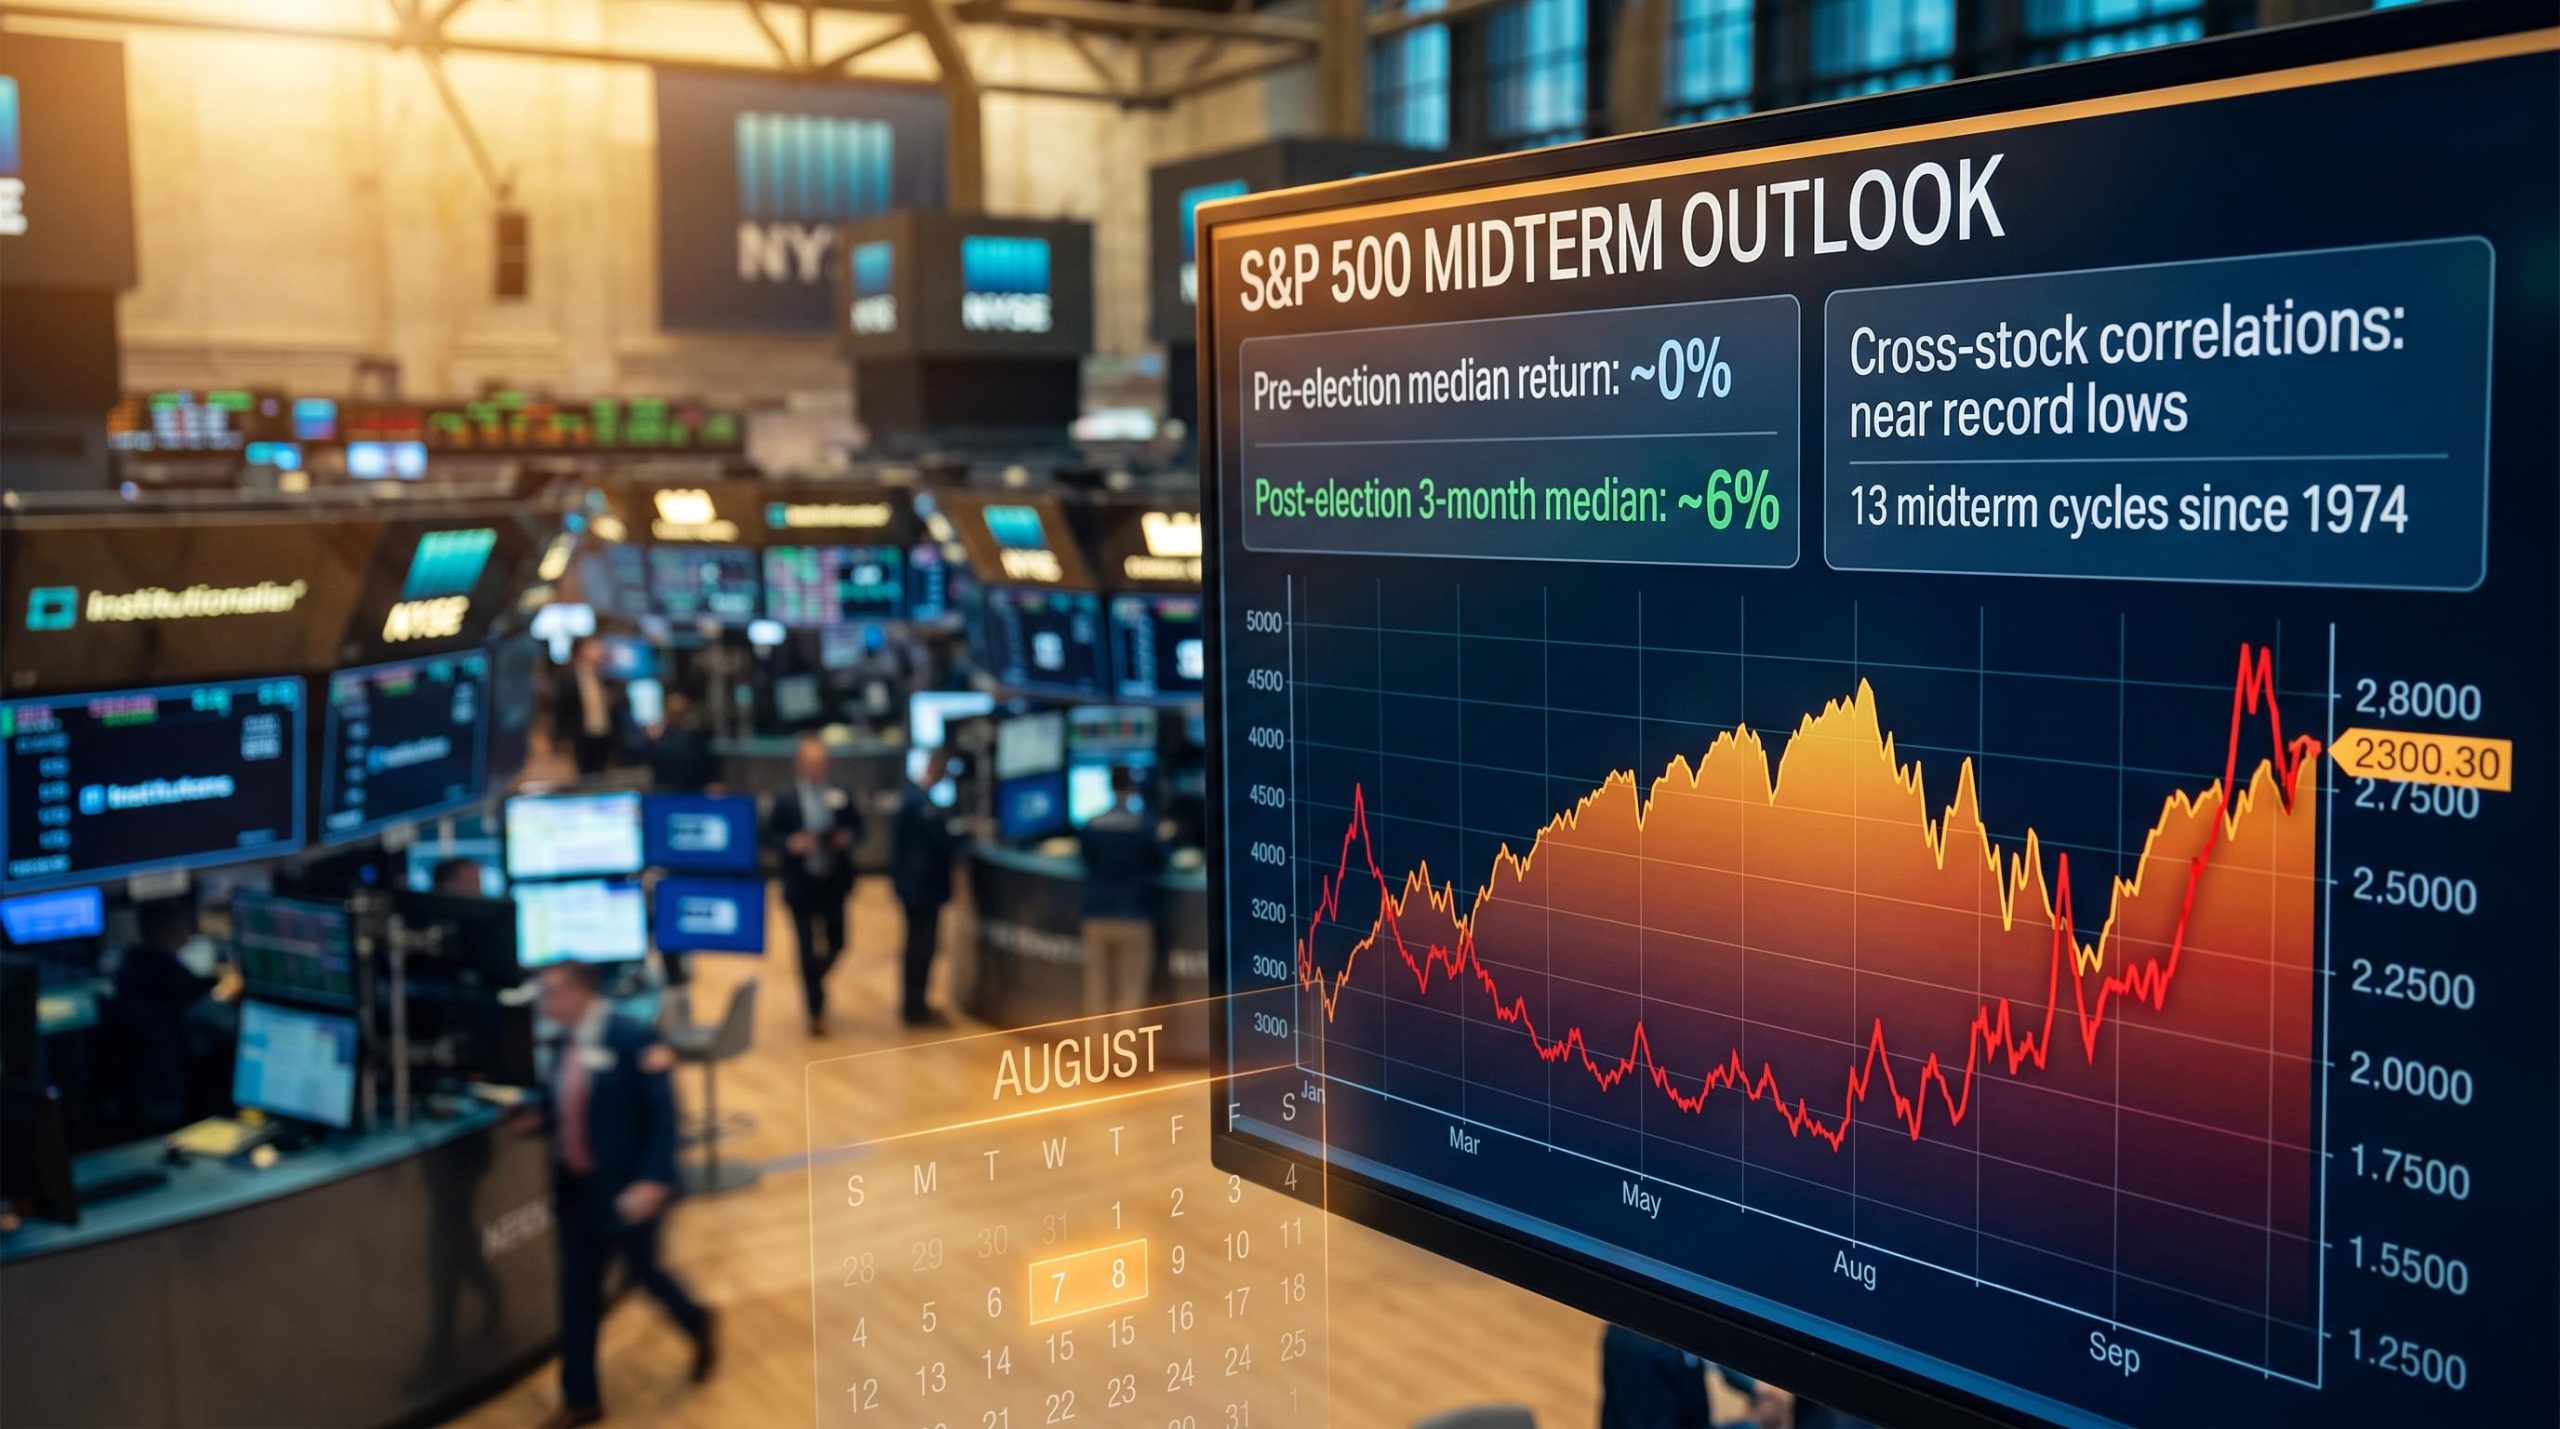
Goldman Sachs strategist Ben Snider issued a warning on 27 July 2026 that the S&P 500’s current calm is structurally fragile, with index-level volatility likely to rise as the November midterm elections approach. The call is specific: cross-stock correlations are near record lows, masking elevated single-stock risk, and the forces holding them down are about to lose their anchor.
The timing matters because earnings season is the last structural buffer suppressing those correlations. Once company-specific news flow fades in August, macro narratives around elections, interest rates, and geopolitics historically take over, and the index starts behaving differently. This is not a general market warning. It is a calendar-driven regime call.
Here is what Goldman’s data across 13 midterm cycles, and the specific indicators the firm is watching, tell you about navigating the next three months of S&P 500 price action.
Why Goldman Sachs thinks the calm will not last
The S&P 500 looks stable. The VIX is subdued. Index-level moves have been modest for weeks. But Goldman’s note argues that this surface calm is an artefact of aggregation, not a genuine reduction in risk.
The mechanism is cross-stock correlations, which measure how closely individual stocks move together. Right now, those correlations sit near record lows. That means individual stocks are swinging sharply in both directions, but the gains and losses are cancelling each other out at the index level. The headline number looks calm. The underlying components do not.
Goldman attributes the low-correlation environment to two specific forces:
- AI-driven idiosyncratic dispersion: Investor attention is concentrated in stock-specific narratives around artificial intelligence winners and losers, producing large individual moves that offset each other rather than pushing the index in one direction.
- Widespread options overwriting (covered call strategies): Institutional investors selling call options against their holdings mechanically dampens some index-level volatility.
Both forces are real, but Goldman’s warning is that they can be overwhelmed. When a macro catalyst dominates, whether it is an election outcome, a Federal Reserve decision, or a geopolitical shock, investors start reacting to the same news simultaneously. Correlations spike. Index volatility follows.
The gap between implied versus realised volatility has been one of the defining features of 2026, with implied volatility running above 23% while realised daily moves tracked below 14%, a divergence that independently corroborates Goldman’s observation that the market feels calmer than its underlying components suggest.
Goldman frames this as an index volatility regime shift risk, not an imminent crash call. The danger is not a sudden collapse; it is the rapid transition from a low-correlation, low-VIX environment to one where macro-driven correlated moves reassert themselves.
What that means for you: a low VIX reading right now is not a reliable proxy for your actual portfolio risk. If your holdings are concentrated in sectors with high single-stock volatility, the index-level calm tells you almost nothing about your real exposure.
When big ASX news breaks, our subscribers know first
What 13 midterm election cycles reveal about S&P 500 returns
Goldman’s historical analysis covers 13 midterm election cycles since 1974, and the pattern is remarkably consistent across very different economic and political environments. The story unfolds in two distinct phases.
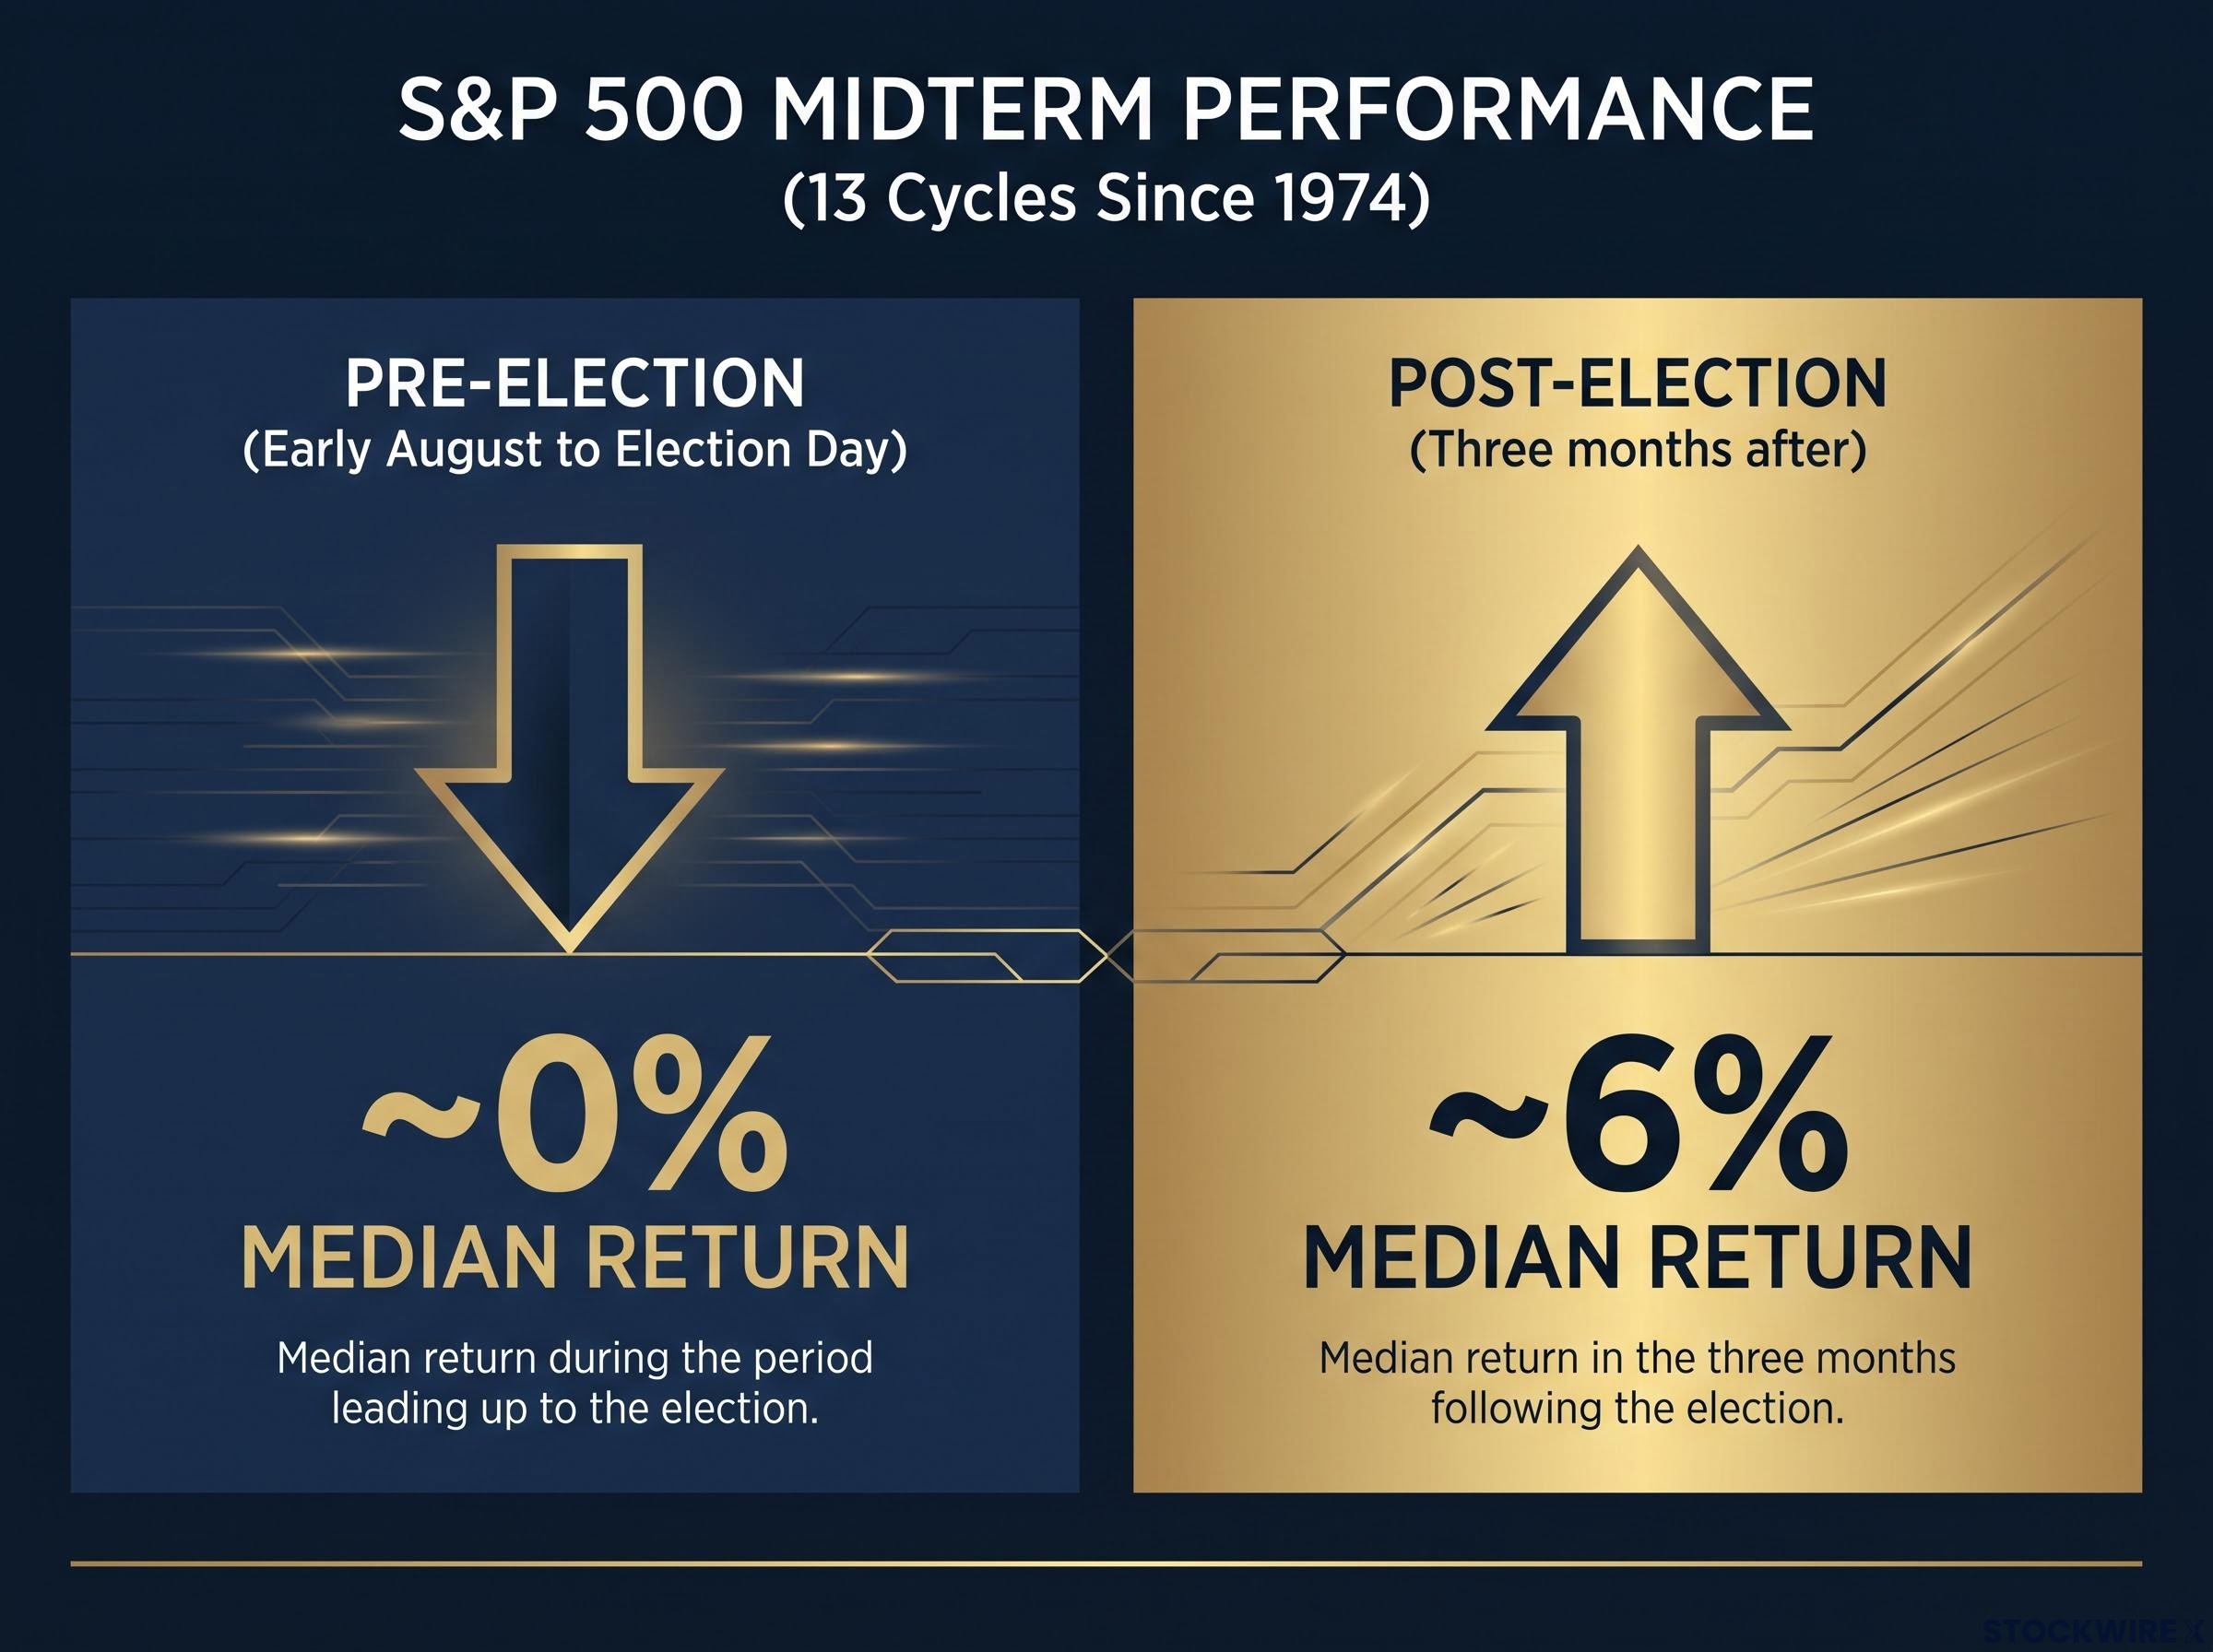
From early August through Election Day, the median S&P 500 return across those 13 cycles is approximately 0%. That does not mean markets fell. It means they chopped sideways, directionless, as investors waited for political clarity rather than committing capital in either direction.
The structural reason is straightforward. Institutional and overseas investors have typically trimmed their allocations to U.S. equities in the run-up to midterm votes. Risk appetite contracts. The index marks time.
| Phase | Time period | Median S&P 500 return | Key driver |
|---|---|---|---|
| Pre-election | Early August through Election Day | ~0% | Policy uncertainty, institutional outflows |
| Post-election | Three months after Election Day | ~6% | Uncertainty decline, institutional re-entry |
The post-election rebound case
Once the result is known, the dynamic reverses. The median S&P 500 gain in the three months following midterm Election Day is approximately 6%. The central mechanism is the decline in policy uncertainty: regardless of which party wins, the market now has a known political configuration to price against.
The flow pattern reinforces the rebound. Those same institutional and foreign investors who trimmed exposure ahead of the vote have historically rebuilt their U.S. equity allocations once the result is clear, generating a structural tailwind for demand. This pattern has appeared across Republican and Democratic outcomes, recessions and expansions, strengthening the case that it is structural rather than coincidental.
The midterm election stock market cycle has historically concentrated weakness in H1 before a sharp Q4 recovery averaging approximately 8%, a sequencing that maps closely onto Goldman’s pre-election chop and post-election rebound thesis.
The 0% median pre-election return does not argue for selling. It tells you the market tends to mark time while waiting for clarity, and the 6% post-election median suggests that patience through that choppy period has historically been rewarded.
Economic policy uncertainty and the August inflection point
Goldman’s warning is not a vague “election risk” flag. It comes with a specific timing mechanism and a named trigger point on the calendar.
According to Goldman’s analysis, economic policy uncertainty (EPU), a measure of how uncertain businesses and investors feel about the direction of government policy, has tended to climb during the August of midterm election years and stay elevated across the months that follow.
Ben Snider, Goldman Sachs strategist, published this research on 27 July 2026, identifying the conclusion of earnings season as the likely inflection point for the volatility regime shift.
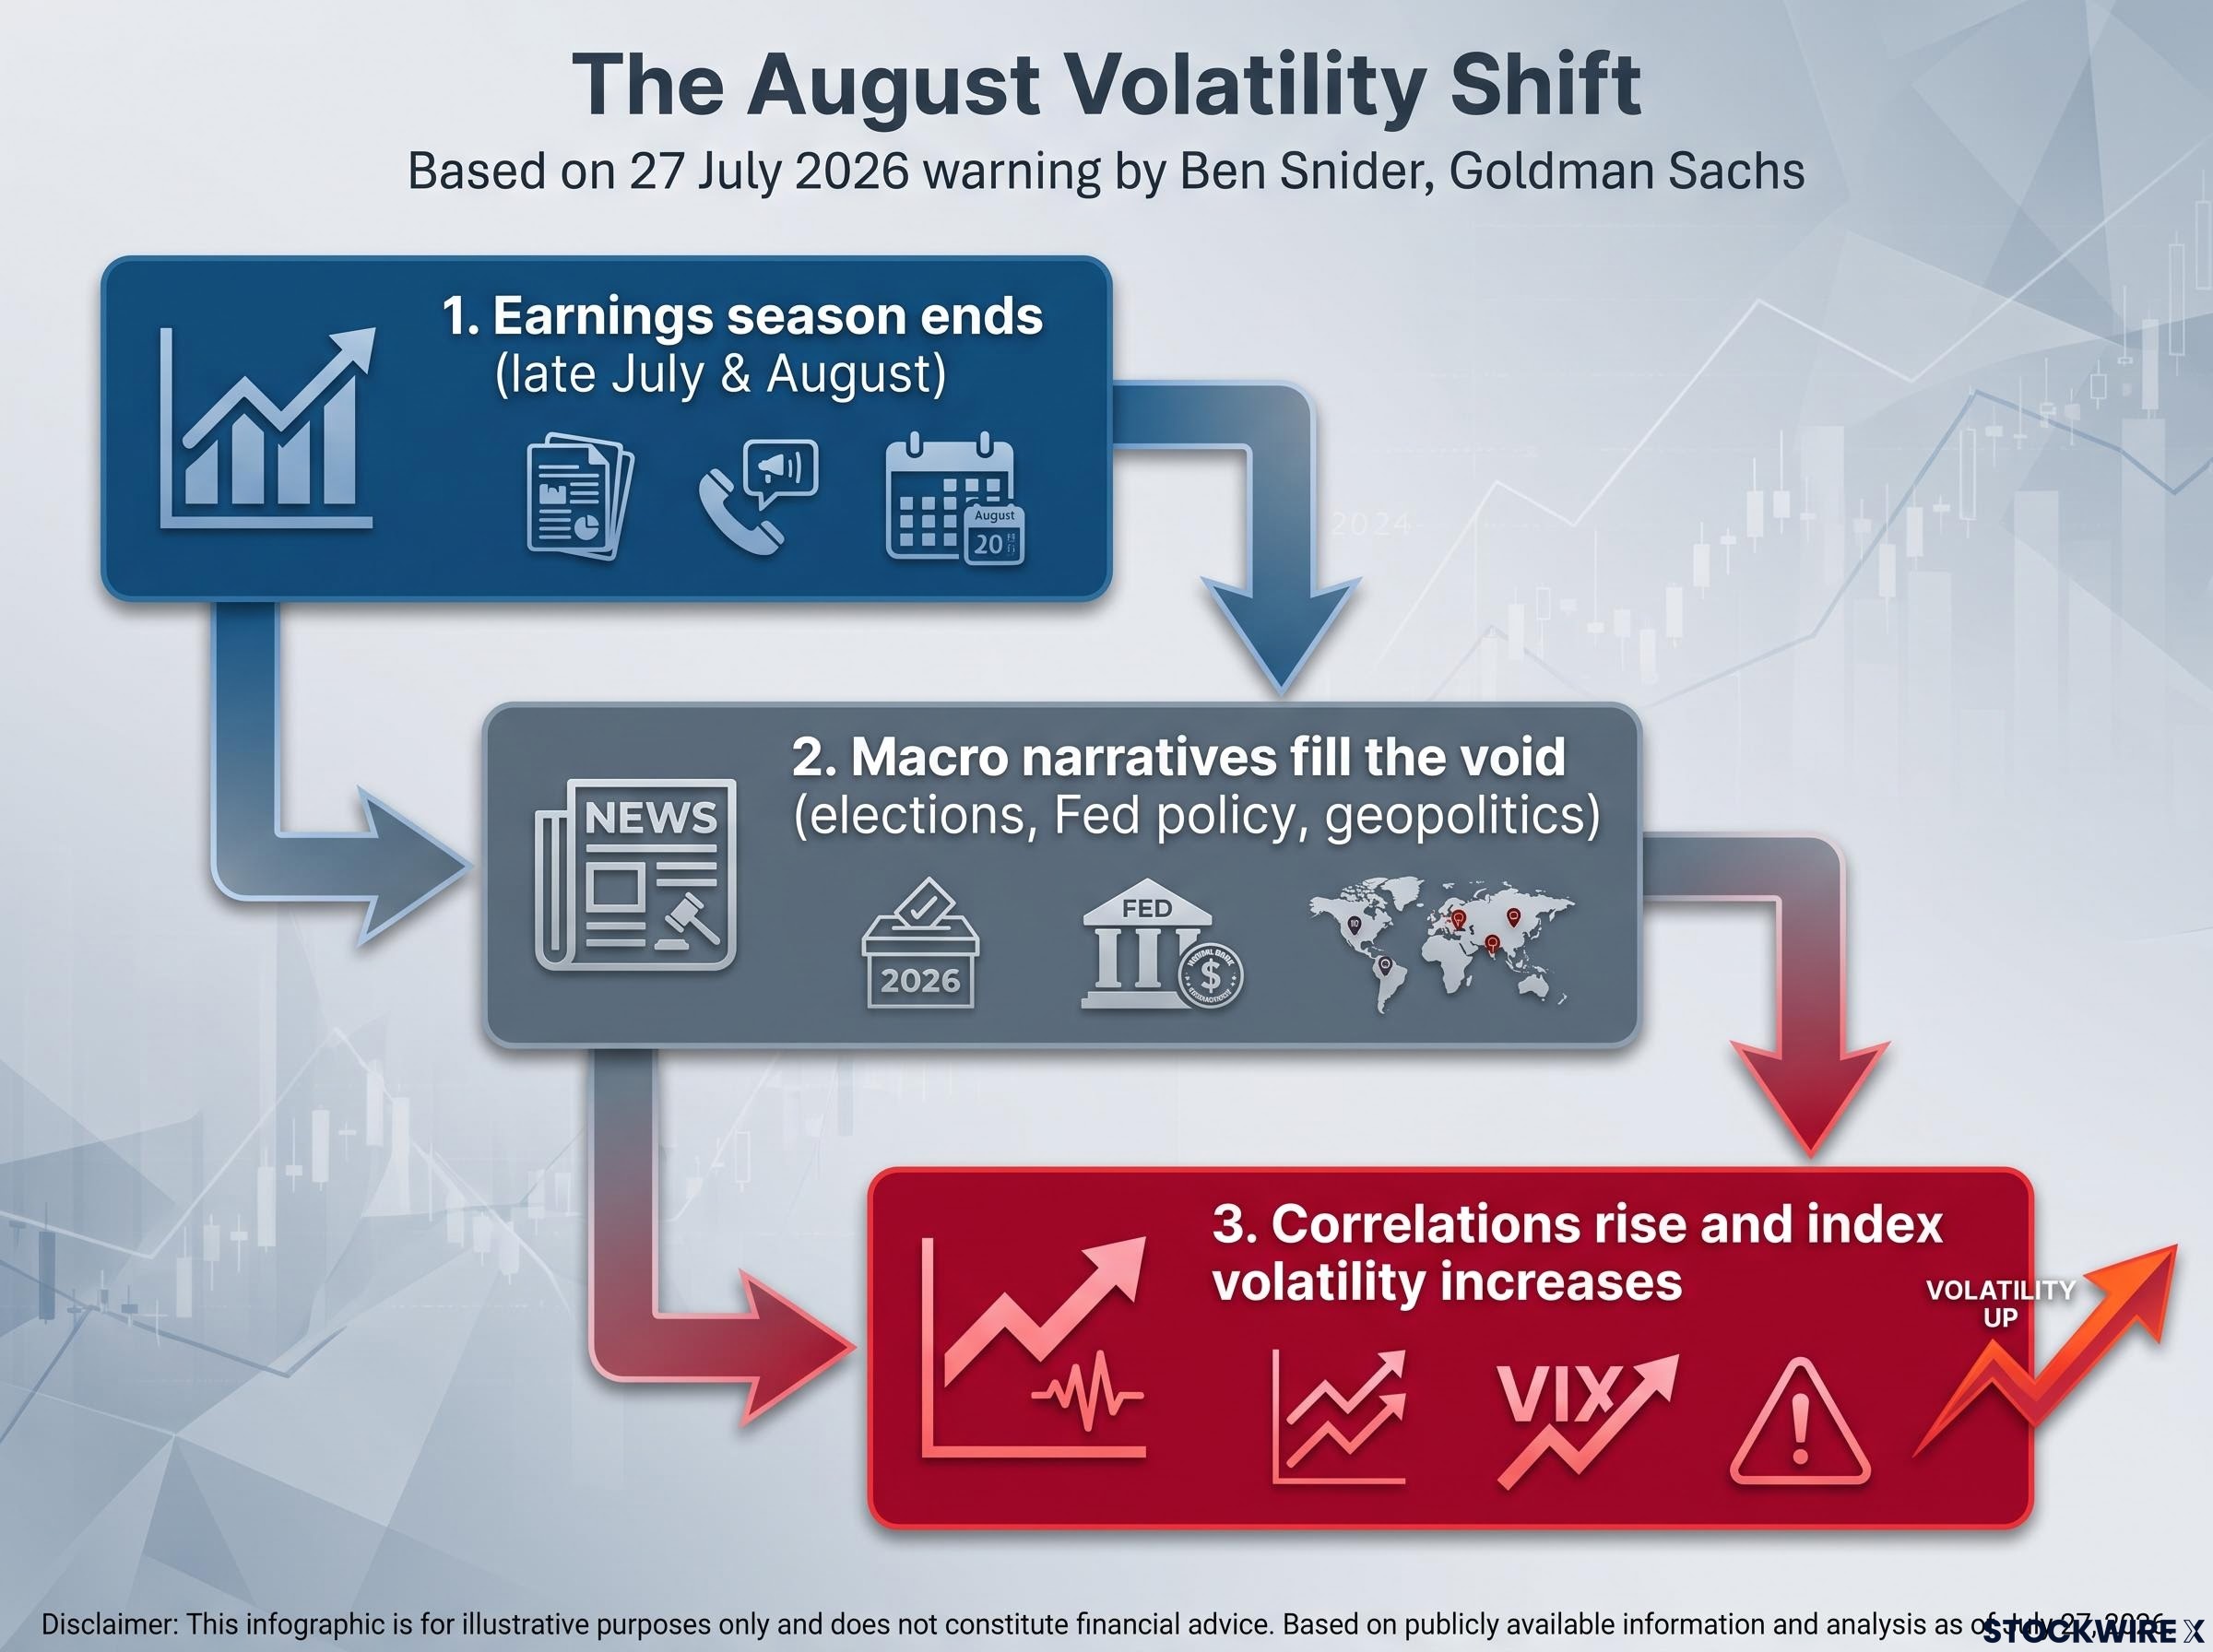
The mechanism unfolds in three stages:
- Earnings season ends in late July and August, removing the dominant source of company-specific news flow.
- Macro narratives fill the void, with elections, Fed policy, and geopolitics becoming the primary drivers of investor attention.
- Correlations rise and index volatility increases as investors begin reacting to the same macro headlines simultaneously, rather than to individual company results.
August is not just the start of summer trading slowdowns. Goldman’s data identifies it as the specific window when market conditions structurally shift in midterm years. That gives you a narrow, named timeframe to reassess whether your positioning is calibrated for a higher-correlation, higher-volatility environment.
The shift in the Fed communication regime under Kevin Warsh, who scrapped forward guidance at his first FOMC press conference in June 2026, amplifies the macro uncertainty Goldman identifies as a key correlation driver, because each data release and FOMC meeting now carries pricing weight that was previously cushioned by explicit rate guidance.
Which market signals to watch as the election approaches
The historical pattern is useful. But what matters now is whether Goldman’s thesis is playing out in real time. Four indicators will tell you.
- End of earnings season: Watch whether correlations and index volatility begin to pick up once company-specific results stop dominating the news flow. This is the first signal that the regime shift Goldman describes is underway.
- Cross-stock correlations: A sustained rise from current record-low levels is the single most direct confirmation. If correlations stay low, the structural calm persists. If they climb, the index is becoming more sensitive to macro-driven moves.
- Institutional and foreign investor flows: Net selling by mutual funds and foreign investors into the autumn would be consistent with the pre-election historical pattern. It would also simultaneously set up the post-election rebound thesis, as those same flows typically reverse after Election Day.
- EPU indices and options market signals: Economic policy uncertainty gauges and options market indicators, particularly skew (the relative pricing of downside versus upside protection) and implied volatility on index options, can confirm whether policy uncertainty is following the typical midterm escalation pattern. Goldman has separately warned that downside protection may be unusually cheap in the current low-fear regime, meaning it could reprice sharply.
These are not abstract market indicators. They are the specific gauges that tell you whether Goldman’s thesis is materialising, giving you an evidence-based foundation for adjusting exposure rather than reacting to headlines.
How Goldman’s midterm call fits the firm’s wider market stance
This note does not exist in isolation. Goldman’s midterm volatility warning is consistent with several threads running through the firm’s recent research output.
The firm has repeatedly highlighted what it calls a “volatility gap,” the disconnect between the low level of implied volatility markets are pricing and the elevated level of macro risk the firm sees in the background. Fragile liquidity, stretched valuations, and AI-driven enthusiasm that raises vulnerability to shocks have all featured in Goldman’s wider messaging.
The midterm note is the timing-specific expression of that broader thesis. It names when volatility is most likely to surface (late summer through Election Day) and provides the historical evidence for what typically follows.
The central investor takeaway: Goldman’s data does not argue for exiting U.S. equities before the election. It argues for understanding that the pre-election period is historically choppy and the post-election period is historically strong. Together, those two facts frame staying invested as the historically supported posture.
Investors who stayed invested through midterm turbulence in prior cycles captured the post-election median gain of approximately 6%. Goldman is not calling for a crash. It is calling for a regime in which casual complacency about headline calm becomes more costly, and that distinction matters for how you position your portfolio in the weeks ahead.
What investors should actually do with Goldman’s warning
Goldman’s data supports a specific posture for the next three months, and it is not “sell everything.”
- Stay invested. The historical cost of exiting entirely before midterm Election Day is forgoing a median 6% gain in the three months after. The pre-election chop is real, but so is the rebound.
- Consider index hedges while they are relatively inexpensive. With implied volatility still low, index-level protection through options may currently be cheaper than it will be once correlations start rising and the market begins pricing the volatility Goldman expects.
- Sharpen sector views. As policy debates intensify ahead of the vote, sectors directly tied to election outcomes, including healthcare, defence, energy, and AI-related technology, historically see intensified dispersion. That environment rewards active stock and sector selection over passive index exposure.
The historically supported move is to stay invested but hedge selectively and focus your sector positioning, because the data shows the reward for patience is real, but the path through is designed to test it.
For investors wanting to translate Goldman’s volatility warning into specific portfolio adjustments, our dedicated guide to portfolio risk management covers beta-weighted position sizing and volatility targeting, with a six-step rebalancing workflow for calibrating actual market exposure against intended risk levels.
This article is for informational purposes only and should not be considered financial advice. Investors should conduct their own research and consult with financial professionals before making investment decisions. Past performance does not guarantee future results. Financial projections are subject to market conditions and various risk factors.