Most traders would call a stock sitting near its IPO price with no squeeze risk “quiet.” The options market says otherwise. SpaceX (SPCX) implied volatility, the market’s forecast of future price swings, has slid from above 100% to roughly 45-50%, and that decline may be shaping daily moves more than headlines do.
SPCX listed on Nasdaq at $135 in a record $75 billion IPO, and traders sold volatility heavily afterwards. The stock later closed below its IPO price on 16 July 2026, at $131.11, so every level below needs reading against a changing backdrop.
Understanding how dealer hedging works helps you judge whether a rally is likely to be sharp or gradual. Here is the working knowledge of gamma, call walls and IV rank, plus how traders structure long-dated bets when volatility is cheap. This analysis of SpaceX options positioning draws mainly on SpotGamma’s Brent Kachuba.
Why did post-IPO volatility selling leave SpaceX stock pinned in positive gamma?
Heavy options activity usually suggests fireworks. In SPCX it produced the opposite. According to Kachuba, traders came in mainly to bet that implied volatility would contract, selling both calls and puts rather than expressing a view on direction.
Dealers (the market makers who take the other side) became net long gamma, meaning their hedges move against the stock’s direction. They sell shares into strength and buy into weakness, which absorbs pressure in both directions.
Dips tied to lockup share supply, when insiders become free to sell, were met with put selling. That compressed volatility further.
The signal many readers miss: SPCX implied volatility fell from above 100% shortly after listing to roughly 50%, according to SpotGamma’s Kachuba.
The table below tracks the decline across sources.
| Date | Source | IV reading | Context |
|---|---|---|---|
| Post-IPO (undated) | SpotGamma | Above 100% | Starting level |
| Later (undated) | SpotGamma | About 50% | IV rank near 10; Tesla in the 40s |
| 27 August 2026 | CNBC/ThinkOrSwim | 57 | Down from over 120 before earnings |
| 3 October 2026 | Barchart | 44.16% | At-the-money, 30+ days to expiry |
The stock itself opened at $150, closed day one at $160.95 and touched an intraday high of $176.52. The source’s reference to an IPO peak near 200 could not be matched to a labelled price in news coverage, and its discussion is undated.
Because implied volatility is backed out of live option prices rather than historical data, a slide from above 100% to the 40s reflects shifting collective expectations about the size of future moves, not a verdict on direction.
An IV rank near 10 tells you options are cheap relative to SPCX’s own recent history. That changes both what stabilising flows look like and what it costs you to buy upside.
When big ASX news breaks, our subscribers know first
Gamma, call walls and IV rank explained: how dealer hedging shapes price
Start with gamma. It measures how quickly a dealer’s required hedge changes as the stock moves. When dealers are net long gamma (positive), their hedging dampens moves; when net short (negative), it amplifies them.
That amplification produces squeezes. Tesla is the reference case, where short-gamma dealers were forced to buy into rallies and fed the climb.
The same mechanics apply at index level, where short-gamma dealer hedging has pushed liquidity thinner and made smaller sell orders move prices further, which is the mirror image of the dampening seen in SPCX.
| Feature | Positive gamma | Negative gamma | Typical price behaviour |
|---|---|---|---|
| Dealer hedging | Sell rises, buy dips | Buy rises, sell dips | Stabilising versus amplifying |
| Volatility effect | Suppressed | Expanded | Grind versus spike |
| Squeeze risk | Low | Higher | Mean reversion versus follow-through |
A call wall comes next. It is a strike price with heavy call open interest (contracts still outstanding), often built by call selling. Dealers end up long those calls and hedged with short stock, so as price approaches the strike, their selling into strength slows or caps the rally.
IV rank completes the picture by placing current implied volatility within its own range. A low reading signals cheap options. Together the three terms tell you which move to expect, a grind or a spike.
What are the limits of gamma models?
Gamma is a probabilistic lens, not a guarantee. These models rely on public open-interest data and assumptions, because dealer books and over-the-counter positions cannot be observed.
Critics also say gamma overlays get over-interpreted in highly liquid mega-caps, where passive and long-only flows may matter more. News or block trades can swamp positioning entirely.
Reading the levels: the 170-200 call zone, the 162-163 pullback and what may be shifting
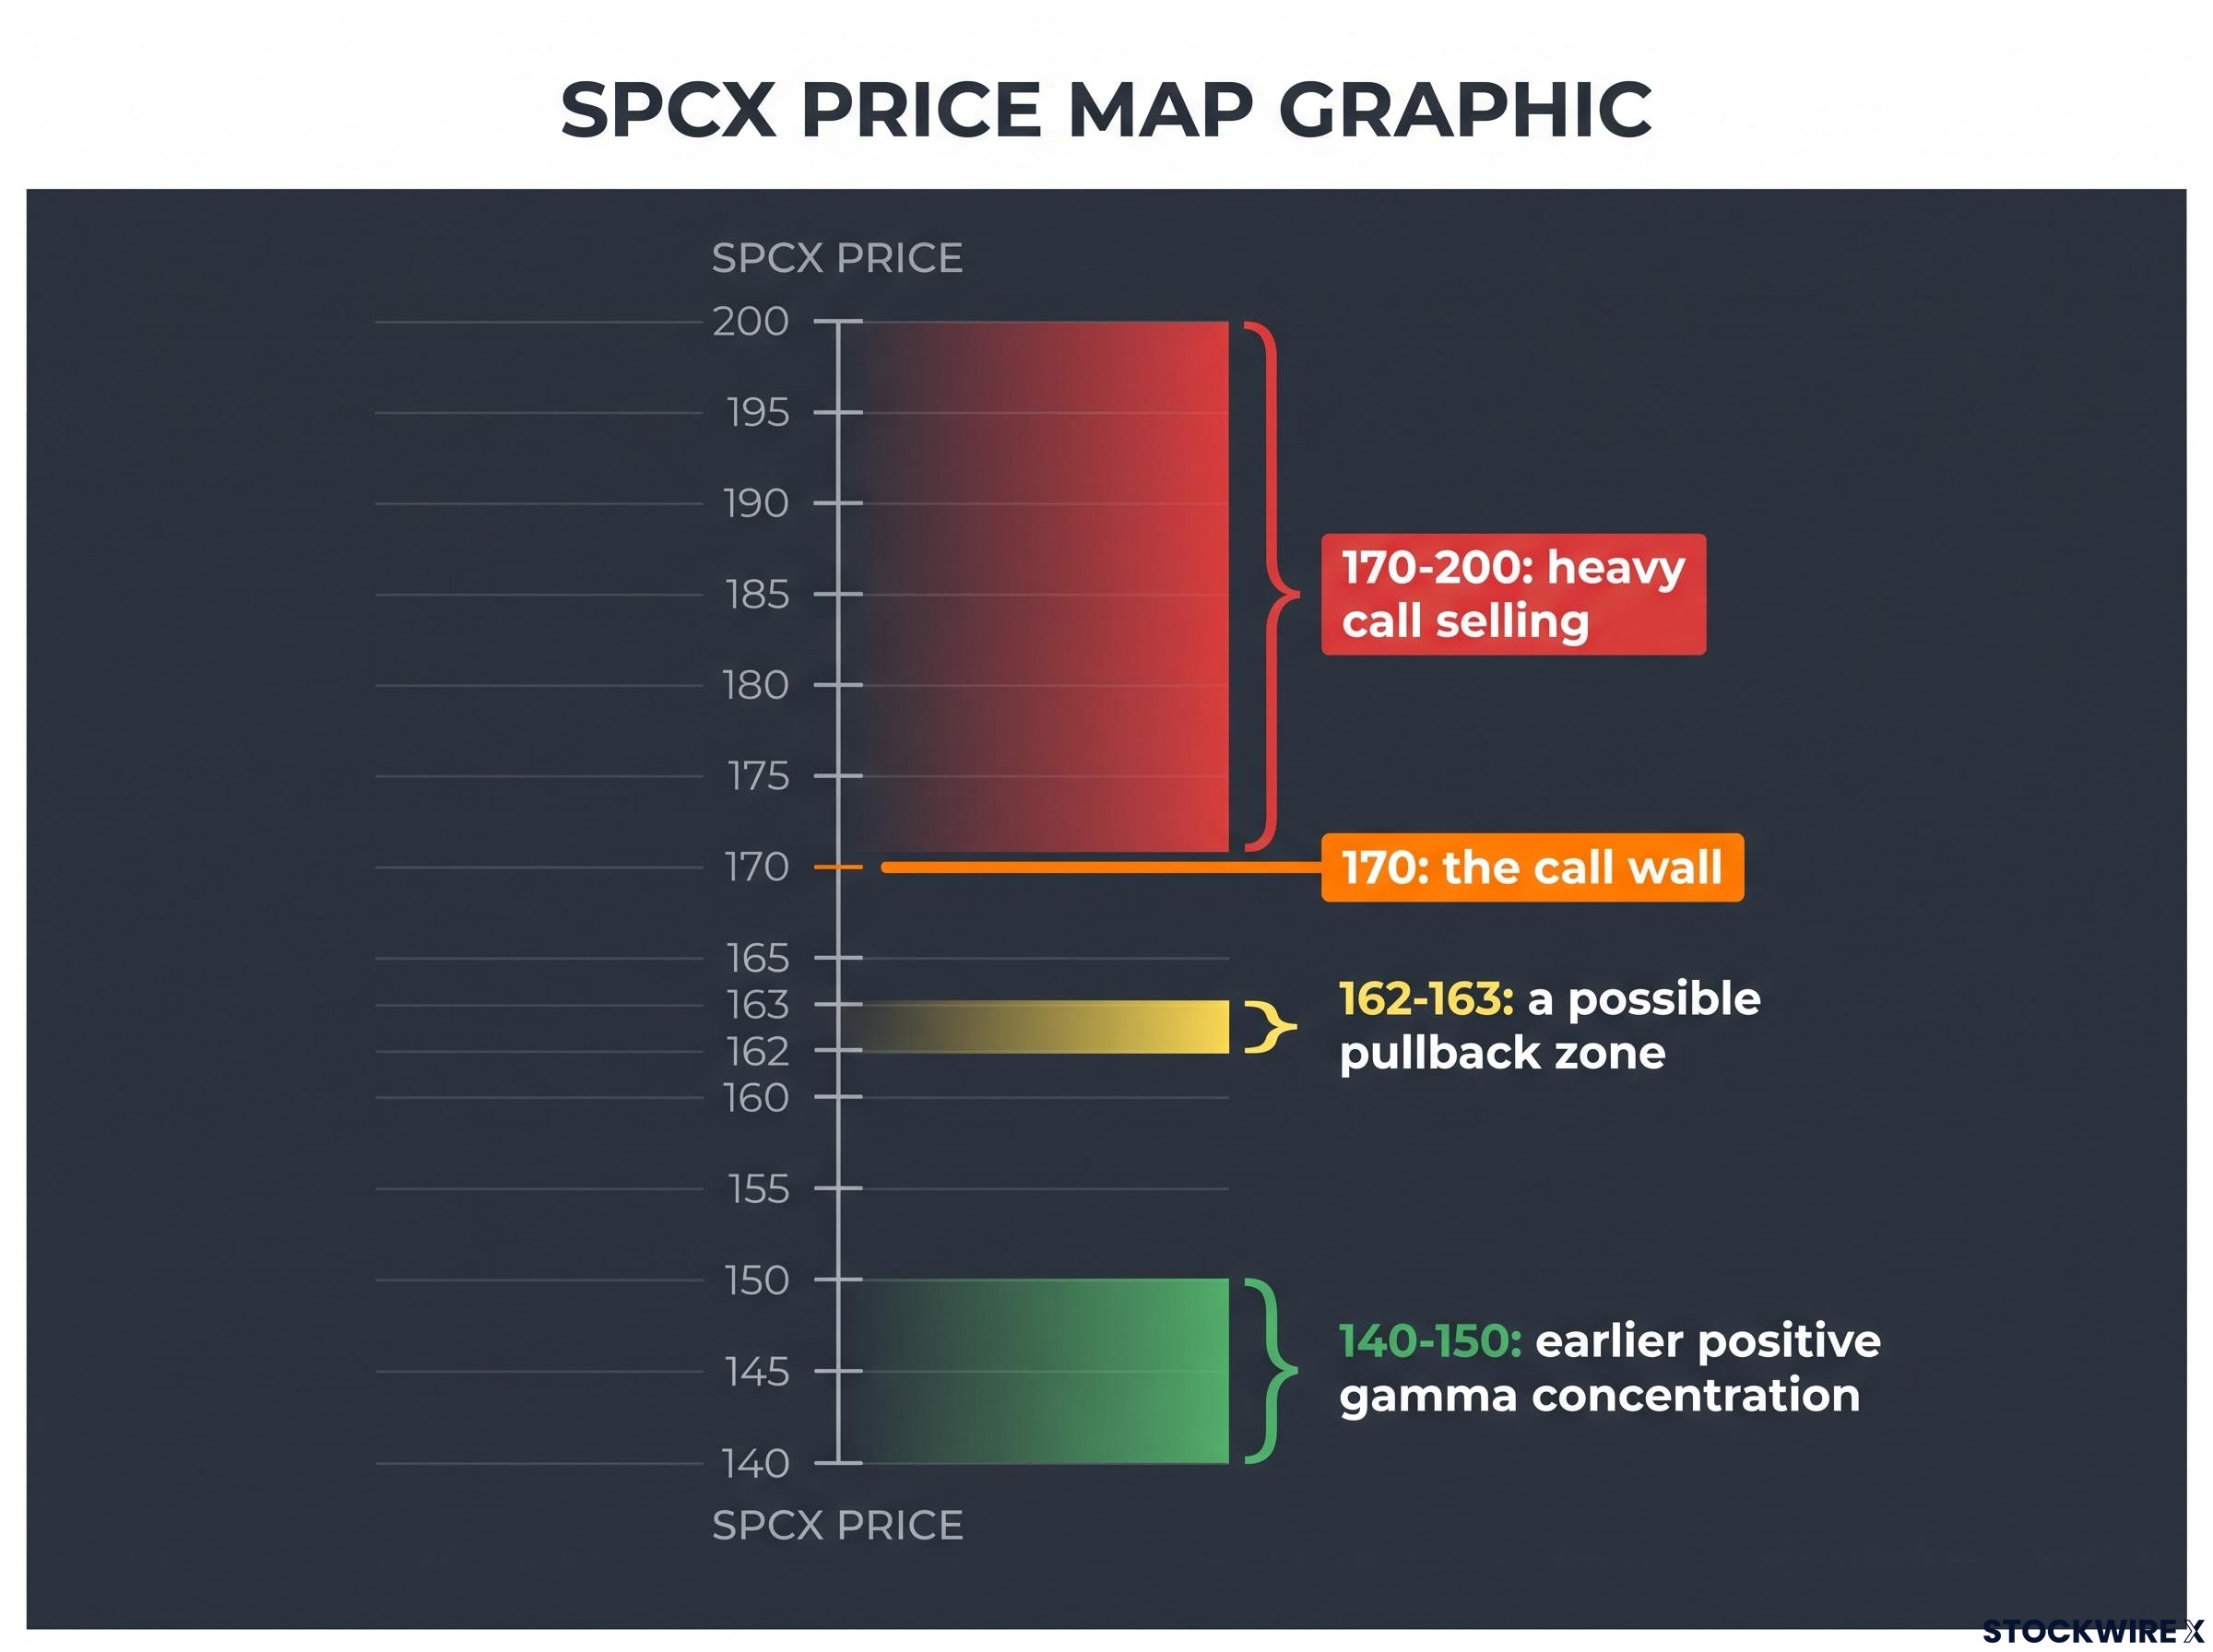
Treat these levels as a map. Heavy call selling sits between 170 and 200, while the earlier positive gamma concentration clustered around 140-150. The first implies a ceiling of perceived fair value; the second, a floor of stabilising flows.
- 140-150: earlier positive gamma concentration, where dealer hedging cushioned dips.
- 162-163: a possible pullback zone.
- 170: the call wall, where resistance is likely.
- 170-200: heavy call selling, a gauge of where traders see fair value capped.
At the time of the source’s session, the stock traded near 165 after a 3.5-5% gain on upgrades and rocket launch activity. Kachuba argued these may be creating some upside dealer short gamma, but not enough for a squeeze.
The thesis: rallies of a few dollars followed by mean reversion, a gradual climb rather than a sharp spike.
Musk’s social following could add upside energy, as it has with Tesla. Positive gamma, Kachuba said, means he would not fade the rally.
How current is this setup?
Not very. The latest reported close is $131.11 (16 July, NBC News), below the IPO price and well under the 170 wall. ATM IV was 44.16% on 3 October.
Data gaps matter too. No named analyst firms or price targets turned up, no independent source links launches to price moves, and no SPCX gamma analysis exists outside this one. One chain example: the 9 October 2026 230-strike call showed volume of 1,208 against open interest of 1,774.
Check current open interest before relying on any wall.
Structuring long-dated option positions when volatility is cheap, and what can go wrong
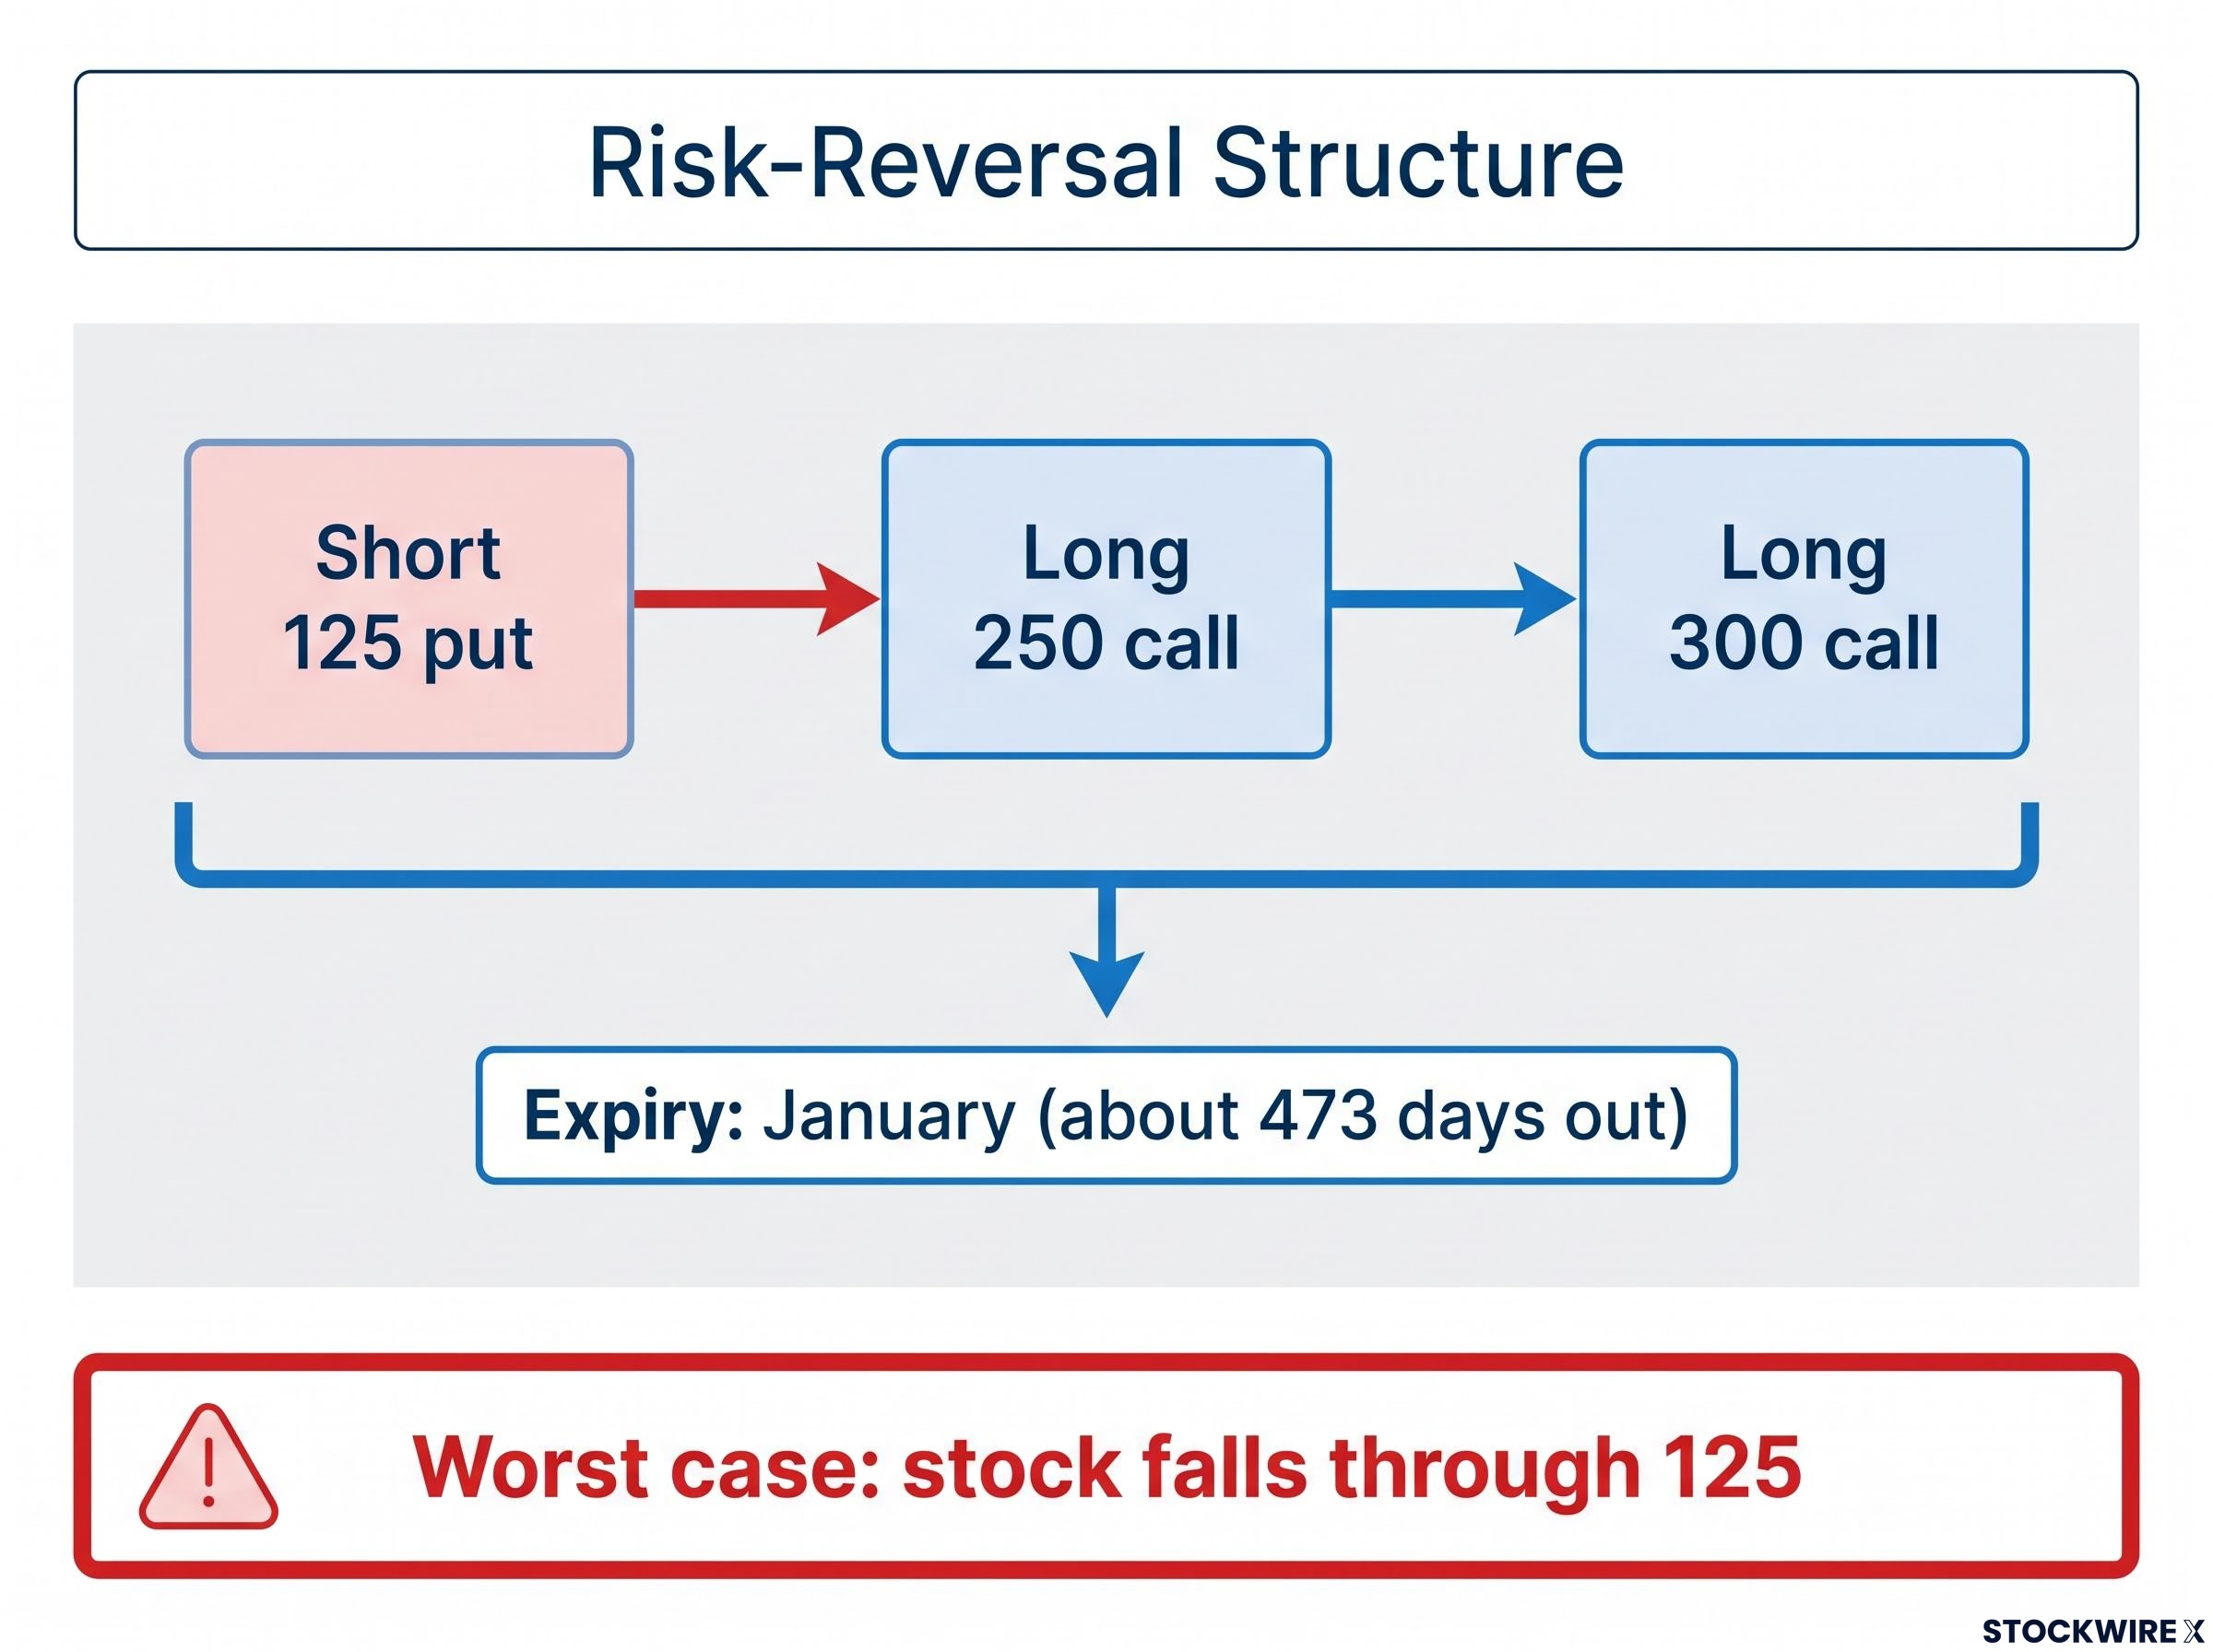
Cheap volatility lowers the cost of owning upside. Kachuba considers call buying more sensible now than earlier for that reason. The show’s hosts hold a risk-reversal: a short put financing long calls, which creates a leveraged long at low net cost.
Cheap volatility matters because option premium scales nonlinearly with IV, so a market that has halved its implied volatility can offer far more upside per dollar spent than it did in the weeks after listing.
- Legs: short 125 put; long 250 and 300 calls, January expiry, about 473 days out.
- Purpose: express a bullish view cheaply, aiming to profit if rallies lift IV.
- Best case: a strong rally lifts the calls and IV together.
- Worst case: the stock falls through 125 and the short put loses heavily.
General market practice, not tied to cited data, points to different tools by environment, as with Tesla, Arm, Meta and Rivian.
| Strategy | Best IV setting | Main benefit | Main risk |
|---|---|---|---|
| Long-dated calls | Low | Cheap upside | Time decay |
| Call spreads | Low to moderate | Lower cost | Capped gains |
| Risk-reversals | Low | Near-zero premium | Short-put losses |
| Hedged volatility selling | High | Premium income | IV re-expansion |
Where this structure can fail
The short leg is the problem. SPCX slid below its $135 IPO price by 16 July, a reminder of downside, and you should size for the scenario where the stock drops through the put strike.
Long-dated calls also lose value to time decay in a sideways market, and IV re-expansion hurts anyone short volatility. Deep out-of-the-money puts show IVs of several hundred percent or more, a sign of thin, uneven liquidity at the tails. Lockup expiry dates and terms were not found, so that supply risk remains unquantified.
Retail momentum can overwhelm stabilising gamma. This is education, not personalised advice, and projections here are speculative and subject to change with market developments.
What the positioning tells you, and what it cannot
Positive gamma and a call wall favour gradual moves, but that read is conditional on IV, flows and events. The levels are a dated snapshot, and launches, regulatory news or lockup supply can override dealer positioning.
Positioning can also shift quickly at the index level, where institutional put buying has been adding multi-month protection while skew sits near the low end of its range.
Three variables are worth monitoring: current open interest by strike, the direction of IV rank, and share supply from lockup expiries.
This article is for informational purposes only and should not be considered financial advice. Investors should conduct their own research and consult with financial professionals before making investment decisions. Past performance does not guarantee future results.