Meta’s revenue came in at $64.6 billion, ahead of expectations, and advertisers paid 14% more per ad than a year earlier. Then the shares fell almost 7% in the first full trading session, and kept sliding to close at $642.62 on 23 October 2026.
If you assumed a strong top line means a rising stock, the Meta Platforms earnings reaction is a useful correction. Investors treated this quarter less as a check on advertising demand and more as a test of capital discipline: how much Meta is spending on artificial intelligence (AI) and when that spending pays back.
That test leaves an awkward gap. Morningstar holds a $850 fair value on the stock (3 stars, wide moat, high uncertainty), well above both the post-earnings price and the $736.72 reference price from its 15 October report.
The sections below set out what the quarter proved, what it left unproven, and a set of tests you can apply to decide whether the selloff looks like an opportunity or a warning.
Why did Meta’s stock fall after a strong quarter?
The first reaction was celebration. Results landed after the US close on 21 October, and shares climbed about 3.8% to $723.93 in after-hours trading on the revenue beat and upbeat commentary about Muse, Meta’s AI agent product.
The operating numbers gave buyers plenty to like:
- Revenue of $64.601 billion, up 26%
- Advertising revenue of $63.061 billion
- Ad impressions up 10%, average price per ad up 14%
- Operating cash flow of $32.79 billion
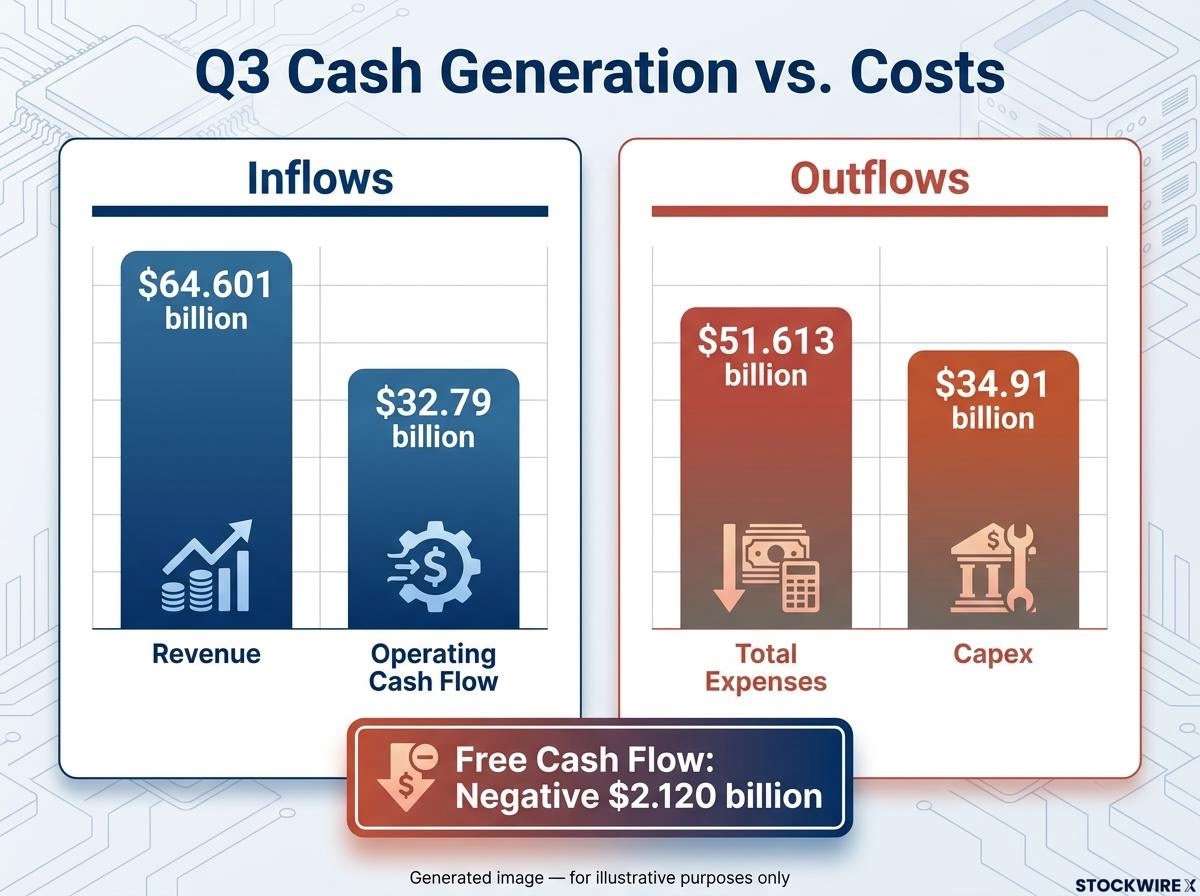
By the next morning, investors had read further down the page. Total expenses jumped 68% to $51.613 billion. Capital expenditure (capex), the money spent on physical assets such as data centres and chips, reached $34.91 billion for the quarter, leaving free cash flow, the cash left after those investments, at negative $2.120 billion.
The margin squeeze Operating margin fell to 20%, compared with 40% a year earlier.
A $9.89 billion teen-safety legal charge cut GAAP earnings per share to $3.83, against $7.40 excluding the charge. Management also lifted the floor of its 2026 capex guidance to $135-$145 billion and gave no figure for 2027. Reuters reported investor objections to a planned issue of nonvoting shares to help fund the spending, though that account has not been independently confirmed.
Negative free cash flow turns the debate into a question of who pays for AI before it pays back, since funding choices such as bonds, equity or nonvoting share issuance carry different costs for existing holders.
| Date | Price | Move | Context |
|---|---|---|---|
| 15 October 2026 | $736.72 | Reference | Morningstar pre-earnings price |
| 21 October 2026 (after hours) | $723.93 | +3.8% | Revenue beat, Muse optimism |
| 22 October 2026 | $648.85 | -6.98% | First full session, capex repricing |
| 23 October 2026 | $642.62 | -0.96% | Follow-through selling |
Demand was never the problem. What this tells you is that the market now prices Meta on returns from its spending rather than on ad growth, so the figure to judge it against is cash generation, not another revenue beat.
When big ASX news breaks, our subscribers know first
What does Meta’s moat and balance sheet actually protect?
A moat is a durable competitive advantage that keeps rivals from eroding a company’s profits. Morningstar rates Meta’s as wide, and it rests on two sources:
- User data, an intangible asset that sharpens ad targeting
- Network effects across Facebook, Instagram, WhatsApp and Messenger, where each app becomes more useful as more people join
- 3.64 billion family daily active people, up 3%
- Cash of $82 billion against debt of $59 billion at the end of fiscal 2025
Morningstar expects the Family of Apps to earn above its cost of capital (the minimum return investors demand) for two decades, and forecasts 22% compound annual sales growth over five years, driven mainly by higher revenue per user. Antitrust concerns exist, but Morningstar views a breakup as unlikely. That advertising cash flow, backed by the balance sheet, is what funds the AI build-out.
How to read the star rating and fair value
Three stars means the price sat close to Morningstar’s fair value when rated, which was true at $736.72. At roughly $642-649, against an unchanged $850, Morningstar’s post-earnings commentary describes the stock as undervalued.
Implied multiples at $850 A 2026 adjusted price-to-earnings (P/E) ratio of 26x and an enterprise value to adjusted EBITDA (earnings before interest, tax, depreciation and amortisation) multiple of 13x.
High uncertainty widens the range of plausible outcomes around that estimate. For you as an investor, the moat explains why the advertising engine is unlikely to break, but it says nothing about whether GPU-heavy capex will earn above the cost of capital.
Muse, compute sales and capex: what investors were really testing
The revenue-side bets
Morningstar flagged Muse adoption and monetisation as the most important item of the quarter. The release called Muse and Muse Wonder milestones toward “personal superintelligence” and described a prospective model of free and paid tiers, plus a share of agentic-commerce transactions. It gave no formal user, engagement or revenue figures; a reported user count above 10 million circulates in secondary coverage but remains unconfirmed.
Muse subscription maths is sobering at the scale of spending involved: at $20 per month, covering a single year of capex would require hundreds of millions of paying subscribers, which is why adoption alone is not revenue.
The compute-sale idea is thinner still. No customer, price or revenue was disclosed, so there was nothing to compare with Morningstar’s $9 billion per-gigawatt benchmark. Morningstar nonetheless projects renting surplus capacity to AI labs could reach $40 billion by 2030.
The cost side of the ledger
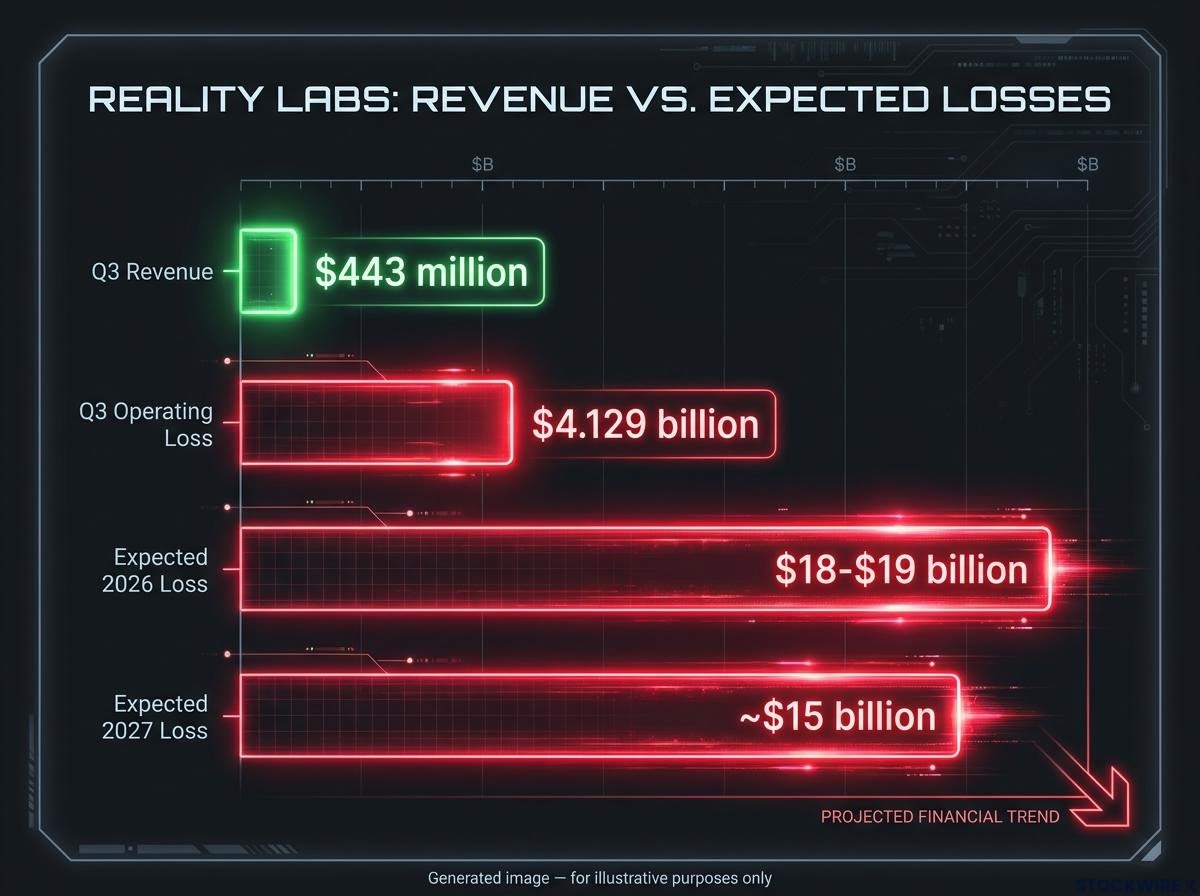
The costs, by contrast, are precise. Capex is guided at $135-$145 billion for 2026, with 2027 undefined. Reality Labs, the virtual and augmented reality division, posted $443 million in revenue against a $4.129 billion operating loss, with losses expected around $18-$19 billion in 2026, narrowing to about $15 billion in 2027.
| AI thread | What was disclosed | What is missing | Status |
|---|---|---|---|
| Ad improvement | Impressions +10%, price per ad +14% | Little; visible in results | Proven |
| Muse and agentic commerce | Product launches, tiered model | Users, engagement, revenue | Prospective |
| Meta Enterprise intelligence | Cited by Morningstar as a route | Any revenue figure | Prospective |
| Excess-compute sales | Morningstar $40B by 2030 projection | Customer, price, contract | Speculative |
Of Morningstar’s four monetisation routes, only advertising shows up in the numbers. What this tells you is that any valuation leaning on the other three is underwriting a forecast rather than a result.
Bull case versus bear case: where the disagreement really sits
The bull case
Morningstar’s bull case rests on better targeting and recommendation algorithms, rising digital ad spend, and fresh inventory from Threads, Stories and Reels. The 26% revenue growth suggests AI is already paying off inside the ad engine. Baird, via CNBC, is moderately bullish but sees ads as the near-term driver; Deutsche Bank’s Benjamin Black was reported as arguing AI is lifting advertiser returns, though that account is unverified.
The bear case
Bears point to billions in annual losses from Reality Labs and AI, and to Meta’s reliance on Chinese retailers such as Temu and Shein, which some unconfirmed estimates put above 10% of revenue. The teen-safety agreement with 52 attorneys general involves payments of up to about $18.59 billion, following $2.4 billion in Q2 legal charges. D.A. Davidson’s Gil Luria and Direxion’s Jake Behan were reported as warning about dilution and unproven Muse monetisation, though neither view has been confirmed.
History adds weight. During the 2021-2022 capex surge, the stock reportedly fell around 75% peak to trough, an unverified figure, but that spending came as ads slowed, whereas 2026 brought 26% revenue growth.
| Risk | Why it matters | Counter-argument |
|---|---|---|
| Chinese retailers | Spending pullback could slow growth | Better ad ranking can offset one weak group |
| Regulation | Remedies could limit targeting | Wide moat; breakup seen as unlikely |
| Litigation | $9.89B charge; more costs possible | Largely discrete; ex-charge EPS $7.40 |
| Reality Labs | $4.129B Q3 loss | Expected to narrow to about $15B in 2027 |
| Negative FCF | -$2.12B despite strong operating cash | Ad growth could restore it if capex slows |
| Compute thesis | No disclosed deal | Excess capacity is a valuable option |
| Muse | Adoption is not revenue | Could lift ads, subscriptions and commerce |
The real question Both sides agree AI improves Meta’s ads. They disagree on whether incremental ad profit compounds fast enough to cover depreciation, financing costs, dilution and the opportunity cost of $135-$145 billion a year.
Your view of Meta therefore depends less on whether AI helps ads (it already does) and more on how patient you are with a multi-year payback.
A framework for judging Meta as an investment
Apply these five tests to each quarterly report:
- Ad engine health. Watch impressions (+10%) and price per ad (+14%). Growth in both is encouraging; falling prices signal weakening demand.
- Free cash flow trajectory. The baseline is negative $2.12 billion. A return toward positive territory is encouraging; deeper negatives without new revenue are a warning.
- Capex discipline. Track the $135-$145 billion guide and any 2027 figure. A defined, bounded number helps; open-ended increases hurt.
- Non-ad AI revenue. Look for Muse metrics or a signed compute deal against Morningstar’s $40 billion 2030 projection. Disclosed figures matter; more promises do not.
- Legal and concentration risk. Watch for new settlements and Reality Labs losses moving from $18-$19 billion toward about $15 billion.
Margin is the cross-check. Ex-charge operating income of $22.88 billion on $64.6 billion of revenue implies roughly 35%, against the reported 20%.
A sum-of-parts framework helps here because Reality Labs losses distort the consolidated multiple, and litigation exposure can be converted into a per-share discount rather than treated as an unquantifiable risk.
For the gap between roughly $642-649 and $850 to close on substance, ads must keep compounding while at least one non-ad route produces visible revenue. Applying these tests tells you whether that gap is narrowing because of evidence or only because of sentiment.
Past performance does not guarantee future results. Financial projections are subject to market conditions and various risk factors.
What the selloff changes, and what it leaves untouched
The advertising engine and the moat behind it came through this quarter intact. What changed is the price of proving the AI thesis, which is now higher and far more visible in Meta’s cash flow.
That reframes Morningstar’s $850 fair value. The distance from roughly $642-649 is a discount only if AI monetisation arrives; until then, it is a conditional estimate rather than a guaranteed bargain.
Four markers will decide which way it resolves: the 2027 capex figure, any disclosed Muse monetisation metrics, a signed compute deal, and the direction of free cash flow.
This article is for informational purposes only and should not be considered financial advice. Investors should conduct their own research and consult with financial professionals before making investment decisions.