Brent crude finished 23 October above $117 a barrel, and the largest energy stocks fund hit a record. Gold, meanwhile, is hovering near $4,000 an ounce, roughly 28% below its January peak, in the middle of an active Middle East war. If war is supposed to lift every “real” asset, this market did not get the memo.
That split is a reading problem, not a glitch. Assets that usually rise together in a crisis are moving in opposite directions, and the gap carries information about interest rates, the US dollar and how much cash investors can actually get their hands on.
Here is what each side of the divergence between energy stocks and the Iran war’s supposed havens is pricing, and the signals that would tell you the picture is starting to turn.
Why are energy stocks surging while the Iran war drags on?
Start with the barrels. The US-Israeli war with Iran began on 27 February 2026, and the Strait of Hormuz, which normally carries about one-fifth of global oil flows, was effectively shut from late February onward. Reuters estimated the disruption at 5-7 million barrels per day.
The International Energy Agency (IEA), the Paris-based body that tracks global energy supply, called it the largest supply crisis in its history. In August it raised its forecast for the 2026 supply decline from 3.9 million to 4.3 million barrels per day, about 4% of world supply.
Scarcity on that scale flows almost straight into producer revenue. When a barrel sells for more and costs about the same to lift, the difference lands in cash flow.
Scarcity of this size is hard to offset because emergency reserve releases of roughly 280 million barrels have not stopped inventories drawing, and OPEC spare capacity is negligible against the volumes lost.
| Asset | Level (23 October) | Move | Milestone |
|---|---|---|---|
| Brent crude | Above $117 | More than 40% above pre-war level | Highest in more than four years |
| WTI crude | Above $103 | Pushed back through $100 | War-driven break of the $100 level |
| XLE | $69.61 | Up more than 50% year to date | Record since December 1998 launch |
| XOP | About $203.48 | Up roughly 3% on the day | At or near a multi-year high |
The two funds are not the same bet. The Energy Select Sector SPDR Fund (XLE), an exchange-traded fund (ETF) holding integrated majors, earns from drilling, refining and marketing. The SPDR S&P Oil & Gas Exploration & Production ETF (XOP) holds upstream producers whose profits track crude far more directly. Sources disagree on XOP’s exact milestone: one describes its highest level since 2014, others a record or 52-week high, so treat “multi-year high” as the safe reading.
The early weeks showed how cleanly the shock sorted winners from losers.
First 20 trading days after 27 February (Cambridge Associates) Global equities: -8.5% | Global energy equities: +11.2% | Broad commodities: +23.5%
The read for you is straightforward. These record prices are the market paying for scarcity right now, which ties the gains to the war’s path rather than to a steady earnings trend.
When big ASX news breaks, our subscribers know first
Why gold, silver and Bitcoin are falling when war should help them
If energy behaves as expected, the havens do the opposite. Fear should lift gold. Instead, the precious metals and Bitcoin have given back much of their gains.
| Asset | Recent level | Reference high | Drawdown |
|---|---|---|---|
| Gold | About $3,995.81/oz | $5,595 (January) | About 28.6% |
| Silver | About $53.90/oz | $121.64 (January) | About 55.7% |
| SLV | $49.34 (22 October close) | n/a | Down 5.59% on the day; about 18.9% year to date |
| Bitcoin | About $81,826 | September high (no verified figure) | Not calculable |
One source put SLV down just over 1% on the day; that likely reflects a different session from Yahoo Finance’s 5.59% figure. The mechanics explain the rest through four channels:
- Real yields: higher oil lifts inflation expectations, so markets price fewer rate cuts and yields rise.
- The dollar: a stronger greenback makes dollar-priced metals dearer for overseas buyers.
- Liquidation: investors sell what is liquid and profitable to cover losses elsewhere.
- Bitcoin liquidity: crypto trades with funding conditions, not fear.
Metals: the rate channel
Gold pays no interest, so its appeal depends on what you give up to hold it. The real yield, meaning the interest rate after inflation, measures that cost. UBS analyst Giovanni Staunovo pointed to higher oil, rising expectations of further US rate hikes, elevated real yields and a firmer dollar as the main weights on gold. The dollar is reported to be about 4% higher since the war began.
Central banks face a hard choice because cost-push inflation from energy is difficult to fight with rate hikes, yet markets have already priced meaningful odds of tightening, which keeps real yields elevated and caps gold.
Reuters also reported that gold slid after the war started as investors raised cash to cover losses. The technical picture, with gold barely holding 4,000 and SLV forming what one trader called an “ugly triangle”, describes positioning. That same trader sees a possible fall toward 3,500, an individual opinion rather than a forecast.
Bitcoin: the liquidity channel
Bitcoin briefly lost $81,000 and, according to CryptoSlate, fell alongside tech stocks and gold even as Treasury yields declined. That pattern points to funding stress and position cutting.
If gold and Bitcoin are trading on real yields and liquidity rather than fear, you should read their weakness as a rates signal, not as a verdict that the war does not matter.
What a cross-asset split actually tells you
The fastest way to make sense of a split like this is one question: what is each asset a claim on? A claim, here, means the thing whose value ultimately decides the asset’s price.
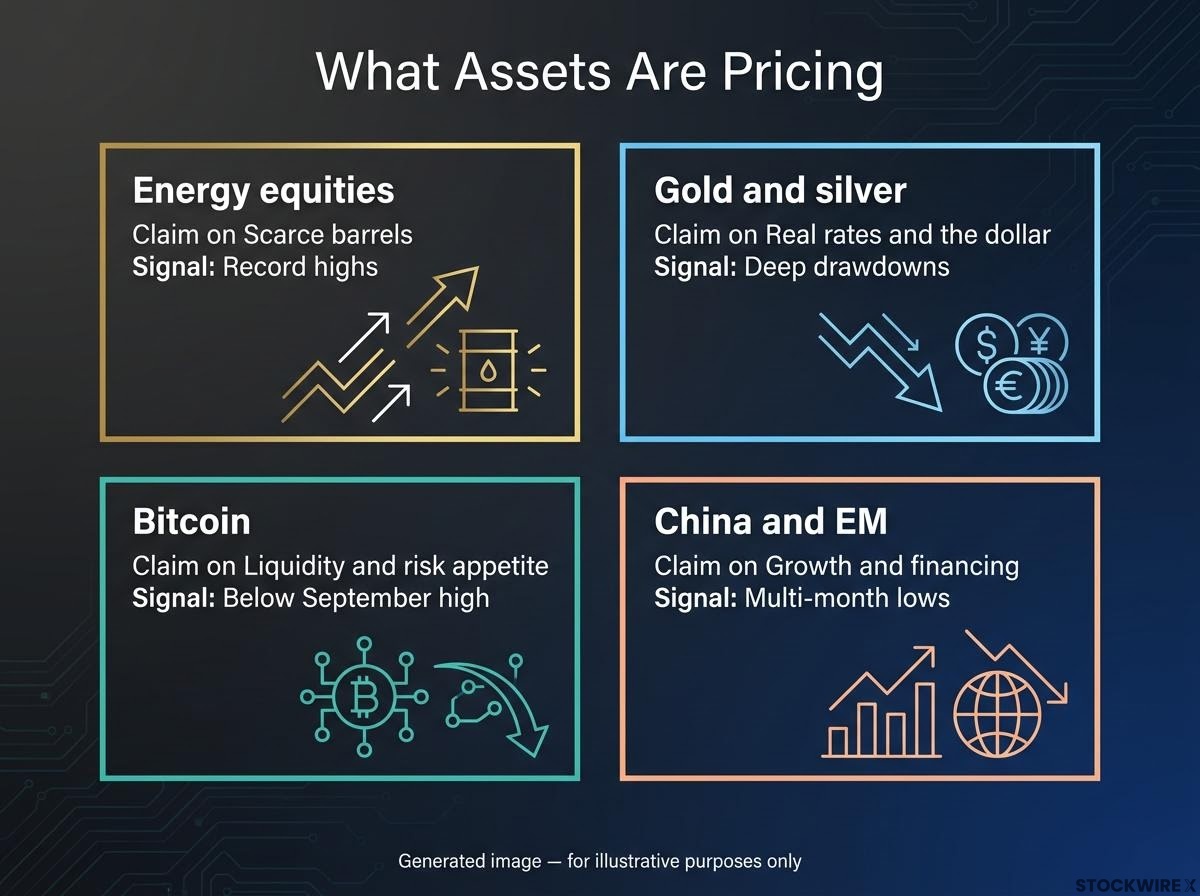
| Asset group | What it is a claim on | Current signal | Main pressure |
|---|---|---|---|
| Energy equities | Scarce barrels | Record highs | War path, ceasefire risk |
| Gold and silver | Real rates and the dollar | Deep drawdowns | Rising yields, firm dollar |
| Bitcoin | Liquidity and risk appetite | Below September high | Deleveraging |
| China and EM | Growth and financing | Multi-month lows | Import costs, US yields |
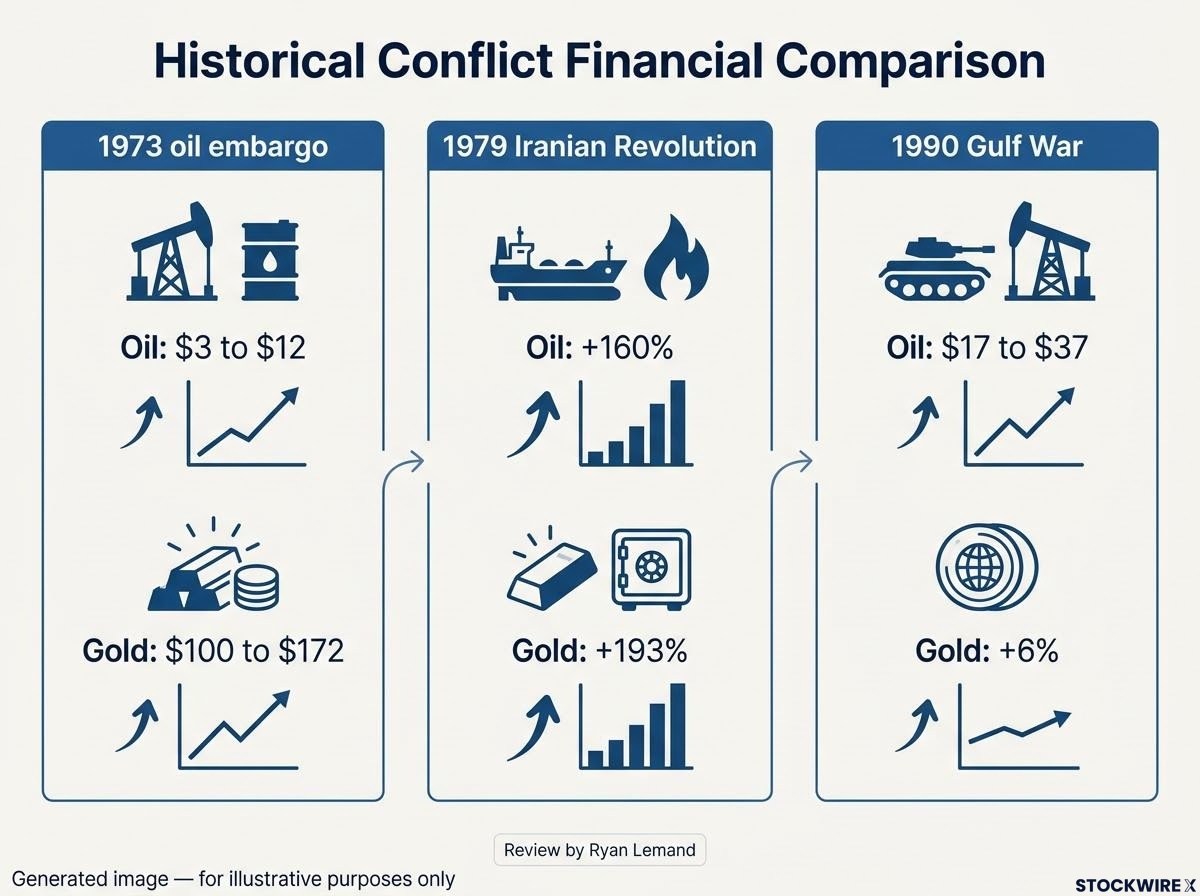
History shows the monetary backdrop decides whether oil and gold move together, according to a review by Ryan Lemand:
- 1973 oil embargo: oil rose from about $3 to $12; gold climbed from about $100 to $172 as the dollar weakened.
- 1979 Iranian Revolution: oil rose about 160% and gold about 193%.
- 1990 Gulf War: oil jumped from about $17 to $37, yet gold gained only about 6% in a conflict expected to be short.
- 2022 Russia-Ukraine: both rose at first, then aggressive Federal Reserve tightening, a stronger dollar and higher real yields pulled gold down while the energy squeeze persisted.
2022 is the closest match to today. The war supplies the shock; the policy response decides who wins.
China and emerging markets in the picture
The MSCI Emerging Markets index, a benchmark of developing-economy shares, fell 2.5% on 23 October to its lowest since July. Mainland Chinese blue chips sit about 20% below their late-June peak, and Reuters reported that higher energy costs are hurting China despite strong exports. The iShares MSCI EAFE ETF (EFA), covering developed markets outside North America, stands at 103.15 after seven straight weeks of negative weekly momentum, per Nasdaq Dorsey Wright.
Knowing which driver each asset answers to lets you separate the war itself from the policy reaction to it. That distinction decides what you watch next.
What could reverse the split, and what to watch next?
Conviction in the energy trade is easy to hold until it is tested. On 9 October, it was.
9 October 2026: After Donald Trump said the US would not attack Iran before the November elections and talks appeared more productive, Brent fell to $103.53 and WTI to $90.97 (Reuters).
The premium returned just as quickly. On 14 October, a mine sank a container ship in Hormuz and Houthis reportedly attacked Saudi Aramco’s headquarters; by 23 October, Iran was declaring readiness for “asymmetric warfare”.
| Interpretation | Reasoning | Evidence |
|---|---|---|
| Structural energy repricing | Genuine physical shortage | IEA shortfall of 3.9-4.3 million b/d |
| Cyclical war premium | Prices reverse on ceasefire | 9 October sell-off |
| Gold oversold | Reserve diversification premium persists | MKS PAMP’s Nicky Shiels: premium above fundamentals over $1,000/oz since 2022 |
| Gold has further downside | High oil keeps rates elevated | Staunovo warns of near-term volatility |
The risks stack up. OPEC+ (the oil producers’ alliance plus partners such as Russia) lifted output about 900,000 b/d in September to 39.07 million b/d, while OPEC cut its 2026 demand-growth forecast to 180,000 b/d, a sign of demand destruction. Windfall-tax measures could squeeze producers, and Nomura’s Dominic Bunning warned that an excessive energy shock could damage the AI-driven inflows supporting the dollar.
The Hormuz risk premium may also prove sticky after any deal, since insurers, mine clearance and supply chain repair take months, and the IEA has pointed to a recovery measured in years rather than weeks.
Four variables deserve your attention:
- Hormuz shipping status
- Real yields and the dollar
- OPEC+ output
- US-Iran talks
Because diplomacy alone knocked oil sharply in a day, treat any energy position as a bet on the war’s path and size it accordingly. Past performance does not guarantee future results, and these interpretations may change with market developments.
What the divergence changes, and what it does not
The split resolves into four separate prices. Energy is pricing scarcity. Gold and silver are pricing the rate consequences of that scarcity, Bitcoin is pricing liquidity and risk appetite, and China and emerging markets are pricing growth and financing damage.
What it does not do is forecast. Gold near 4,000 and a record XLE are positioning markers, not destinations.
The decision point comes down to one question: which moves first, real yields or Hormuz? A sustained drop in real yields would likely revive the havens, while a reopened strait would hit energy hardest. Watch whichever signal your portfolio is most exposed to.
This article is for informational purposes only and should not be considered financial advice. Investors should conduct their own research and consult with financial professionals before making investment decisions.