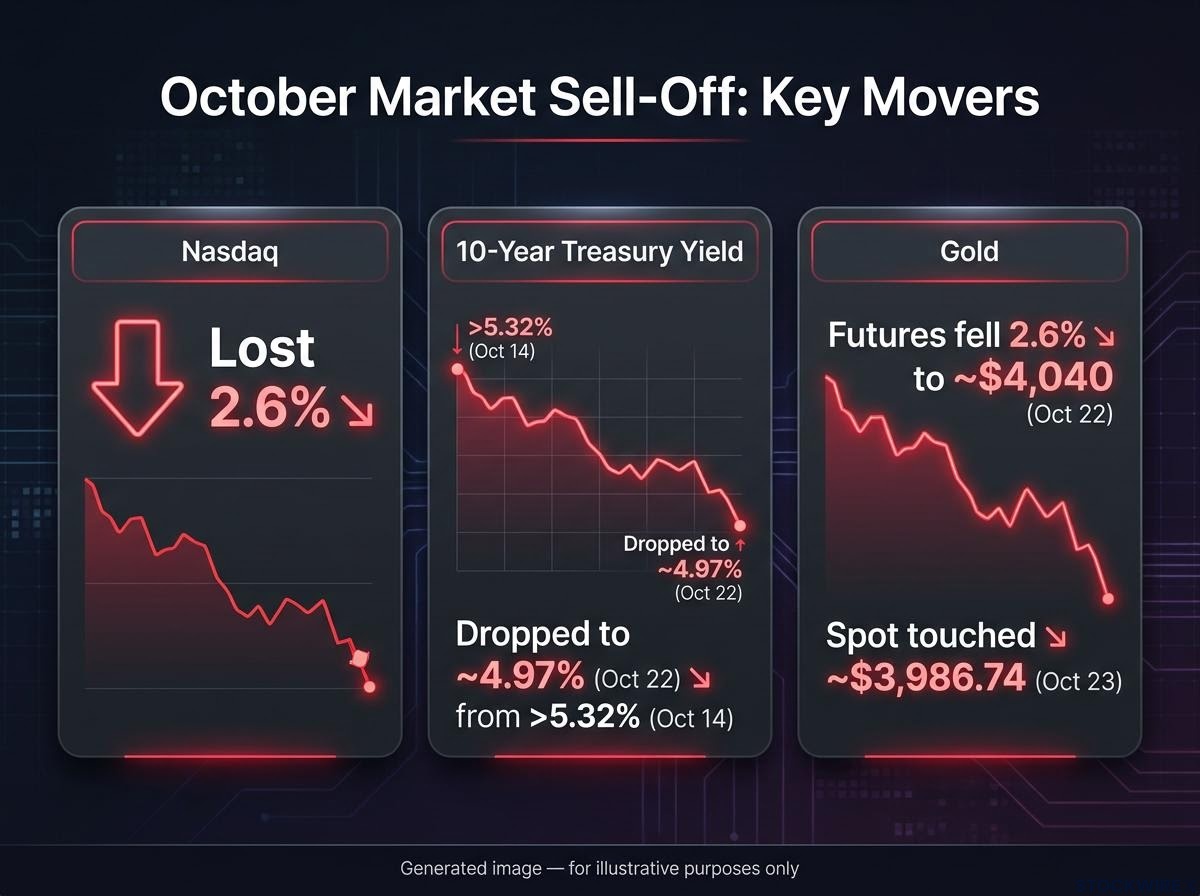
Gold slipped below $4,000 an ounce on 23 October, a day after the Nasdaq lost 2.6% and the 10-year US Treasury yield fell about 16 basis points. That combination makes this week’s market sell-off harder to dismiss than a routine pullback. A basis point is one hundredth of a percentage point.
The year’s two winning trades, short bonds and long artificial intelligence (AI), are unwinding at the same time. The hard part is telling ordinary profit-taking apart from forced selling while it is still happening.
Europe adds pressure. Moody’s has finished its review of France, and the European Central Bank (ECB) meets on 29 October.
Here is a short checklist for judging whether this is a scare or something bigger, along with the verdict the data supports as of 24 October.
Why falling gold changes how this sell-off should be read
The comfortable explanation is simple. Investors who made large gains in AI and semiconductor stocks are banking some profits after a long run.
Gold does not fit that story. A market panel on 23 October separated healthy profit-taking from panic, contagion and forced liquidation, and concluded the episode sat closer to panic. Gold was the main reason.
| Healthy profit-taking | Forced liquidation |
|---|---|
| Selling concentrated in crowded winners | Selling spreads across stocks, bonds, commodities and credit |
| Volatility rises but stays orderly | Volatility outruns available liquidity |
| Credit spreads stay contained | CCC spreads gap wider and ETFs turn illiquid |
| Gold, the dollar or government bonds rally | Gold and other liquid winners are sold for cash |
| Leverage stays manageable | Margin calls reinforce the move |
Gold futures fell 2.6% to about $4,040 on 22 October, and spot gold briefly touched about $3,986.74 the next day. On 22 October the 10-year yield dropped to about 4.97%, having traded above 5.32% on 14 October.
Gold is normally the liquid safe asset. In a leveraged portfolio, though, the most liquid profitable position is often the first sold to meet a margin call, which is a demand from a lender to add cash or close positions. Jim Wyckoff of American Gold Exchange linked gold’s fall partly to margin calls, while Soojin Kim of MUFG cited selling to cover equity and bond losses.
Margin calls are only one channel through which forced selling risk builds; pre-set risk limits and investor redemptions can also compel managers to sell their most liquid winners, which helps explain why gold is being sold alongside equities.
The panel’s read: gold falling when it would normally rally pushed the episode toward the panic type.
Short sellers, meanwhile, held about $6 billion of unrealised profits in neocloud and data-centre names, according to Reuters. The best diagnosis is a hybrid: profit-taking in AI, semiconductors, data centres and bonds, increasingly amplified by leverage reduction.
For you, the most useful question is where the money is going. If nothing safe is rallying, investors are raising cash rather than seeking shelter, and that selling is more likely forced than chosen.
When big ASX news breaks, our subscribers know first
What do the VIX curve, vol-of-vol and credit say right now?
The same panel named four indicators it would monitor:
- The front of the VIX curve, and vol-of-vol
- Credit
- Cross-asset contagion
- The dollar
Volatility: orderly on the surface
The VIX measures expected 30-day volatility in the S&P 500. On 23 October it sat near 19.45, below three-month volatility (VIX3M) at about 20.48, a ratio of about 0.95. That upward slope, called contango, is not the shape usually seen in a crisis, when spot rises above longer-dated readings.
The shape of the VIX futures curve matters more than the spot reading, because contango points to stress expected to fade while backwardation signals that traders expect turbulence to persist.
The front end is less settled. Cboe futures ran 19.55 for November, 20.19 for December and 20.62 for January, yet a separate settlement calculation briefly showed the first two contracts inverted.
Vol-of-vol measures how sharply volatility itself is swinging. No verified 23 October reading was available, so its direction is the thing to track.
Credit: stress at the edges
| Measure | Level | Reading |
|---|---|---|
| VIX spot | 19.45 | Elevated, not panic |
| VIX3M | 20.48 | Above spot, normal slope |
| Broad US high yield | 340 bp | Contained |
| CCC and lower | 1,340 bp | 100th percentile since October 2023 |
| HYG/LQD ratio | 0.7419 | Normal regime |
CCC bonds, the lowest-rated junk debt, have deteriorated far faster than the broad market. The JNK ETF sat near recent lows at about $77.04, though ETF prices can mislead when liquidity is thin.
Three readings compete: contained repricing, early contagion, or a false signal. Calm volatility alongside stressed CCC credit tells you the strain is concentrated in the weakest borrowers and crowded AI exposure, not yet spread across the system.
Europe’s pressure point: France, the euro and the October 29 ECB meeting
Moody’s holds, markets do not
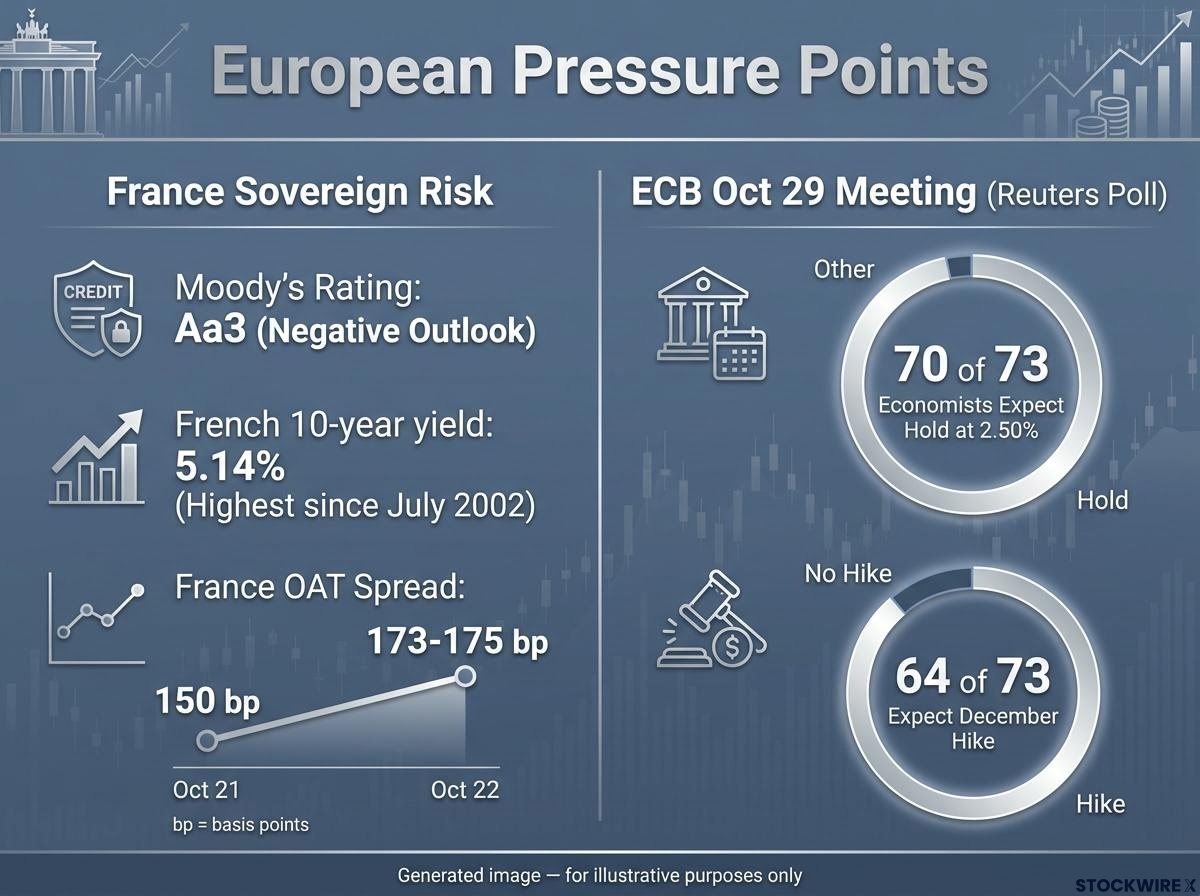
Moody’s left France unchanged at Aa3 with a negative outlook, citing political fragmentation, fiscal risks and uncertainty over the 2027 budget. Markets were not reassured.
The French 10-year yield reportedly reached 5.14%, its highest since July 2002.
| Spread over Bunds (10-year) | Oct 21 | Oct 22 |
|---|---|---|
| Italy BTP | 113 bp | 126 bp |
| France OAT | 150 bp | 173-175 bp |
France’s spread now sits near a 15-year extreme. Yet the euro held around 1.12 (ECB reference 1.1193), while the dollar index slipped 0.2% to 101.63 on 22 October.
The split makes sense. The euro tracks broad dollar moves and relative central bank outlooks, while spreads track country-specific risk, so investors can keep euros while dumping French bonds.
The ECB’s October 29 test
A Reuters poll found 70 of 73 economists expect a hold at 2.50%, and 64 of 73 expect a December hike. Energy-driven inflation argues for tightening; wider spreads and weaker stocks argue for caution.
Beyond the expected hold, the ECB October meeting hinges on whether Lagarde signals a December hike, with swaps pricing roughly 75bp of tightening by September 2027 as headline inflation reaches 3.8%.
The precedent is uncomfortable. In March 2020, Christine Lagarde said the ECB was “not here to close spreads”, which triggered a euro sell-off and a later clarification. Today’s episode is milder, but for your bond exposure the ECB’s tone on spreads matters more than the rate decision itself.
How this compares with past scares, and what would turn it serious
| Episode | Distinguishing feature | Lesson |
|---|---|---|
| August 2024 | Abrupt spike, positioning-driven, no credit seizure | Extreme VIX readings can fade fast |
| March 2020 | Forced liquidation plus funding stress | Resolved only by central bank action |
| 2022 | Slow repricing of rates and inflation | Stabilised once policy expectations turned |
| October 2026 | CCC stress and gold liquidation; VIX curve orderly | Worse than profit-taking, short of panic |
The bottom line is incipient liquidation stress in weak credit and crowded AI trades, not generalised contagion. The episode would turn more damaging if:
- CCC spreads keep gapping wider
- Broad high yield moves rapidly beyond about 340 bp
- HYG and JNK liquidity deteriorates
- VIX spot moves decisively above VIX3M
- Vol-of-vol surges
- Gold keeps falling despite a flight into Treasuries
That list tells you the right posture is vigilance, not alarm. Specific lines deserve watching; neither the worst case nor a shrug is justified yet.
These statements are speculative and subject to change based on market developments.
What would make this a bigger problem, and what to watch before the ECB speaks
The verdict sits between two poles. This is more serious than routine profit-taking and well short of March 2020, with gold the one signal that refuses to fit the benign story.
Before 29 October, check four things: CCC spreads, VIX against VIX3M, French spreads, and whether the ECB’s wording offers any containment signal. If credit stays orderly and the ECB speaks to spreads, the hybrid reading holds. If CCC gaps wider while gold keeps falling, the panic reading gains ground.
All levels are as of 24 October 2026 and can change quickly.
This article is for informational purposes only and should not be considered financial advice. Investors should conduct their own research and consult with financial professionals before making investment decisions.