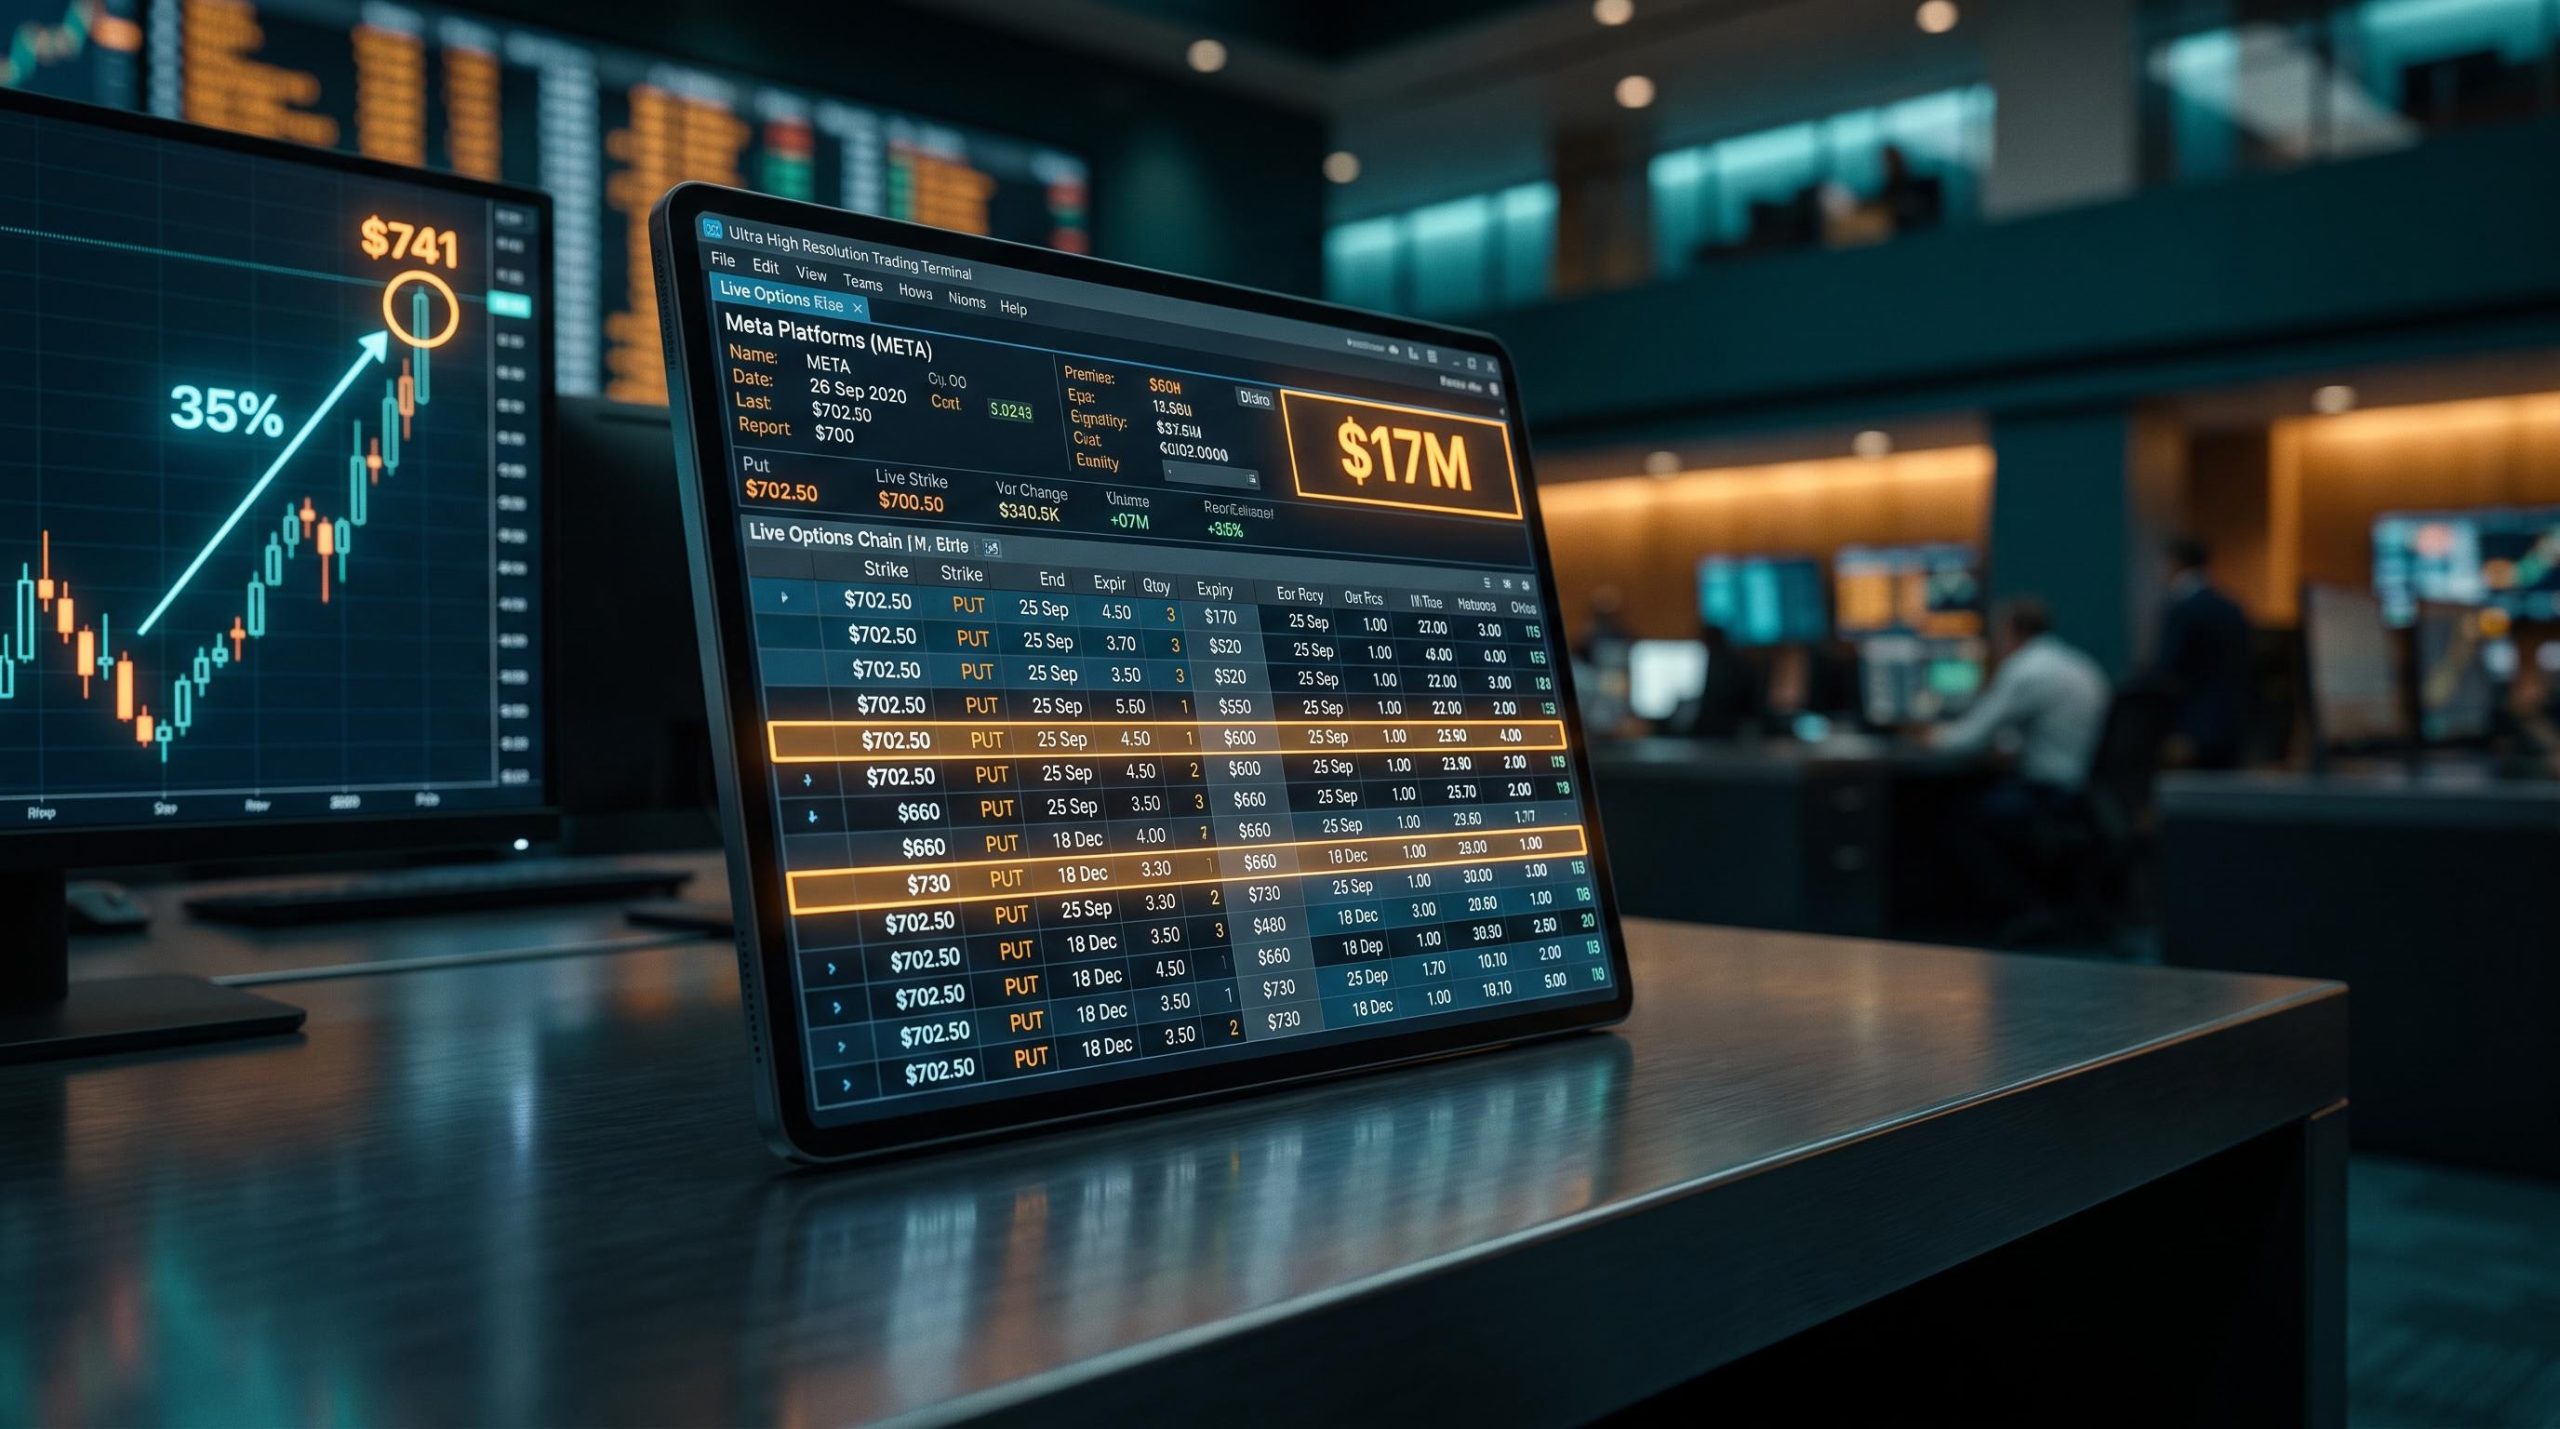
Someone spent roughly $17 million on Meta put options the day before a keynote the market had been anticipating for weeks. That is a large amount of downside protection to buy right before an event everyone expected to be bullish.
The positioning was not one bet. It split into two structurally different strategies with different time horizons: a short-dated trade that expired just two days after the 23 September 2026 keynote, and larger longer-dated positions running to December 2026. One expiry left almost no margin for error. The other left months.
That contrast matters because of the backdrop. Meta shares had rallied roughly 35% over the preceding month on AI optimism tied to its Muse assistant, with Wells Fargo and Jefferies lifting price targets in the 48 hours before Mark Zuckerberg took the stage. Someone bought insurance into that.
This piece is not a prediction of where the stock goes next. It is a framework for reading options flow around high-expectation events: how to tell a hedge from a directional bet, what different put structures actually reveal about institutional sentiment, and what Meta’s specific positioning implied about conviction heading into the keynote.
Two bets or one? Breaking down the three put positions
Start with the trade that expired almost immediately. The September 25 expiry, $702.50 strike put cost roughly $2.43 million in premium and carried a 60% implied volatility. With the keynote landing on 23 September and expiration two days later, this position had no time to breathe.
That is what makes it the cleanest event-driven trade of the three. If the stock did not fall quickly, theta decay (the erosion of an option’s value as expiration approaches) would wipe the position out before the holder could manage it. This was a bet on the keynote itself, and nothing else.
Now compare the longer-dated positions. The largest single trade was a December 18 expiry, $660 strike put costing approximately $10.9 million in premium, carried at 45% implied volatility, with 86 days to expiration. That is a different animal entirely: a thesis with time to develop, tied to earnings, potential legal charges, and a slower reassessment of whether Meta’s valuation holds.
The third position, a December 18 expiry, $730 strike put costing about $3.62 million, is where the fingerprints get interesting. Roughly 90% of its volume printed on the floor, and open interest jumped by around 128% following the order.
The coordination signal: A 128% jump in open interest on the December $730 strike is the marker that separates institutional-scale positioning from spontaneous retail flow. This was a planned, sizeable trade, not a click.
Here is the picture the structures build on their own. A two-day expiry and an 86-day expiry are not stylistic variations. They are two separate theses expressed at once: one about the event, one about a slower-burning bearish case that would need adoption data and regulatory developments to bear out.
| Strike | Expiry | Premium | Implied Volatility | Structural Interpretation |
|---|---|---|---|---|
| $702.50 | 25 Sept 2026 | $2.43M | 60% | Pure event trade; two-day window, no time-decay cushion |
| $660 | 18 Dec 2026 | $10.9M | 45% | Longer-duration bearish thesis on valuation and earnings |
| $730 | 18 Dec 2026 | $3.62M | Not disclosed | Floor-printed, coordinated institutional-scale position |
Separating the short-dated trade from the longer-duration ones is the first step in reading any flow intelligently. Without it, the $17 million headline is just a number.
When big ASX news breaks, our subscribers know first
What does a 35% rally have to do with buying puts?
Downside protection looks strange after a strong run until you look at where the stock was trading relative to what analysts thought it was worth. That gap is the pressure that makes the put positioning intelligible.
Meta jumped roughly 11% on Monday, 21 September 2026 to close at $741, after Wells Fargo raised its target to $796. Over the prior month the stock had climbed around 35%, and it sat approximately 6% below its 52-week high. This was a stock priced for good news.
The bullish analyst camp was loud. Here is how the targets stacked up before the keynote:
- Jefferies (Brent Thill): $875 (raised from $710), calling Muse a potential killer app. Bullish.
- JPMorgan: $820, the highest tracked target. Bullish.
- Citigroup: $800. Bullish.
- Wells Fargo: $796 (raised from $640). Bullish.
- Anachart consensus: $802.86 across 43 analysts. Bullish.
- MarketBeat consensus: $789.63 versus a price of $736.59. Consensus.
- TIKR mean: $758 across 63 analysts. Consensus.
- Goldman Sachs: $725, below the stock’s then-current price. Below market.
Notice the tension. The tightest-consensus data point, the TIKR mean of $758, sat only 2% above the $741 close. TIKR described that as the tightest price-to-target gap in six quarters.
Analyst target dispersion of the kind visible in Meta’s pre-keynote setup, where a TIKR mean of $758 sits 2% above the stock while individual targets range from $725 to $875, carries information about valuation uncertainty that a single consensus figure obscures entirely.
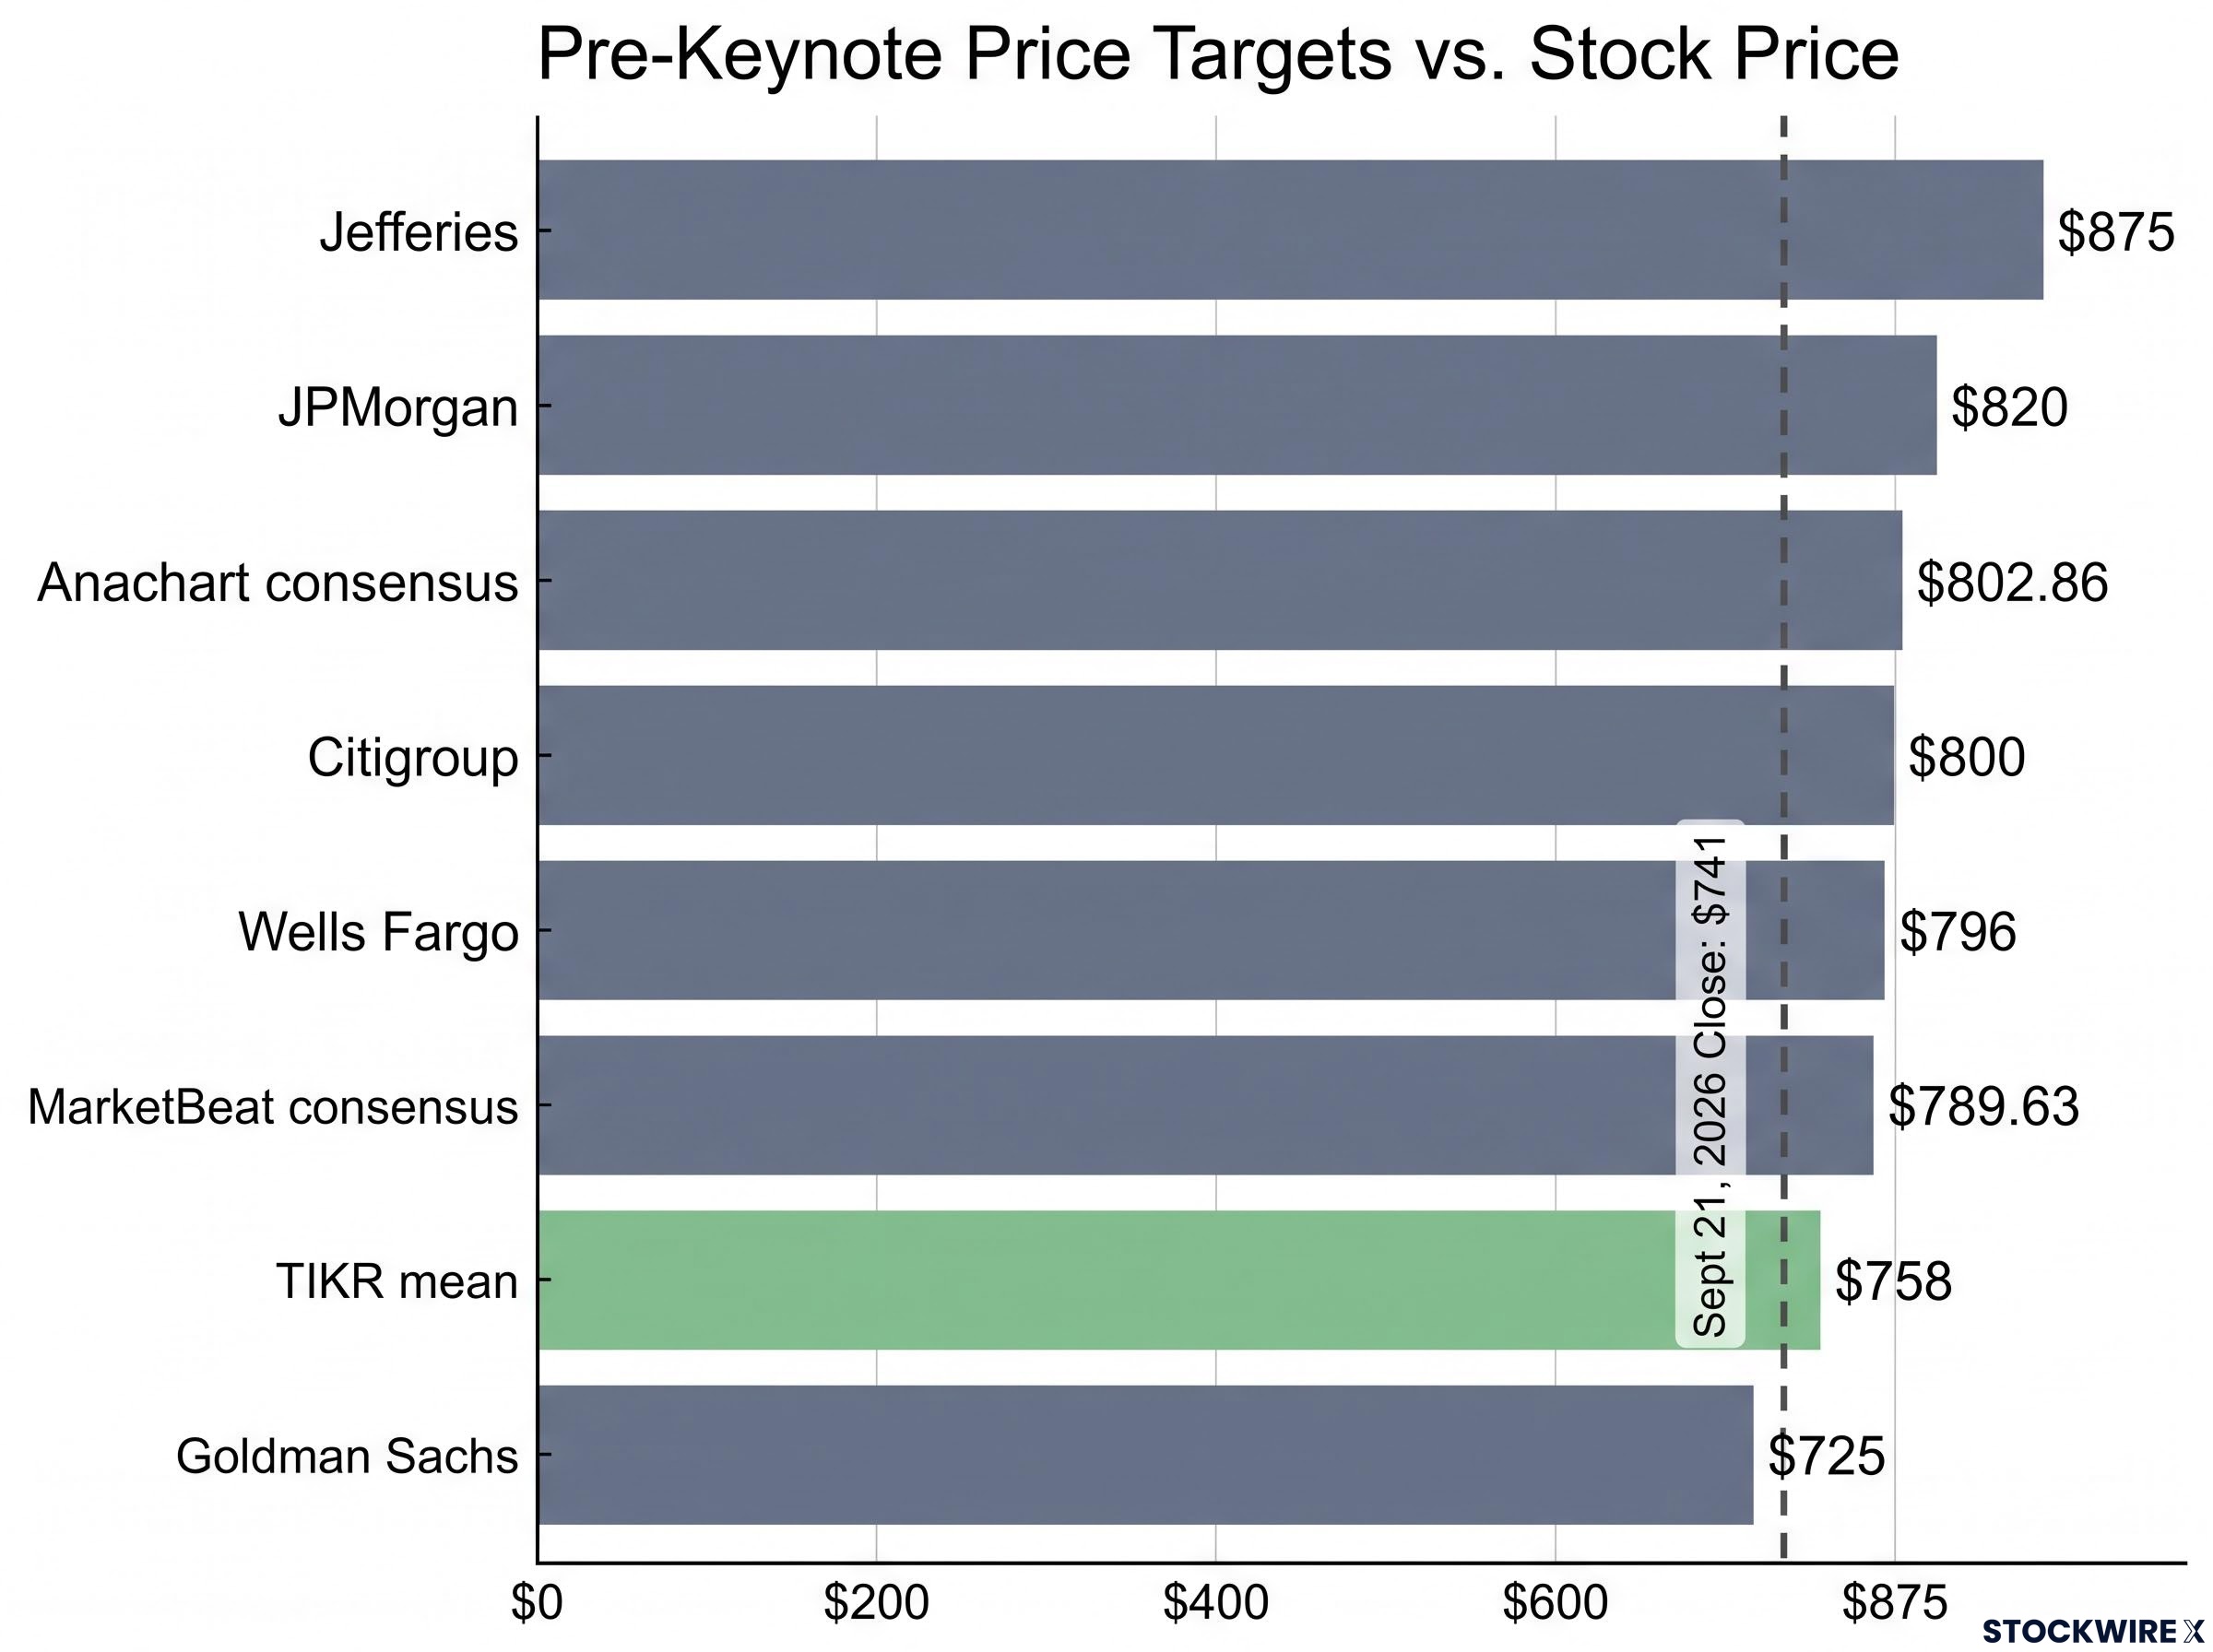
When the most consensus-driven target implies only 2% of upside, the margin of safety for a fresh long position heading into an event is thin. That is precisely what makes buying protection rational rather than contrarian. The bulls could still be right about the long-term story and want insurance on the near-term setup at the same time.
When a price target raise is really a multiple expansion
Wells Fargo’s raise to $796 is worth pulling apart, because how a target moves matters as much as where it lands. The firm noted it lifted the number by expanding Meta’s earnings multiple from 20x to 25x projected 2027 earnings, with no upward revision to revenue estimates.
There are two ways to raise a price target. One is to revise revenue or earnings forecasts upward because you now expect the business to perform better. The other is to keep your forecasts unchanged but apply a higher multiple to them, meaning you are simply willing to pay more for the same expected earnings.
The second kind is the one to watch. A target built on multiple expansion rests on sentiment, not improved fundamentals, which makes it far more sensitive to a mood reversal. If the keynote disappointed, the sentiment that justified 25x could compress quickly, and the target with it.
That is the valuation picture that converts the put activity from a curiosity into a legible signal. Read without it, the $17 million looks bearish. Read with it, the same positions look equally like prudent asymmetry management by investors who like the story but respect the setup.
Why institutions buy puts before big events (and why it does not always mean what you think)
The instinct most retail investors carry is simple: a large put buy is a bearish signal. Someone with deep pockets is betting the stock falls. It is an intuitive read, and it is often wrong.
Large institutions buy pre-event puts for at least four structurally distinct reasons, and only one of them is a directional bet on the price falling:
- Portfolio hedging after a sharp rally. Derivatives desks at firms such as Goldman Sachs and Morgan Stanley routinely note that large asset managers buy short-dated, out-of-the-money puts around known catalysts to protect concentrated long positions. After a 35% run, that downside protection feels cheap relative to the gains at risk.
- Implied-volatility trading. Cboe’s own risk-management material explains that demand for options ahead of events pushes implied volatility higher, and many institutional trades are built to profit from the collapse in that volatility after the event, not from the direction of the move.
- Skew and tail-risk protection. Options desks pay up for puts to guard against low-probability disasters: an unexpected setback, a regulatory surprise, an execution stumble revealed on stage.
- Buy-the-rumour, sell-the-news event hedging. In mega-cap tech, strategists frequently describe pre-keynote put buying as insurance against expectations that have run ahead of what management can deliver.
Now the 60% implied volatility on the short-dated put makes sense. That number does not mean the market expected a sell-off. It means the market was pricing a large move in either direction and was willing to pay for it.
The 60% implied volatility on the short-dated put is not a directional forecast; implied volatility measures the market’s collective expectation of movement magnitude, extracted by reverse-engineering live option prices, and a reading that elevated signals the market was pricing a large post-keynote swing in either direction.
What high short-dated IV actually tells you: Elevated implied volatility above 60% means the market expects a big move and is paying for convexity. It is a statement about magnitude, not direction.
The competing interpretation deserves a fair hearing. Some options-flow services argue that aggressive single-leg put buys executed in size do reflect a genuine bearish view from informed money, and there are documented cases where outsized put buying preceded bad news. That camp is not baseless.
The problem is what the public data cannot show. Options flow reveals the legs of a trade, but not whether a position is being opened or closed, and not the offsetting positions in stock, futures, or other options that complete the strategy.
An academic review of informed options trading before corporate events published in the Annual Review of Financial Economics synthesises the literature on abnormal options activity ahead of earnings announcements and other catalysts, finding that distinguishing directional speculation from hedging in public flow data remains an unresolved challenge even under controlled research conditions.
So the same $2.43 million short-dated put could be a bearish directional bet, a hedge shielding a large long position, or a volatility trade built to profit from IV compression after the keynote. The public data does not tell you which. That is the honest limit of reading flow as signal.
What history says about pre-event put positioning in mega-cap tech
History does not hand out a tidy rule, but three precedents sharpen the interpretive limits and each adds a distinct dimension:
- Apple, iPhone launches. Across multiple flagship unveilings, coverage from outlets including Bloomberg and Reuters documented heavy options volume and elevated short-dated implied volatility going in. In several cases the stock sold off after the keynote despite strong products, as investors took profits on a pre-event run. The realised move was decoupled from the news itself.
- Nvidia, 2023 earnings. Record call volume and very high implied volatility preceded a blowout AI-driven result, and the stock rallied sharply afterward. The flow was a genuine signal, but it reflected publicly available AI demand data and momentum, not hidden institutional knowledge.
- Meta’s own prior quarters. Large put blocks ahead of earnings in previous periods did not precede major sell-offs. Post-mortems by options strategists attributed them to index-hedging, risk-parity rebalancing, and volatility-arbitrage strategies.
Each case pulls in a different direction, which is the point. Apple shows flow can mislead on direction, Nvidia shows it can be right for public reasons, and Meta’s history shows it can simply be noise dressed as signal.
The common thread across all three cases
The single lesson that cuts across all three is that options flow signals the degree of market tension around an event, not its resolution. It measures how nervous the market is, not which way it breaks.
Apply that to Meta Connect 2026. The $17 million in puts tells you the market treated this keynote as a genuine risk event after a sharp rally. That combination, a steep pre-event run paired with large put positioning, is a reliable indicator of fragility in the setup, even when the eventual move turns out to be positive. The information is real regardless of where the stock landed.
What the put positioning actually tells you about Meta right now
Two coherent reads of the combined positioning survive the analysis, and rather than pick one, the more useful exercise is to specify what would validate each.
The first read is sophisticated hedging by long-side institutions. They stay constructive on Meta’s AI narrative but want insurance after a 35% rally into a known catalyst. The puts are a cost of holding, not a vote against the story.
The second read is a genuine bearish thesis expressed across two horizons. The short-dated put targets the event; the December 18, 2026 puts wait for adoption-curve data on Muse, regulatory developments, and Q3 earnings to bear out a downside case. December holders have time on their side.
Goldman Sachs’s $725 target sits as the floor anchor here, the only major-bank target below the stock’s pre-keynote price. It represents the most conservative institutional view of what Meta’s current earnings base actually supports.
Reading options signals in AI stocks requires separating implied volatility rank from directional bias, a distinction that becomes critical when a name like Meta has run 35% into a known catalyst and the IV reading reflects event-pricing rather than a collective bearish view.
Here are the variables that would tip the balance one way or the other:
- Muse adoption metrics. Bullish: rapid, sustained user growth with retention. Bearish: usage that spikes then fades or fails to monetise.
- Q3 earnings guidance. Bullish: revenue and margin outlook that justifies the re-rated multiple. Bearish: guidance that leans on sentiment rather than numbers.
- Regulatory headlines. Bullish: quiet quarters on privacy and antitrust. Bearish: fresh scrutiny or charges that cap margin expansion.
For anyone weighing a position after the keynote, the put activity does not tell you to buy or sell. It tells you the institutional community treated the risk around this event as real and worth paying for. That is a reason to build any post-keynote thesis with genuine attention to downside scenarios rather than assuming the rally rolls on without friction.
Reading event-risk positioning without overreading it
The core tension does not resolve, and pretending otherwise would be dishonest. The same positioning that looks bearish in isolation is entirely consistent with rational hedging by bulls, and the public data cannot settle the question.
The durable takeaway is structural, not Meta-specific. In any high-expectation event cycle where a mega-cap has run 30% or more into a catalyst, pre-event put activity of this scale and structure is a signal worth monitoring. It is not a trade to mirror.
Used responsibly, options-flow data works best as one input among three:
Reading an options chain for sentiment requires combining IV rank, skew, expected-move brackets, and the call-to-put premium ratio rather than reacting to any single data point, which is why the $17 million headline, stripped of structure and expiry context, carries almost no predictive weight on its own.
- Consensus proximity. How close is the stock to the average analyst target? Meta’s TIKR mean sitting 2% above the close, the tightest gap in six quarters, told you the upside was already largely priced.
- Implied move. What is the market pricing for the event? The 60% short-dated implied volatility told you to expect a large move, without telling you the direction.
- Post-event IV behaviour. Does implied volatility collapse or hold afterward? The December puts did not expire at the keynote, so their IV behaviour in the weeks ahead will reveal whether the positioning was unwound or maintained, which is itself further signal.
Read together, these three inputs turn a headline number into context. Read in isolation, any one of them can mislead.
The core principle: Options flow signals the degree of market tension around an event, not its direction. Using it well means asking what the positioning is consistent with, not what it proves.
This article is for informational purposes only and should not be considered financial advice. Investors should conduct their own research and consult with financial professionals before making investment decisions. Past performance does not guarantee future results, and any forward-looking interpretations are speculative and subject to change based on market developments.