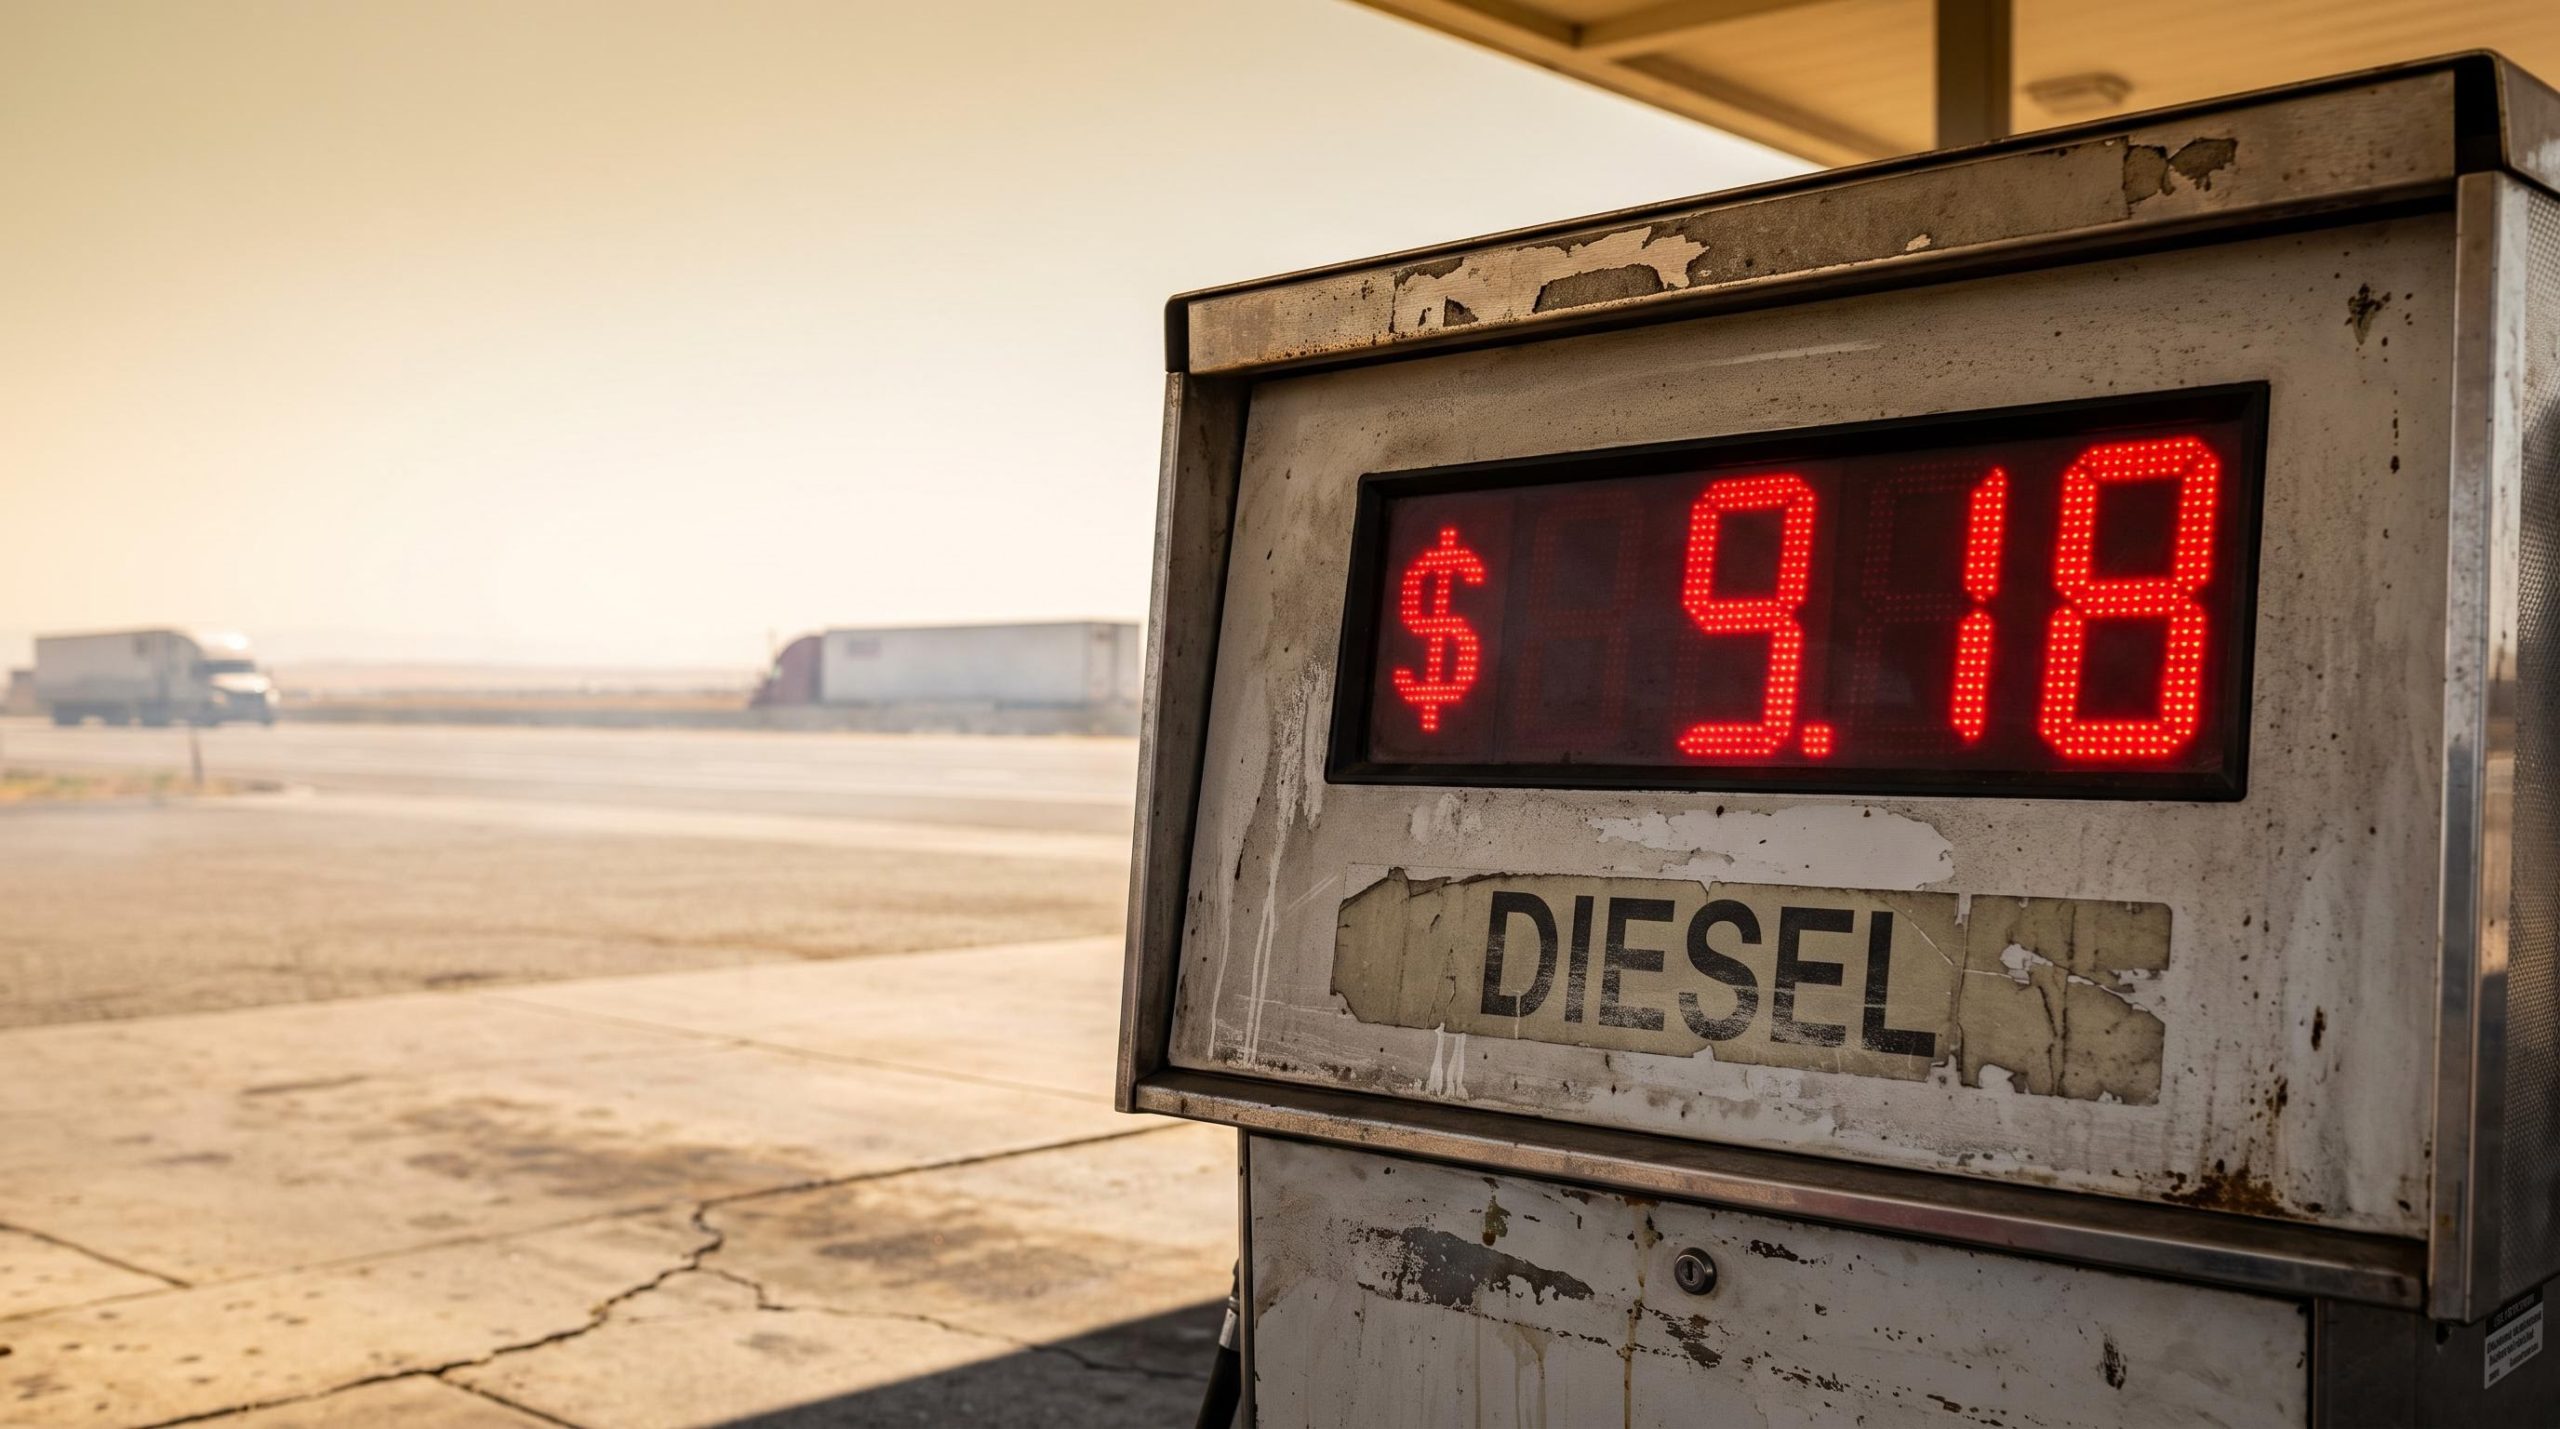
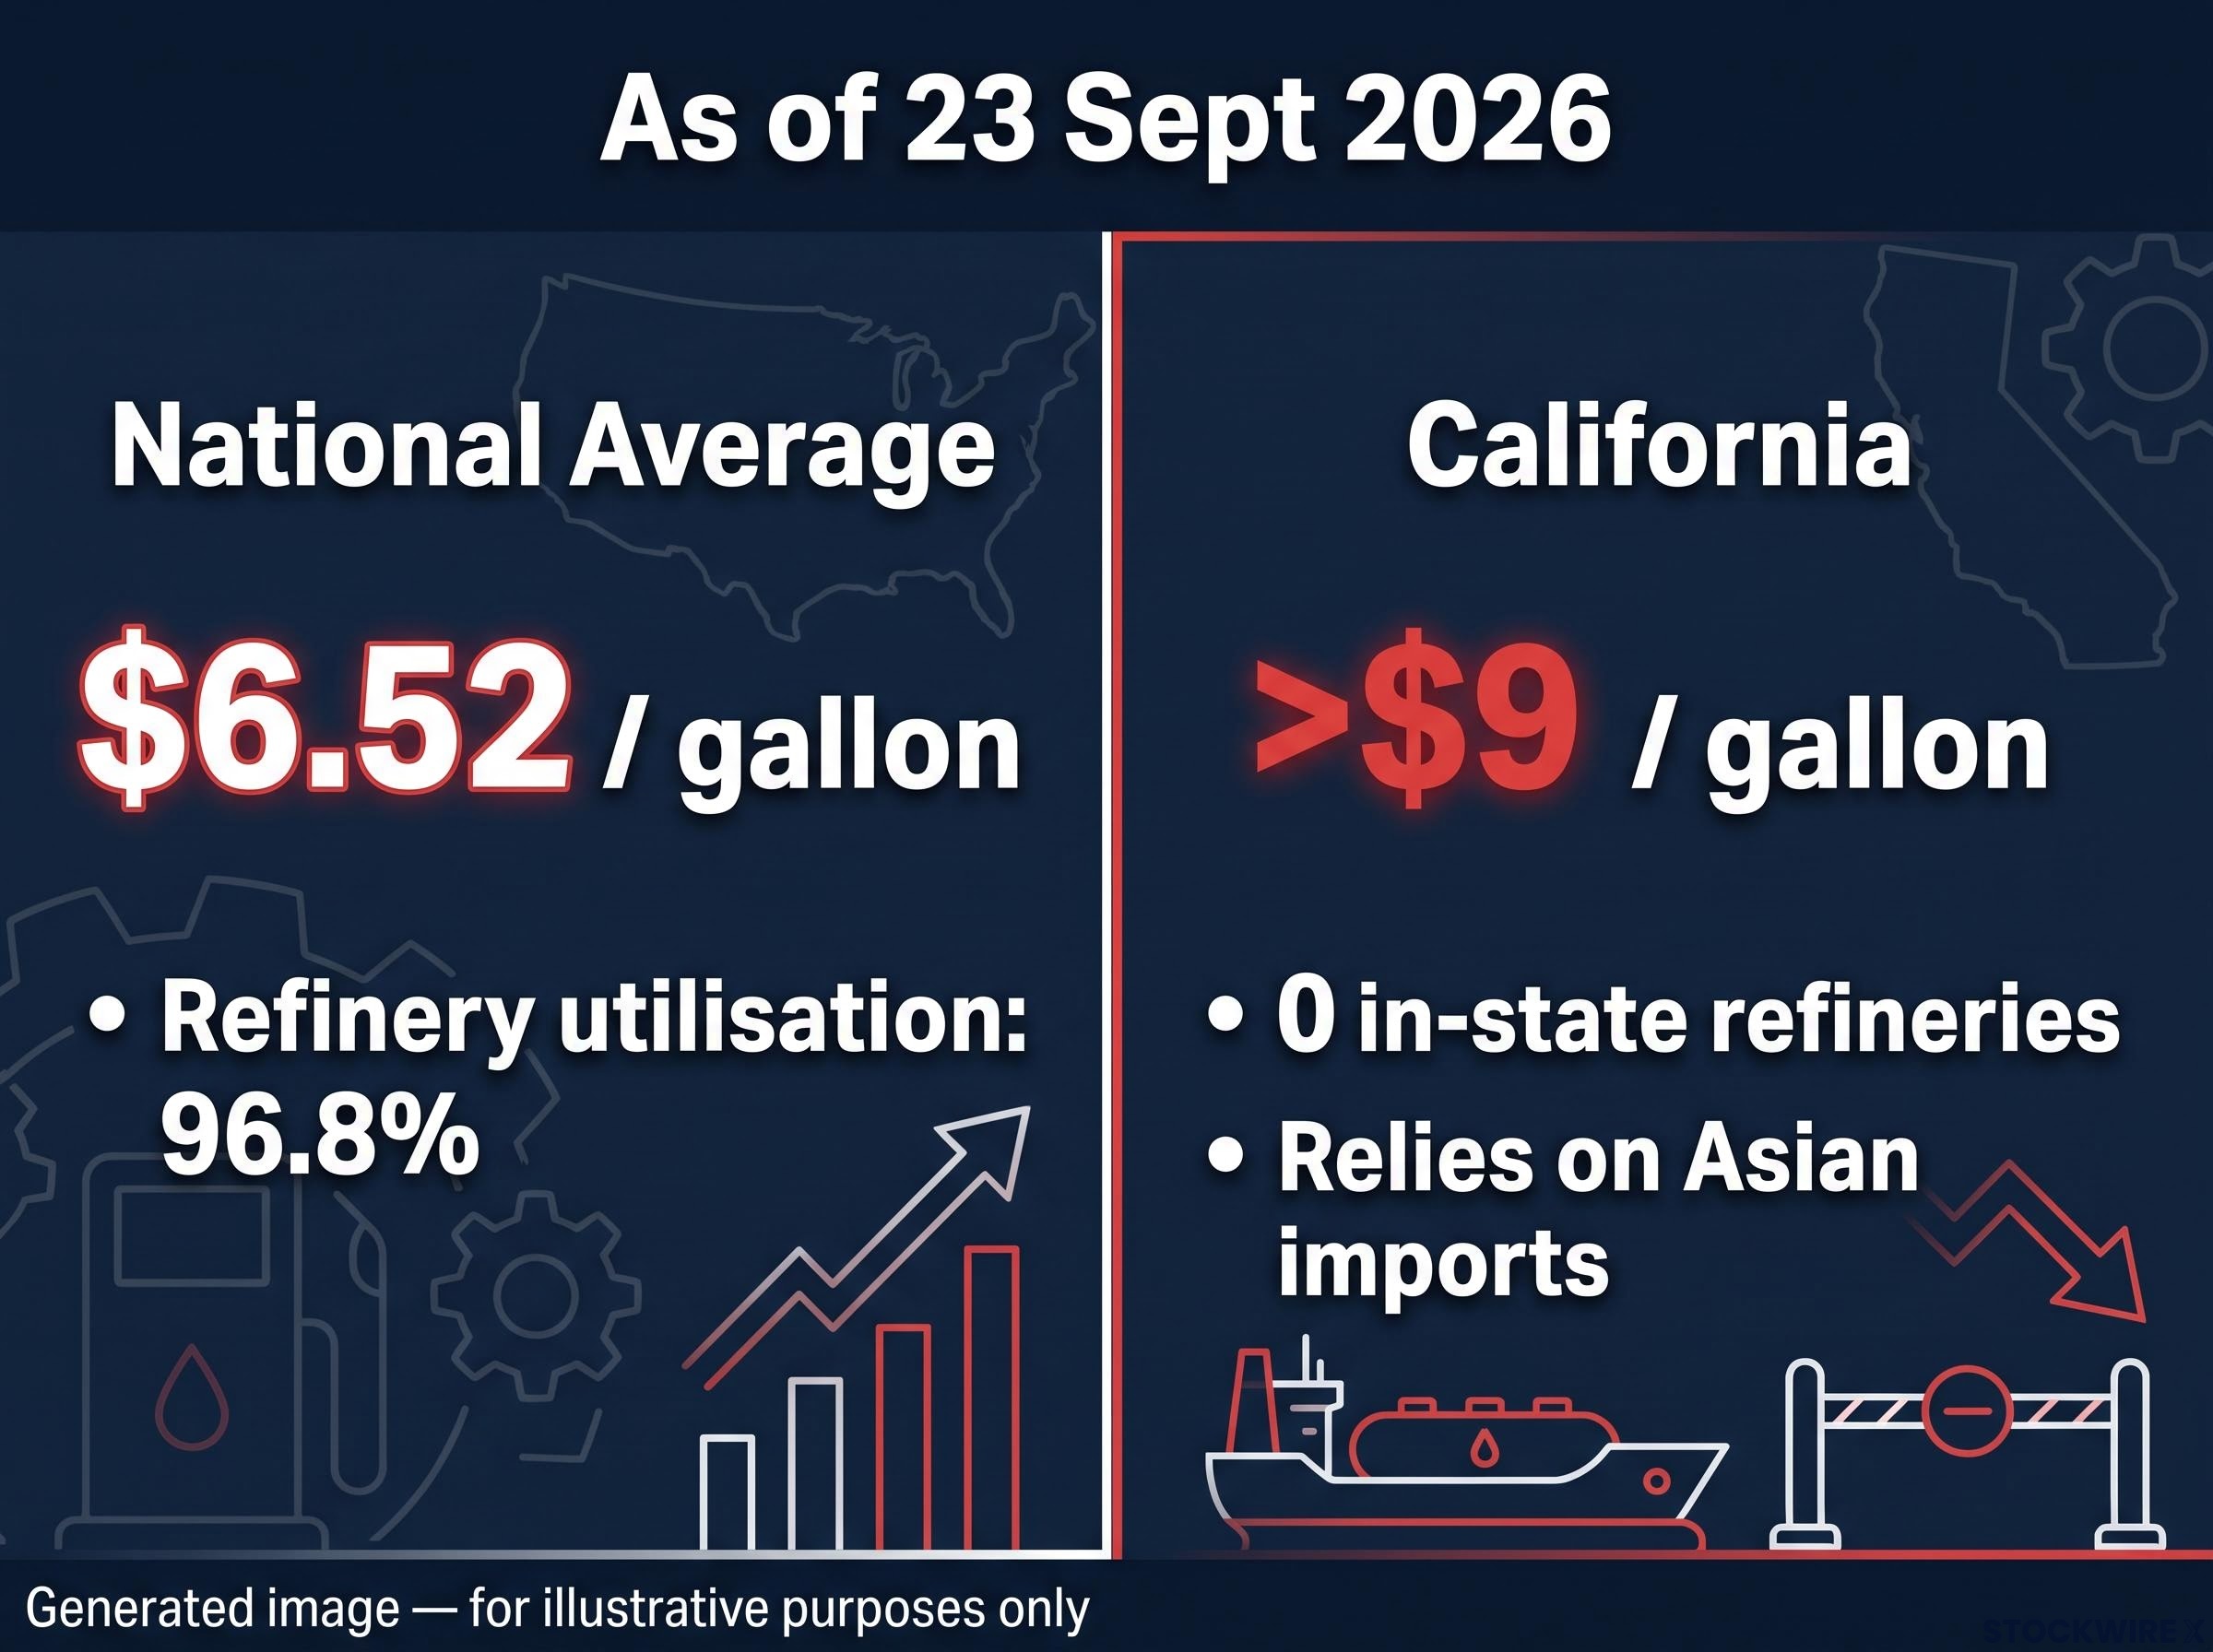
The national average diesel price in the United States sits at $6.52 per gallon as of 23 September 2026, according to AAA data reported by Reuters. In California, drivers are paying above $9 per gallon. That is not a gas station problem. It is a logistics tax landing on nearly every product that moves by truck, rail, or ship across the country.
US diesel prices have surged 76% over the past year, and this is not a simple crude oil story. US refineries are running at 96.8% of capacity, meaning there is almost no slack left in the system to absorb a demand shock.
On top of that physical squeeze, a political debate over banning diesel exports is adding a fresh layer of uncertainty. Here is what is actually driving the price, why the proposed fix could make things worse, and what signals to watch as the policy question resolves.
What $6.52 a gallon actually means, and why California is a warning
The $6.52 national average is close to a record. But the number that should worry the rest of the country sits on the West Coast, where California diesel has pushed above $9 per gallon, both figures drawn from AAA data as of 23 September 2026.
California is not simply unlucky. The state has closed its last two refineries and now leans heavily on fuel imported from Asia. When global supply tightens, California has no domestic buffer to cushion the blow, so the shock passes straight through to the pump.
That is the structural lesson. Inland markets with nearby refining capacity can absorb some of a global squeeze. A state that has removed its own refining infrastructure loses that ability entirely, and its consumers feel the full force of every disruption.
Here is how the two situations differ:
California’s structural factors
- No in-state refining after the closure of its last two refineries
- Reliance on diesel imported from Asian markets
- No domestic buffer against global supply tightness
National factors
- Refinery utilisation running near full capacity
- Broad global supply tightness in distillate markets
- Little slack anywhere in the system to absorb demand shocks
The current national figure also carries historical weight. CNN reports that diesel is now just pennies away from its highest inflation-adjusted price since 2008, placing the surge alongside the energy shocks that have historically driven broad inflation through transport, food, and manufacturing.
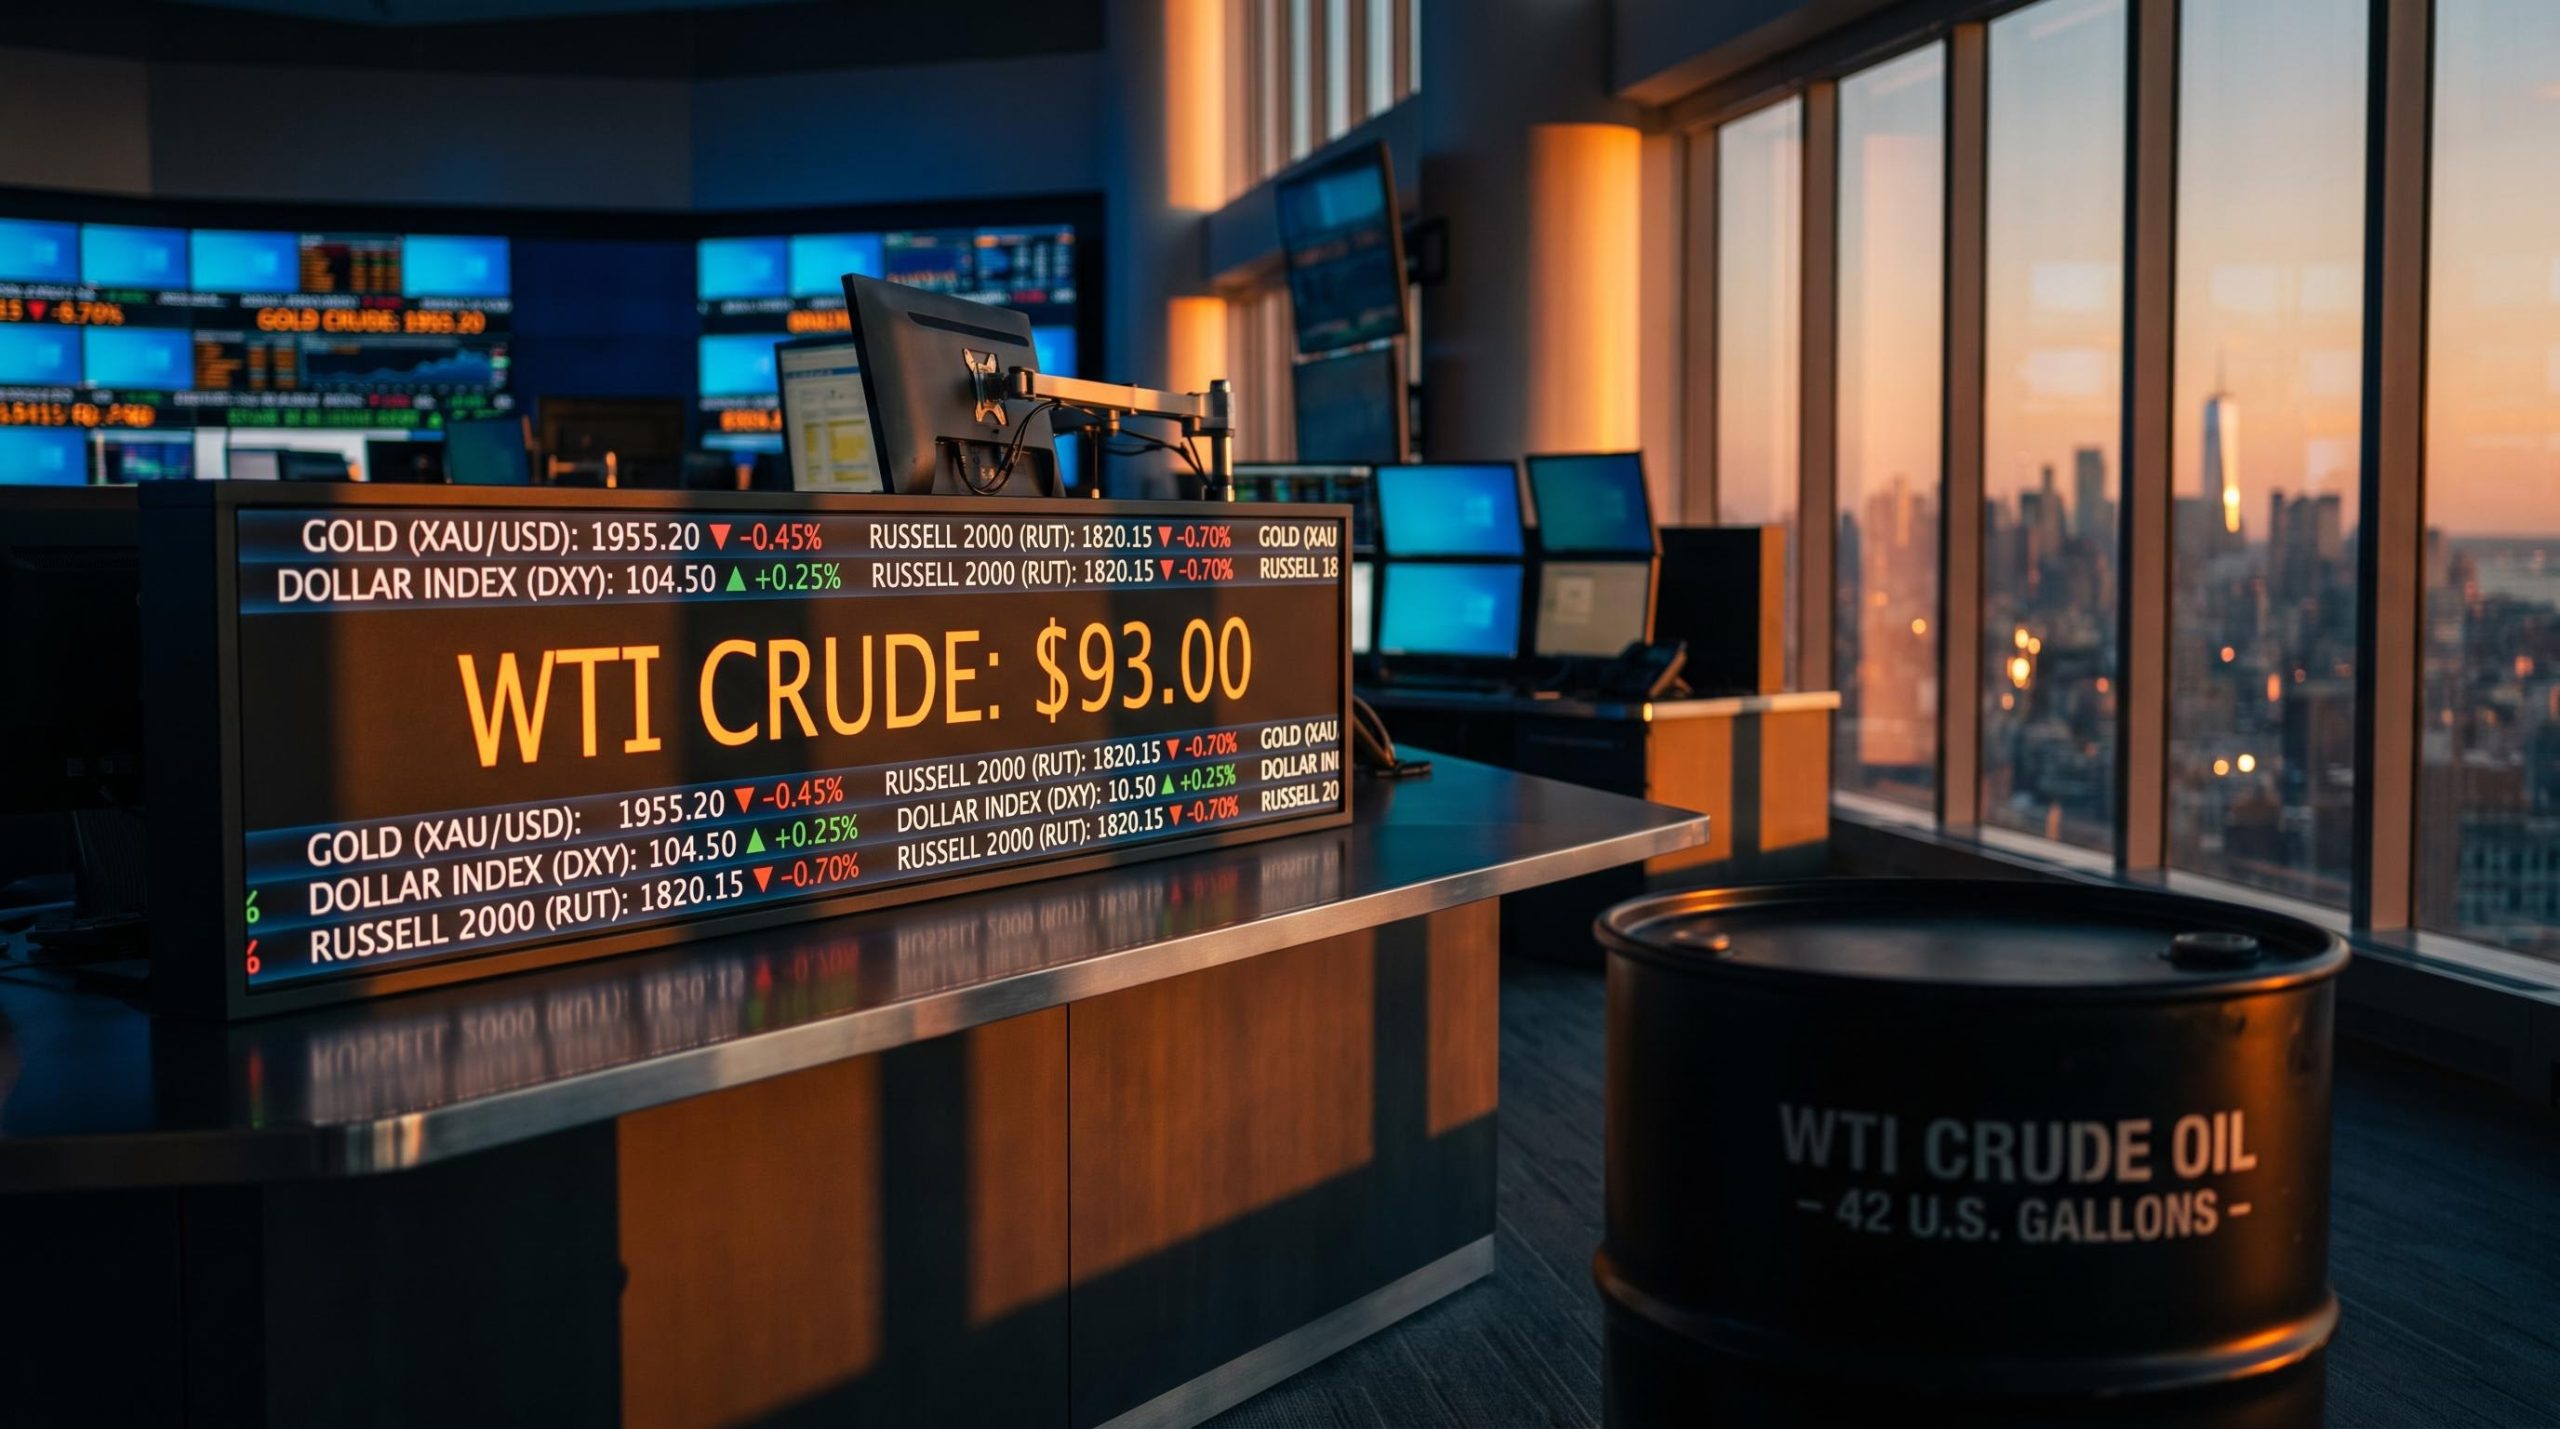
The diesel futures divergence from crude in mid-July 2026 was the first clean market signal that physical delivery stress in refined products was materialising independently of aggregate global supply, with US diesel futures surging approximately 20% in a single week while WTI held near $79.
This is the largest annual increase since AAA began tracking diesel in 2000.
CNN frames the move as an 83% year-to-date rise, a related figure calculated from a different baseline than the 76% year-over-year number. The dates differ, so the two are not in conflict; both point to the same reality of an extraordinary run in a short window. For you, the read is simple: California shows what happens when physical supply buffers vanish, and the national number shows the whole system is now uncomfortably close to that edge.
When big ASX news breaks, our subscribers know first
How refineries actually work, and why the system has no room to breathe
The intuitive assumption is that refiners could just make more diesel if prices are this high. The economics do not allow it, and understanding why is the key to everything that follows.
Each barrel of crude oil that enters a refinery comes out as a fixed slate of products at once: diesel, gasoline, jet fuel, and others. A refiner cannot dial up diesel output on its own without changing the whole mix, because the yield is a physical property of the process, not a setting on a dial.
So the only way to make substantially more diesel is to run more crude through the system overall. That is where the second constraint bites.
What the numbers show about system slack
For the week ending 11 September 2026, EIA data reported via Rigzone and YCharts put US refinery utilisation at 96.8%. Refineries were processing 17.3 million barrels per day, running at what amounts to full operational capacity.
A system at 96.8% has almost nothing left to give. There is no reserve to switch on when demand rises, which means any additional pressure feeds straight into price rather than into extra supply.
| Metric | Historical norm | Current level |
|---|---|---|
| Refinery utilisation | ~85-90% | 96.8% |
| Diesel crack spread | ~$20/barrel | ~$80-$100/barrel |
What crack spreads signal about the current market
A crack spread is the dollar difference between what a refiner pays for crude and what it sells finished diesel for. It measures the refining layer’s own profit, separate from the price of oil itself.
The historical norm sits around $20 per barrel. The Fact-Checked Original Source reports the current spread at roughly $80 to $100 per barrel above crude. Reuters coverage from 10 July 2026 captured the same dynamic, with US ultra-low sulphur diesel futures at $154 per barrel, an $80 premium to WTI crude.
That gap between $20 and $80 to $100 tells you the market is paying refiners a crisis premium. The inflation pressure in diesel is not coming from crude alone. A significant chunk is being generated in the refining layer itself, which is exactly what you would expect from a system with no room to breathe.
The diesel crack spread has crossed $100 per barrel for the first time on record, more than doubling since the US-Iran conflict escalated and sitting at four to six times the historical norm of $15-$40 per barrel, a structural break that confirms the inflation pressure in diesel is not a crude oil story.
Why banning diesel exports is harder than it sounds
Keeping American diesel in America sounds like an obvious fix. The physical mechanics of how refineries work turn that intuition into a trap, and the disagreement inside the administration shows how real the tension is.
President Donald Trump, speaking from the United Nations on 22 September 2026, said he backed a diesel export ban and had raised it with his team. Treasury Secretary Scott Bessent said the administration is examining whether a ban, full or partial, is feasible. Energy Secretary Chris Wright went the other way entirely.
The three positions break down cleanly:
- Trump: backs a diesel export ban
- Bessent: examining feasibility of full or partial curbs
- Wright: warns a ban would not work, prefers voluntary measures with refiners
Energy Secretary Chris Wright warned that a ban “would not work” and could push up gasoline and jet fuel prices, adding that “no decisions have been made.”
Wright’s objection is the mechanical one. Because a barrel of crude yields all products at once, stranding diesel does not leave the rest untouched. If refiners lose export markets, domestic storage fills quickly, and the only response is to cut total runs, which drops gasoline and jet fuel output alongside diesel. You would trade a diesel shortage for a multi-fuel shortage.
Then there is the global feedthrough. Energy economist Philip Verleger, cited by Reuters, argues the effect could travel far and fast because diesel demand barely responds to price.
Philip Verleger estimates a US export ban could raise world diesel prices by as much as 100%, given diesel’s low price elasticity of demand.
Russia’s 2026 diesel export ban is the live precedent. When Moscow halted exports, US ultra-low sulphur diesel futures jumped roughly 11-12% in a single day to about $154.71 per barrel, with wholesale price rises of more than 40 cents per gallon anticipated. That happened even though the US does not import Russian diesel, because export restrictions in one region reverberate through interconnected global product markets almost immediately.
That is the read you should take. The idea of keeping diesel at home through a ban cannot be assumed to lower domestic prices, because global markets price the tightness regardless of where the barrels physically sit.
How unresolved is all this? The Kalshi prediction market put the probability of a ban before the 3 November midterms at 43%, a figure that swung between 28% and nearly 80% within a single hour. This is a genuine policy question with no clean answer, not a failure of political will.
Diesel as a stealth inflation tax on everything you buy
You do not need to own a diesel vehicle for this crisis to reach into your budget. Diesel is the fuel that moves the physical economy, and that is what makes it a stealth tax on nearly everything you buy.
CNN describes diesel as the economy’s “workhorse fuel,” powering trucks, trains, ships, and farm equipment. It accounts for the fuel source in roughly 86% or more of all US commercial trucking, which means almost every physical good relies on diesel at some point on its route to the shelf.
Here is how a higher pump price becomes a higher shelf price:
- Diesel prices rise across the freight network
- Carriers apply fuel surcharges to shipping contracts
- Input costs climb for food producers, manufacturers, and construction
- Retail prices increase to cover the added cost
- Independent operators without pricing power absorb the loss directly, compressing margins or exiting the market
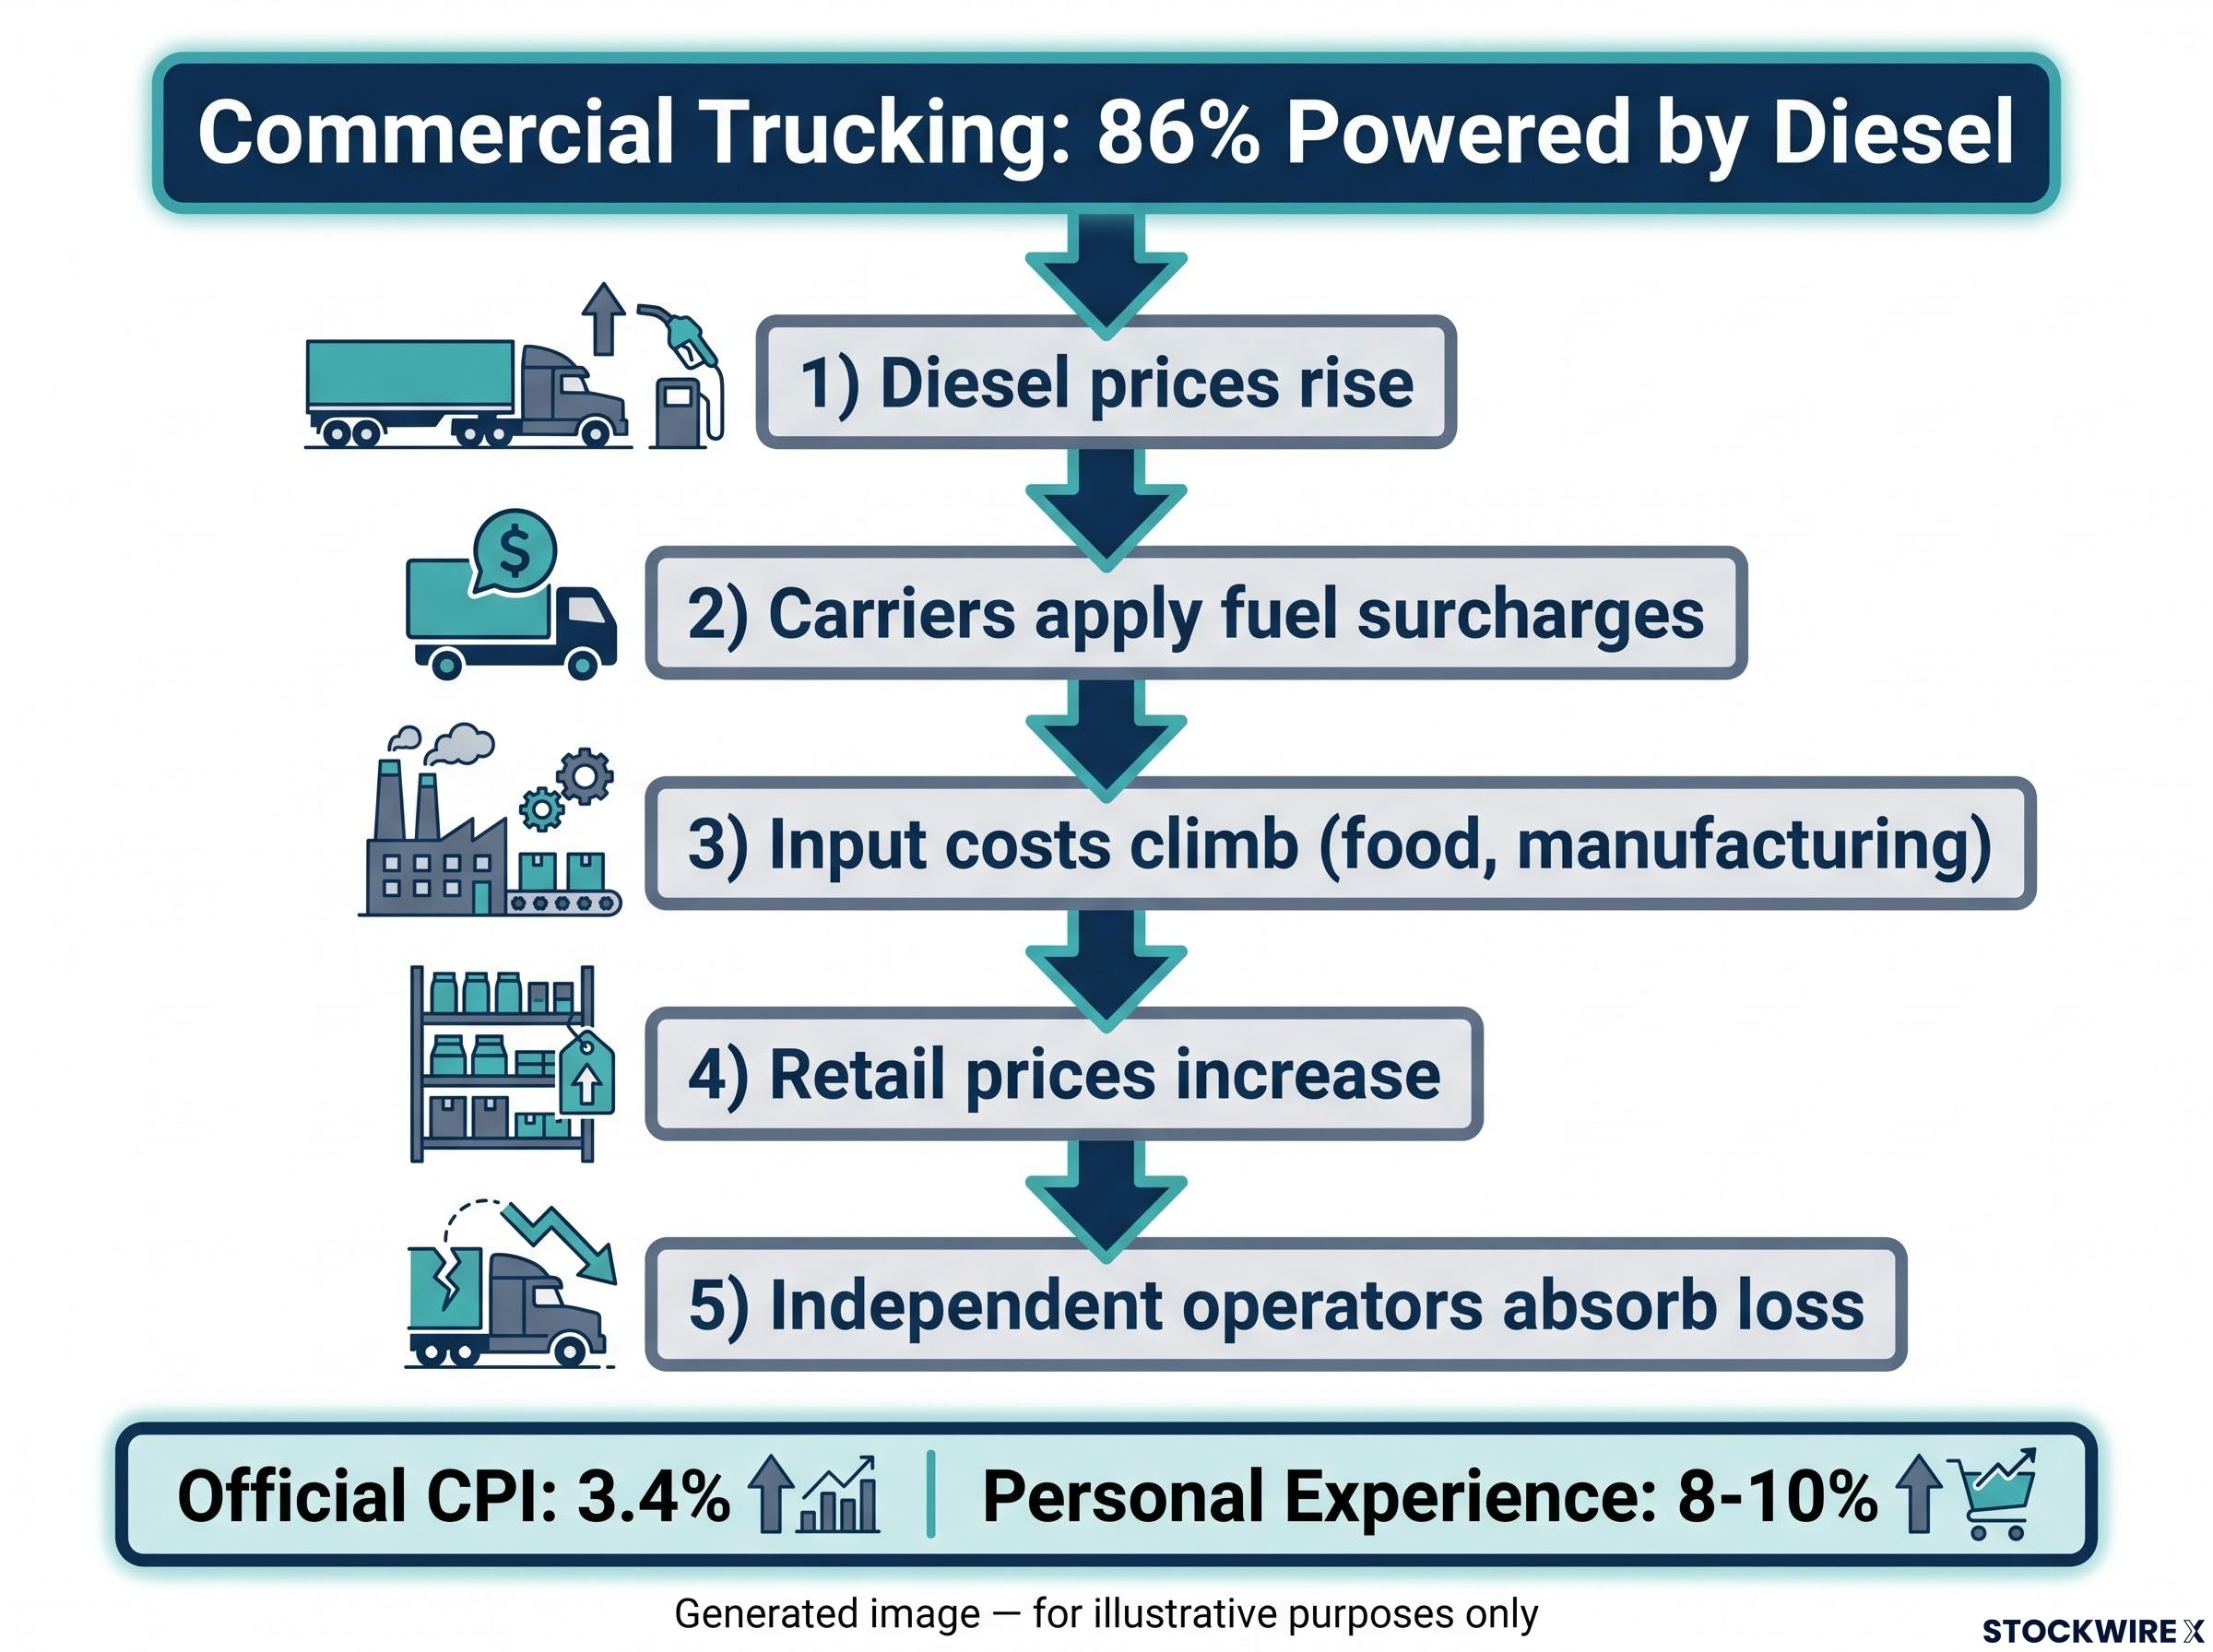
That last step matters. Airlines, railroads, and larger trucking firms can pass elevated costs through surcharges embedded in their contracts. Independent truckers cannot, so the burden lands asymmetrically, with the smallest operators taking the hit.
| Sector | How diesel costs transmit | Who bears the cost |
|---|---|---|
| Commercial trucking | Freight surcharges | Shippers and consumers |
| Independent truckers | Direct margin erosion | Operators |
| Airlines | Fuel surcharges | Passengers |
| Agriculture | Operating cost increases | Food prices and farmers |
| Heating oil users | Direct price exposure | Households |
Economist William Lee, quoted in NDTV Profit, argues that crack spreads are a more important inflation signal for consumers than crude prices, because they reflect what refiners actually charge. He warns that diesel in the $6 to $10 per gallon range adds substantial inflationary pressure given the fuel’s central role.
This is where the gap between official and felt inflation opens up.
Official CPI sits at approximately 3.4%, but Joseph Schachter of Schachter Energy Research Services estimates most individuals’ personal inflation experience is closer to 8-10% once real-world costs like fuel, food, and property are counted.
That gap is where diesel’s damage to your budget actually lives. What you feel at the grocery store and in delivery fees is a direct downstream consequence of this fuel crisis. And with winter heating oil demand about to compete for the same distillate supply, that pressure has room to build into the next quarter.
Official CPI undercounting of war-driven energy costs is a structural feature of how the index classifies fuel embedded in imported goods and airfares, meaning what looks like demand-driven price pressure in core categories is partly war-driven cost pass-through that the Dallas Fed estimates has raised headline PCE by approximately 0.6 percentage points above a no-war baseline.
What to watch as the policy debate moves toward resolution
The policy outcome is too uncertain to use as a price signal on its own. What you can do is watch the three variables that will decide whether diesel eases or worsens over the next 60 to 90 days.
The three to monitor:
- The policy outcome: a full ban, an export quota, or the voluntary cooperative measures Wright prefers
- EIA weekly refinery data: utilisation and inventory levels released every week
- Winter heating oil demand: the next major seasonal draw on distillate supply
Of these, the EIA weekly data is the most reliable leading indicator. Because the policy debate swings so wildly, the utilisation and inventory numbers are your clearest read on whether physical conditions are genuinely improving.
EIA inventory data released weekly is the clearest leading indicator available because it captures the split between a loose crude market and a tight products market in real time, a divergence that crack spread watchers use to assess whether relief is genuinely building or whether the headline crude number is masking continued distillate stress.
A quota, if chosen, is not a soft version of a ban. It carries its own risks: operational disruption as refiners reconfigure crude slates and reroute products, a chilling effect on investment in new capacity, and global feedthrough as international buyers scramble for alternative supply. Reuters identifies Brazil and the UK as the export markets most immediately exposed if US diesel is restricted.
Wright’s preference for voluntary, cooperative measures with refiners is the administration’s current baseline posture.
Chris Wright has framed voluntary cooperation with refiners as the alternative to “blunt instruments that would reduce refining throughput.”
A voluntary outcome would likely leave the physical constraints intact, meaning any relief would depend on utilisation easing and demand cooling rather than on policy. With the Kalshi range swinging from 28% to 80% in an hour, the safest approach is to track the physical data and treat the politics as noise until it settles.
A fuel crisis without an easy exit
Three constraints are locked together here, and none of them resolves quickly. Refineries are running at 96.8% capacity with no way to add supply in the short term. The policy debate offers no option without significant trade-offs. And winter heating oil demand will arrive on schedule regardless of what Washington decides.
California is the warning the rest of the country should read. When refining infrastructure is not maintained, price buffers disappear, and consumers absorb the full force of every global shock.
The lived cost is already running ahead of the official record. Schachter’s 8-10% personal inflation estimate against a 3.4% headline CPI captures where the real burden sits, and with a Kalshi export ban probability of 43%, the policy path remains genuinely open. Understanding the mechanism is how you anticipate where freight costs, food prices, and energy-sensitive positions are likely to move next quarter, whichever route the debate takes.
This article is for informational purposes only and should not be considered financial advice. Investors should conduct their own research and consult with financial professionals before making investment decisions. Financial projections are subject to market conditions and various risk factors, and forward-looking statements are speculative and subject to change based on market developments.