
How Hormuz Closure at $104 Oil Is Reshaping Every Asset Class
7 hrs ago

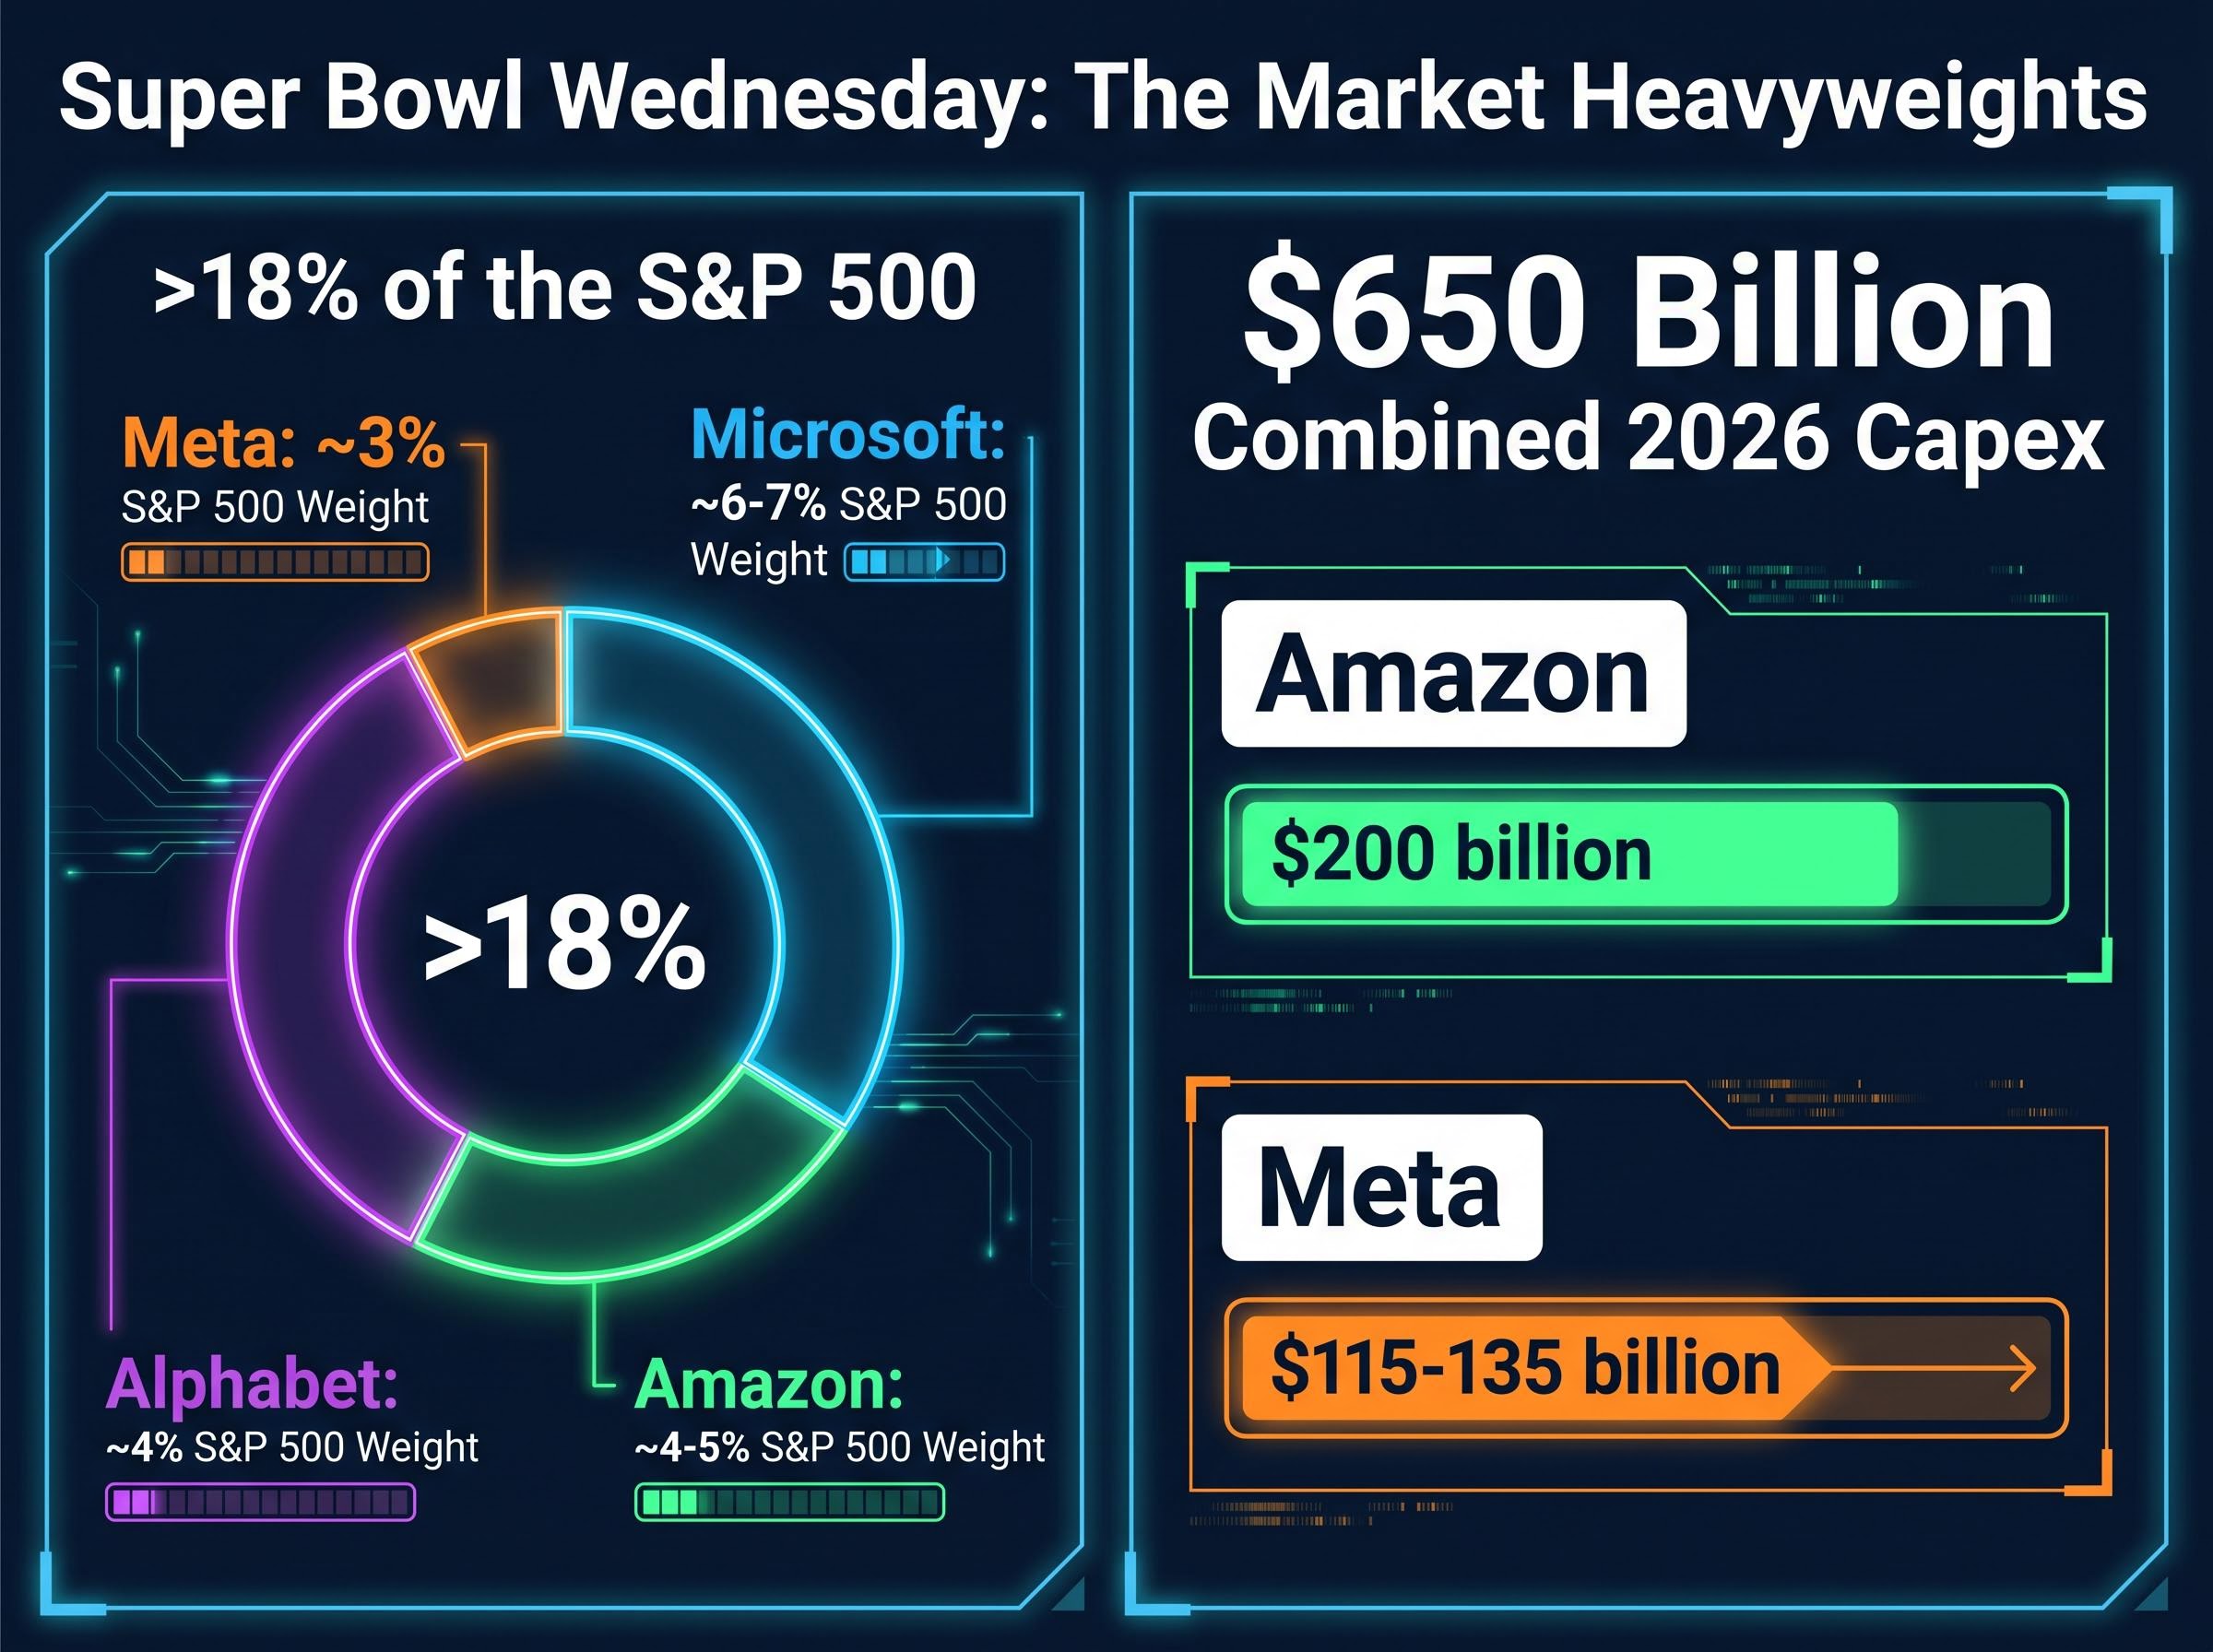
“`json { “fact_checked_full_article”: “One day. Four companies. More than 18% of the S&P 500 by index weighting, all reporting after the bell on April 29, 2026. Wall Street has started calling it \”Super Bowl Wednesday,\” and the label is not hyperbole. Microsoft, Alphabet, Meta, and Amazon will cross the tape on the same afternoon against a backdrop of record index highs, a rotation-driven anxiety cycle that only recently broke, and $650 billion in combined 2026 capital expenditure commitments that investors are still processing. The stakes for broader market direction have rarely been this concentrated in a single session. What follows is an analysis of why the simultaneous reporting structure amplifies volatility risk, which specific metrics will move each stock, and how to interpret results as they land Wednesday night.\n\n## Why reporting on the same day amplifies market risk\n\nThe Magnificent Seven collectively represents approximately 33.7% of the S&P 500’s total weighting. The four companies reporting Wednesday account for more than 18% of the index on their own. That arithmetic matters because of how modern markets are wired.\n\nWhen this much index weight moves simultaneously, passive vehicles must reprice in lockstep. Index funds, exchange-traded funds (ETFs), and model portfolios that track the S&P 500 do not isolate single-stock risk. A disappointing print from any one of these four names ripples outward through every broad-market fund that holds it, which is functionally all of them.\n\n> \”Super Bowl Wednesday\”: Morningstar and MarketWatch coined the term to capture the day’s significance. The nickname, however, may understate the compounding effect. Four separate results landing in the same after-hours window means sentiment from the first release can colour the market’s reception of the next before institutional desks have time to reset.\n\nThe table below summarises each company’s approximate index weight and the scale of capital they have committed to deploy this year.\n\n
| Company | Ticker | Approx. S&P 500 Weight | 2026 Capex Commitment |
|---|---|---|---|
| Microsoft | MSFT | ~6-7% | Included in $650B combined |
| Alphabet | GOOGL | ~4% | Included in $650B combined |
| Meta | META | ~3% | $115-135 billion |
| Amazon | AMZN | ~4-5% | $200 billion |
\n
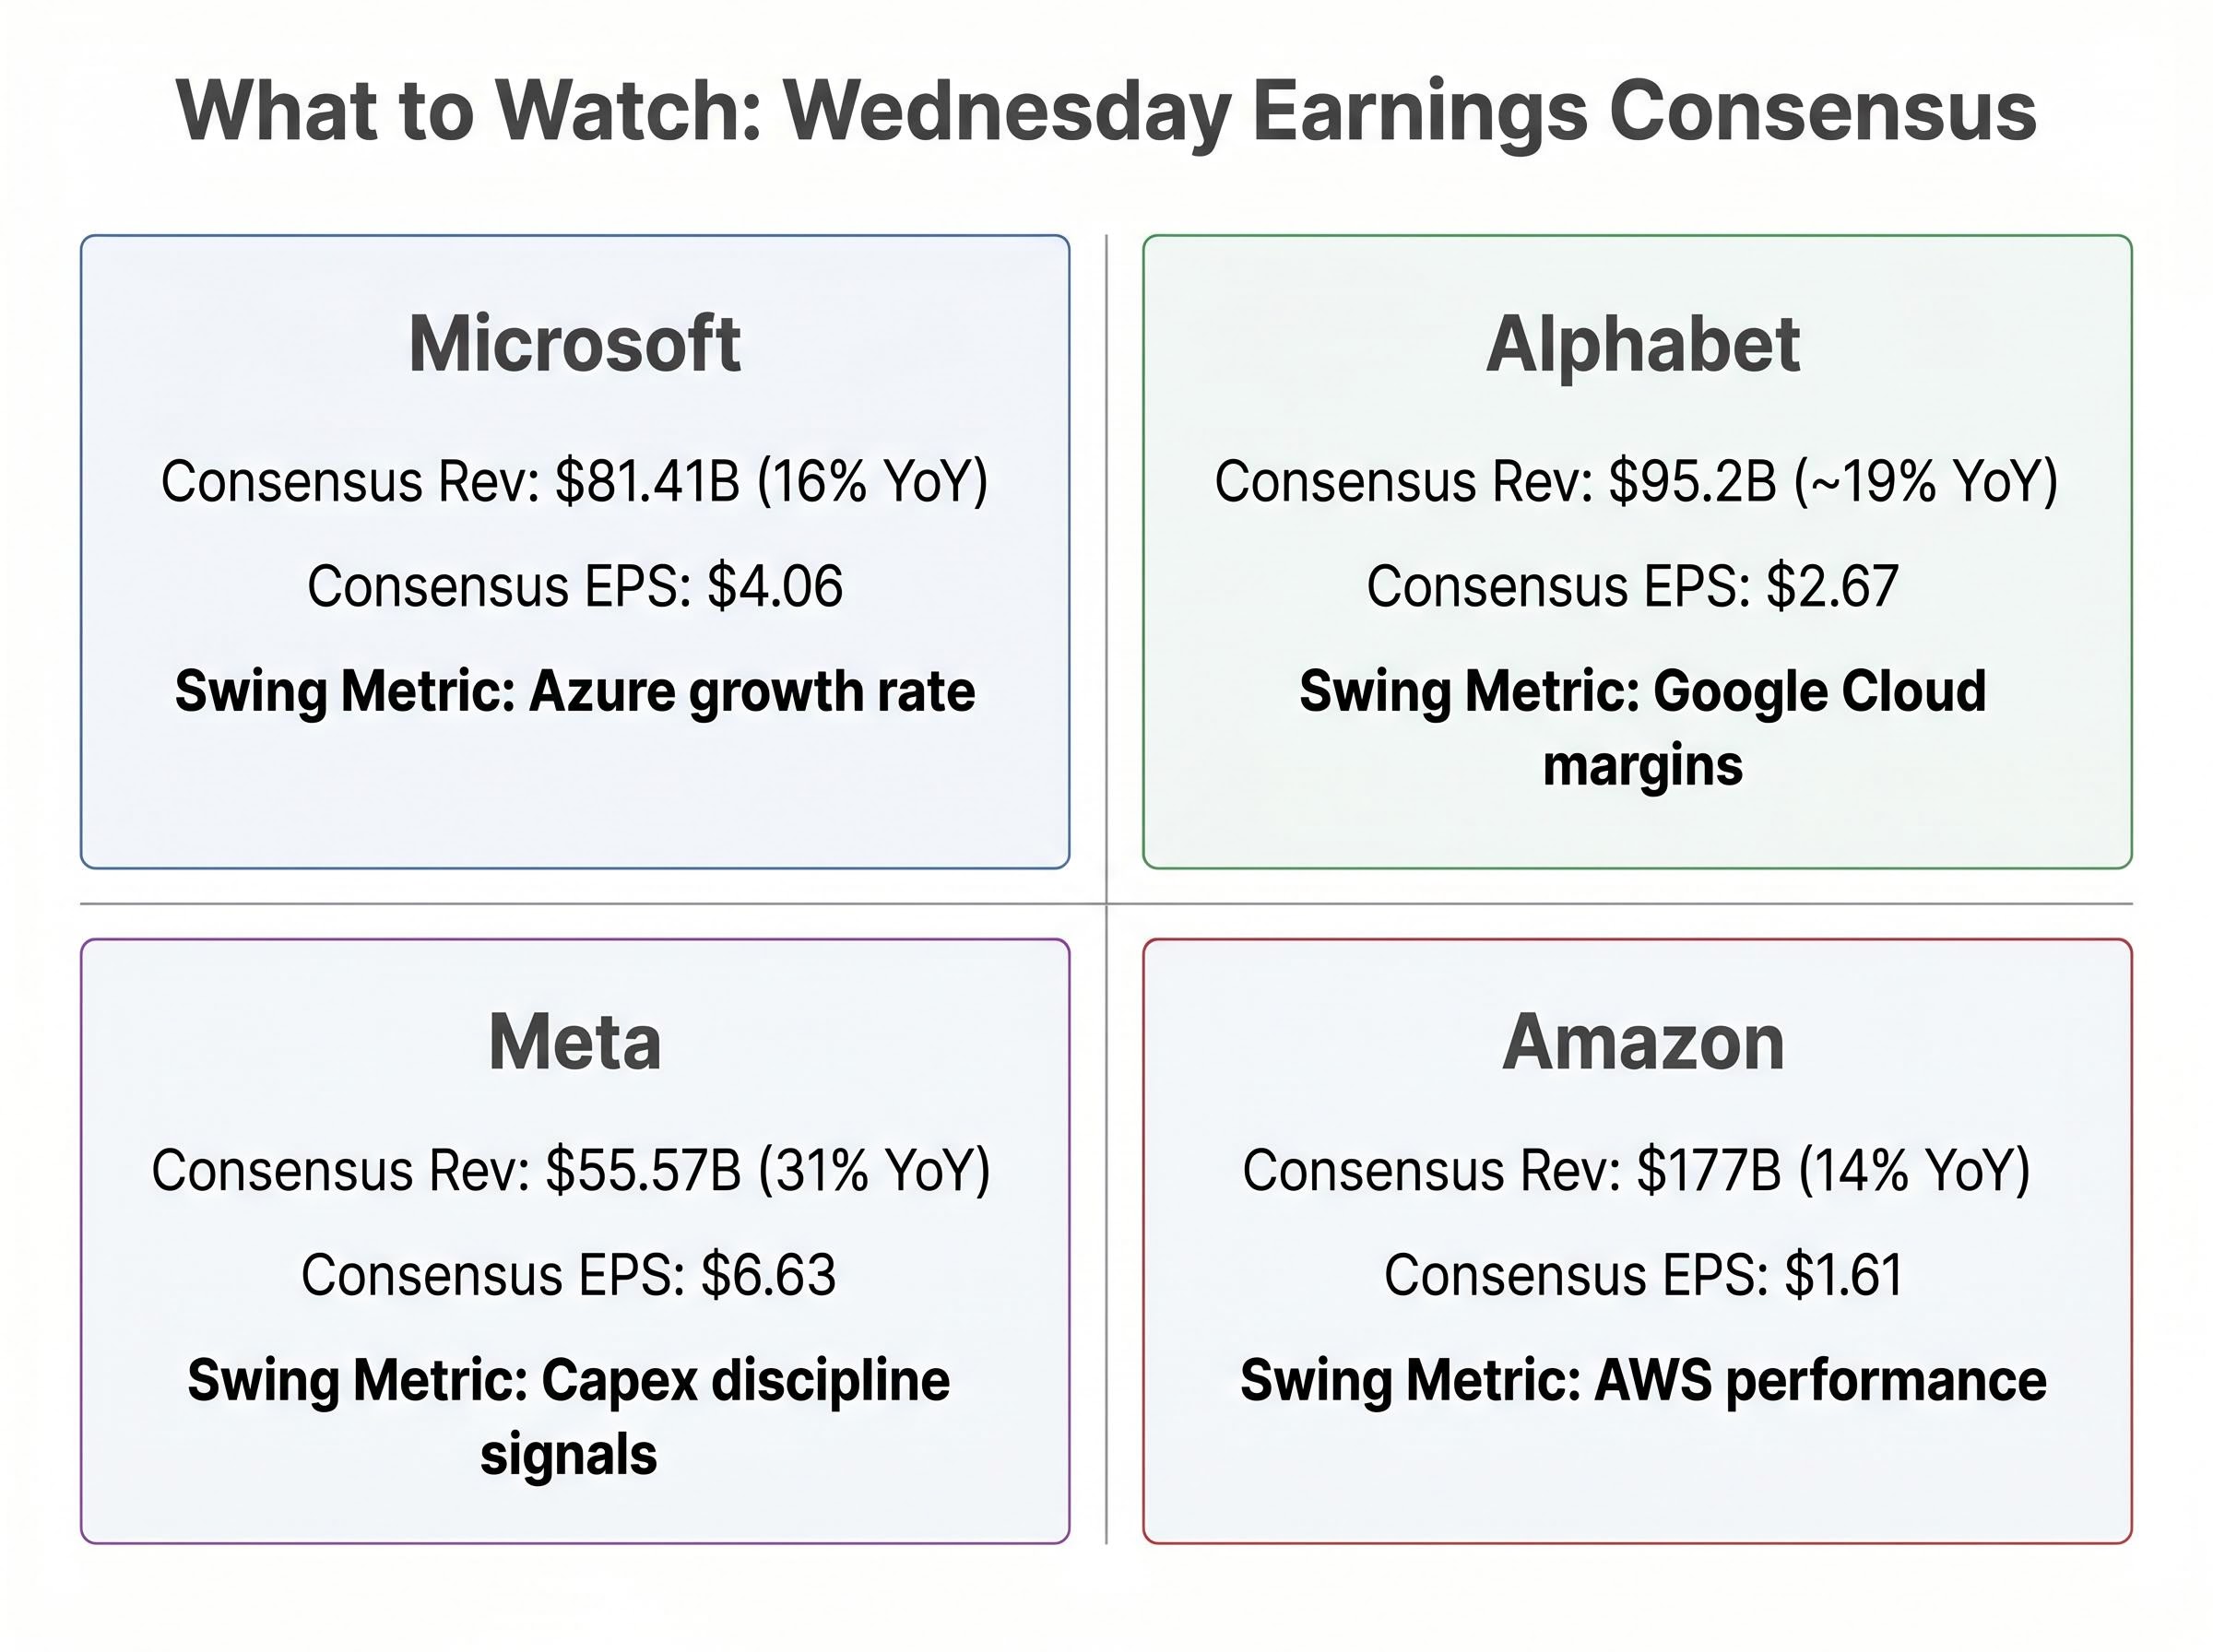
\n\nInvestors who hold broad index funds often underestimate how exposed their portfolios are to a single afternoon like this one. Thursday morning’s account balance will reflect what happens Wednesday night.\n\n## The macro backdrop heading into Wednesday’s releases\n\nThe market’s emotional arc into this earnings week has been anything but smooth. Early 2026 was defined by the \”Great Rotation,\” a sustained move of capital away from AI and software equities as investors questioned whether AI spending was consuming capital faster than revenue could grow. That rotation hit the Magnificent Seven hardest, compressing valuations and sending Microsoft to a year-to-date return of negative 12% as of April 24, 2026.\n\nThree distinct headwinds shaped the first four months of the year:\n\n- The Great Rotation: capital flowing out of AI-exposed equities into value, cyclicals, and international names\n- Geopolitical pressure: the US-Iran ceasefire and associated Strait of Hormuz concerns added oil price volatility and a risk premium to global markets\n- AI capex scepticism: mounting questions about whether $650 billion in combined spending could be monetised fast enough to justify the commitment\n\n### Where markets stand heading into Wednesday\n\nThe anxiety broke. The S&P 500 and Nasdaq Composite both reached new all-time highs ahead of Wednesday’s reports, reflecting renewed confidence that earnings season would validate the AI investment thesis. The S&P 500 year-to-date return stood at positive 4.67% as of April 24, and blended Q1 2026 earnings growth for the index was running at 15.1%, according to FactSet.\n\nThat recovery, however, raises the bar. Record highs heading into a concentrated earnings event mean beats must be convincing, not merely clean. The optimism is already priced in.\n\n## What to watch at each company: the four metrics that will move markets\n\nA headline earnings beat does not guarantee a positive reaction when expectations are this specific. For each of the four companies, one metric will function as the swing factor, the number the market is actually pricing and the one that will determine whether the stock moves higher or lower after hours.\n\n
| Company | Consensus Revenue | Consensus EPS | YoY Growth (Rev) | Swing Metric |
|---|---|---|---|---|
| Microsoft | $81.41B | $4.06 | 16% | Azure growth rate |
| Alphabet | $95.2B | $2.67 | ~19% | Google Cloud margins |
| Meta | $55.57B | $6.63 | 31% | Capex discipline signals |
| Amazon | $177B | $1.61 | 14% | AWS performance |
\n
\n\n### Microsoft\n\nAzure growth is the decisive number. The cloud platform grew 38% in constant currency in fiscal Q2 2026, and consensus expects roughly the same pace for Q3. Guggenheim’s John DiFucci flagged in late April 2026 that maintaining 38% would require unlikely new business acceleration, a sign that the bar may already be set too high. Fiscal Q3 consensus revenue sits at $81.41 billion (up 16% year-on-year) with EPS of $4.06 (up 17%).\n\nIf Azure holds, Copilot standalone monetisation becomes a secondary positive catalyst. If it slips, the negative 12% year-to-date return could deepen before a recovery thesis takes hold.\n\n### Alphabet\n\nThe tension here is unusual: 19% revenue growth paired with a 5% decline in EPS to $2.67. That gap is the question investors must resolve. Google Cloud margin trajectory sits at the centre of the debate, particularly in light of the $32 billion Wiz acquisition completed on 11 March 2026. The deal expanded Google Cloud’s security capabilities, but investors will scrutinise whether it creates a near-term margin drag.\n\n### Meta\n\nForty analysts cover Meta. Zero have sell ratings. The consensus price target is $750. That level of unanimity looks like confidence; it is also a setup where even a technical beat can disappoint if guidance language wavers.\n\nRevenue consensus of $55.57 billion implies 31% year-on-year growth, but EPS growth is projected at only 3% to $6.63. The gap reflects the weight of the $115-135 billion full-year capex commitment and the cost of AI infrastructure buildout. The 8,000 layoffs announced in late April 2026 signal an attempt at capital efficiency on the headcount side while maintaining infrastructure spend. Investors will probe for signs that the balance is sustainable.\n\n### Amazon\n\nAWS performance is the swing metric. CEO Andy Jassy characterised the $200 billion 2026 capex plan as already covered by customer commitments, a bold claim that the Q1 print will either validate or complicate. Consensus expects $177 billion in revenue (up 14%) and $1.61 in EPS (up 4%).\n\nThe company’s AI chip division, which Jassy cited in his shareholder letter as running at an annualised $50 billion revenue rate and growing more than 100% annually, provides a supporting data point. If AWS accelerates alongside that chip revenue, Amazon’s capex narrative strengthens considerably.\n\n## The AI capex reckoning: what $650 billion in spending actually means\n\nThe headline figure, $650 billion in combined 2026 capital expenditure across these four companies, is large enough to obscure its own meaning. To put it in practical terms: these companies are building physical computing infrastructure (data centres, custom chips, networking equipment, power generation) at a scale that rivals entire national infrastructure programmes. The spending is committed. If AI demand disappoints, the capital has already been deployed.\n\nThat is the core tension the market has been wrestling with all year, and it is the same tension that drove the Great Rotation earlier in 2026. Investors sold AI-exposed equities because spending appeared to be outrunning monetisation.\n\nEach company defends its capex posture differently:\n\n- Amazon: Jassy argued that customer commitments already cover nearly the full $200 billion plan, positioning AWS infrastructure as demand-pull rather than speculative buildout\n- Meta: cut 8,000 jobs (approximately 10% of its workforce) while maintaining $115-135 billion in capex, a stated priority of reducing people costs to fund infrastructure\n- Microsoft: its cloud segment crossed $50 billion in revenue in fiscal Q2 2026, providing a revenue base that partially backstops continued investment\n- Alphabet: the $32 billion Wiz acquisition signals a strategy of buying capability alongside building it, concentrating cloud security as a differentiated revenue stream\n\n> Andy Jassy, Amazon CEO, stated in his 2026 shareholder letter that customer commitments already cover nearly the full $200 billion capital expenditure plan for the year.\n\nWednesday’s earnings calls will be where each management team either reinforces or qualifies these commitments. The capex commentary may matter more than the revenue headlines.\n\n## How to interpret Wednesday night’s results as they land\n\nAfter-hours price action is noisy. Spreads widen, liquidity thins, and algorithmic trading can amplify moves before institutional desks have processed the filings. The \”real\” market reaction will be Thursday’s regular-session open. With that in mind, a practical framework for reading the results:\n\n1. Check the swing metric first. Azure growth for Microsoft, Google Cloud margins for Alphabet, capex discipline signals for Meta, AWS acceleration for Amazon. These are the numbers the market is pricing. Headline revenue and EPS beats are secondary.\n2. Read the guidance. A company can beat Q1 consensus and still sell off if forward guidance disappoints. Listen for any qualification of full-year capex plans.\n3. Listen for capex language. Words like \”rationalise,\” \”optimise,\” or \”phase\” in relation to spending signal a potential pullback. Words like \”accelerate\” or \”expand\” signal commitment.\n4. Wait for the regular session open. After-hours moves often reverse or amplify once institutional positioning resets on Thursday morning.\n5. Compare across all four before drawing index-level conclusions. Because all four report after the same close, cross-stock sentiment compounds quickly. A miss from one company can darken the read on the others before they even file. Assess the full picture before making portfolio decisions.\n\nThe asymmetry of expectations matters. Meta carries zero sell ratings from 40 analysts and a $750 consensus target, meaning the downside from a guidance miss could outweigh the upside from a clean beat. Microsoft, by contrast, enters with a negative 12% year-to-date return, a lower bar that creates more room for a positive surprise.\n\n## Conclusion\n\nApril 29, 2026 is not simply an earnings day. It is a referendum on whether the market’s recovery to record highs and its recommitment to AI-exposed equities is supported by the underlying fundamentals. More than 18% of the S&P 500 by weighting reports in a single after-hours window. $650 billion in capex commitments will be either reinforced or qualified. Four swing metrics, identified above, will determine whether Thursday opens with relief or repricing.\n\nThe interpretive framework outlined in this analysis is designed to be applied in real time as results land Wednesday night. Headline beats and misses will generate noise. The signal will come from the specific metrics each company’s valuation depends on. Readers are encouraged to return after Wednesday’s close for coverage of the actual results.\n\nThis article is for informational purposes only and should not be considered financial advice. Investors should conduct their own research and consult with financial professionals before making investment decisions. Past performance does not guarantee future results.\n\n—” } “`
Hyperscaler free cash flow turning negative by year-end 2026 is the specific projection Societe Generale’s chief US equity strategist cited when recommending the equal-weight S&P 500 over cap-weighted exposure, a view that frames Wednesday’s earnings calls as an early-cycle test of whether the capex commitment is sustainable before the cash flow squeeze arrives.
Azure revenue growth and Copilot seat expansion are the two metrics that will most directly shift analyst targets after Wednesday’s print, with 42 of 45 covering analysts maintaining Buy-equivalent ratings and the consensus price target implying more than 36% upside from current levels, a setup where the stock enters the session with expectations already well-defined.
Concentration risk embedded in cap-weighted index exposure becomes a live portfolio question on a day like Wednesday: investors holding broad-market ETFs such as VTI carry positions in all four reporting companies simultaneously, with the top three holdings in those funds still accounting for more than 16% of total fund weight and the technology sector representing 36.3% of the portfolio.
The $2.51 trillion market cap recovery in April 2026, driven entirely by sentiment shifts and fund flows before a single Q1 earnings report had been confirmed, is the precise reason record index highs heading into Wednesday carry a higher bar: the rally was priced on expectations, and Wednesday’s prints are where expectations meet reported reality.
Super Bowl Wednesday refers to April 29, 2026, when Microsoft, Alphabet, Meta, and Amazon all report earnings after the bell on the same day, collectively representing more than 18% of the S&P 500 by index weighting in a single after-hours session.
Azure growth rate is the swing metric for Microsoft, Google Cloud margins for Alphabet, capex discipline signals for Meta, and AWS performance for Amazon; headline revenue and EPS beats are considered secondary to these specific indicators.
Investors holding broad-market ETFs such as those tracking the S&P 500 are exposed to all four reporting companies simultaneously, meaning a disappointing result from any one name ripples through every passive vehicle that holds it, which is functionally all of them.
The S&P 500 recovered to all-time highs before a single Q1 2026 earnings report was confirmed, meaning the rally was priced on expectations rather than reported results, so beats must be convincing rather than merely clean to sustain those levels.
The $650 billion in combined 2026 capital expenditure across Microsoft, Alphabet, Meta, and Amazon represents already-committed spending on data centres, chips, and infrastructure; if AI demand disappoints, the capital will have been deployed regardless, making Wednesday's guidance language on capex as important as the revenue headlines.


