
How Dual-Class Shares Put $24 Billion in Gulf Capital at Arm’s Length
Apr 28, 2026

VTI has returned 260% over the past decade while charging 0.03% in annual fees. Its portfolio holds more than 3,500 US stocks across every market capitalisation tier. Yet as of April 2026, three companies alone, Nvidia, Apple, and Microsoft, account for 16.69% of the fund. The Magnificent Seven have grown so dominant that the most popular total-market ETF in the world now carries a 36.3% technology sector weighting. For investors weighing VTI against a direct Magnificent Seven allocation, the question is no longer diversification versus concentration. It is which type of concentration they are comfortable with, how much execution risk they are willing to absorb at current valuations, and over what time horizon. This analysis walks through the performance record, the structural realities inside VTI’s portfolio, the mechanics of concentration risk, and a $2.839 trillion Amazon case study to give investors a sharper framework for a decision that the headline numbers alone cannot resolve.
The comparative performance between VTI and the Magnificent Seven depends entirely on which window an investor chooses to examine. Over the past three years, the MAGS ETF (an unleveraged, equal-weight basket of the seven stocks, with an inception date of April 2023) has delivered an annualised return of approximately 40.16%. VTI’s three-year annualised figure is 17.86%. On that measure, concentration wins convincingly.
Then 2026 arrived. Year-to-date through late April, VTI has returned +5.36% while MAGS has gained just +0.92%.
VTI has outperformed the unleveraged Magnificent Seven basket by approximately 4.4 percentage points in 2026 year-to-date, the widest short-term gap in favour of broad-market participation since MAGS inception.
The full-year 2025 data splits the difference: MAGS returned +22.99% against VTI’s +17.10%, a meaningful but narrower advantage than the three-year annualised figure suggests.
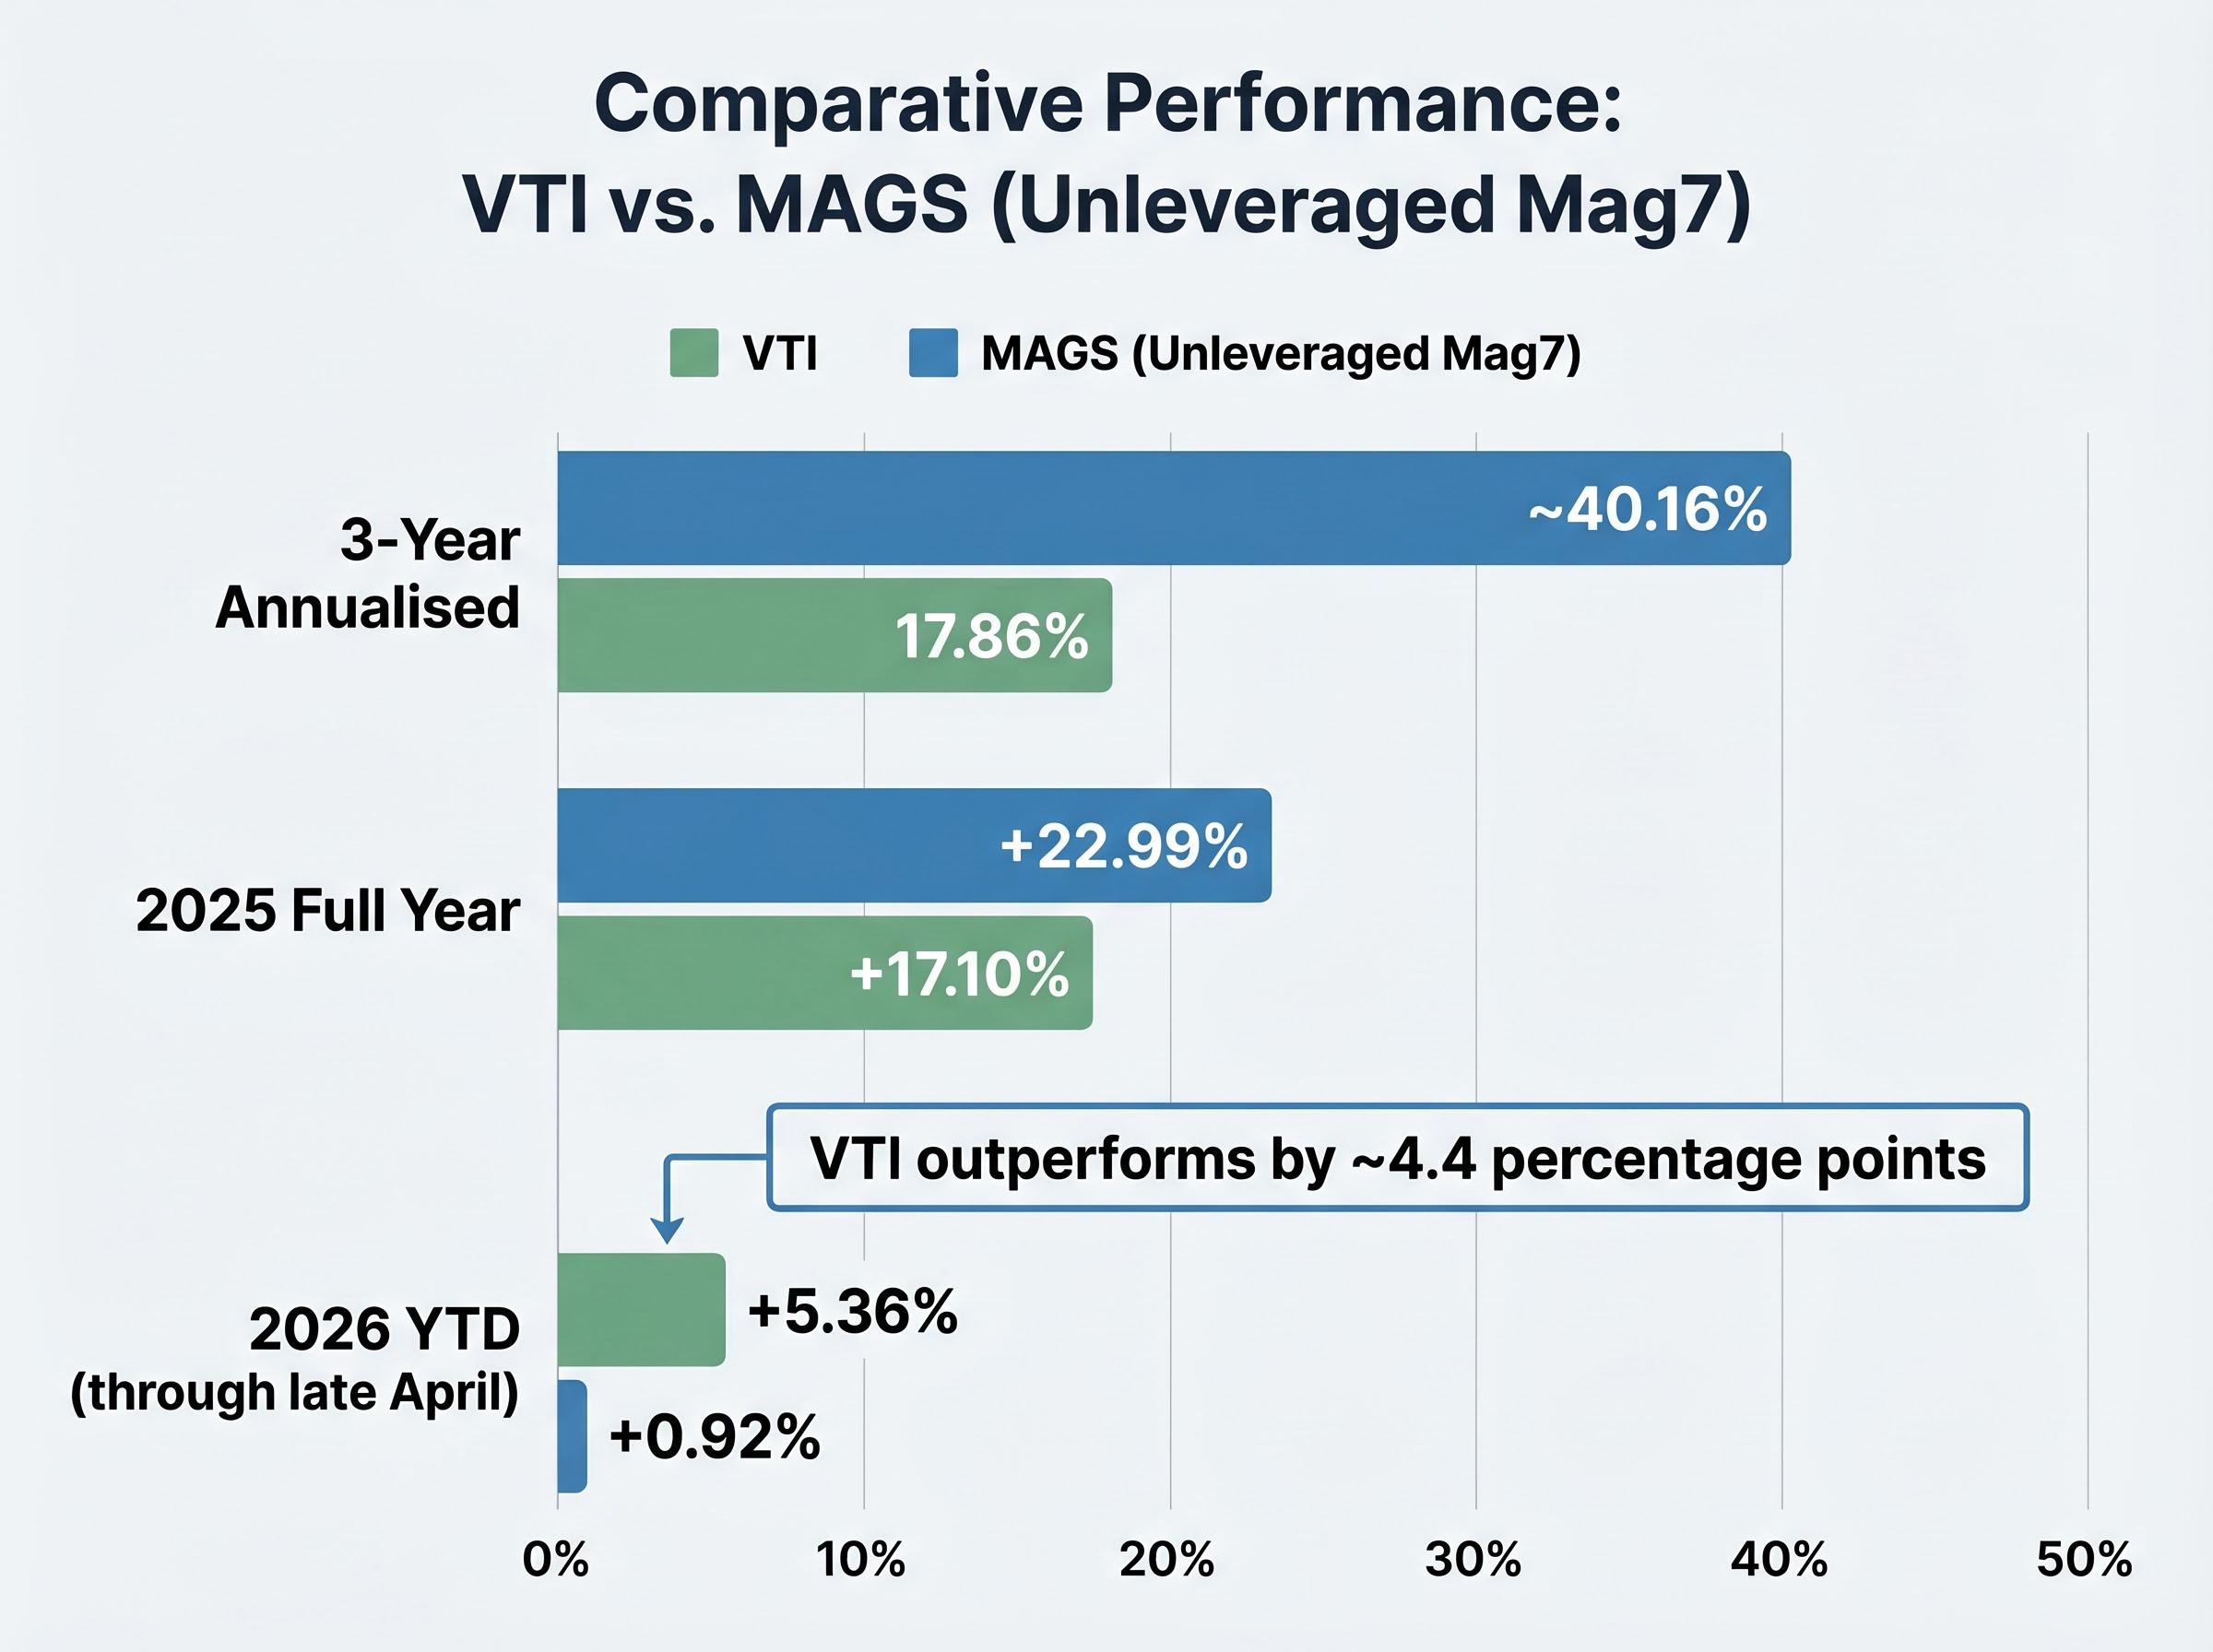
A note on methodology: leveraged products such as MAG7.L (a 5x leveraged ETP with annualised volatility of approximately 117%) distort any retail-relevant comparison and are excluded from this analysis. The MAGS ETF is the appropriate unleveraged proxy.
| Period | VTI | MAGS (Unleveraged Mag7) | Who Outperformed |
|---|---|---|---|
| 2026 YTD | +5.36% | +0.92% | VTI |
| 2025 Full Year | +17.10% | +22.99% | MAGS |
| 3-Year Annualised | 17.86% | ~40.16% | MAGS |
| 5-Year Annualised | 10.78% | N/A (fund too new) | VTI (sole data) |
| 10-Year Annualised | 13.68% | N/A (fund too new) | VTI (sole data) |
Neither approach wins cleanly across all available time horizons. That internal contradiction is the starting point for the rest of this analysis.
VTI’s fund characteristics read like a diversification checklist:
That last figure deserves a second look. A fund holding more than 3,500 names still derives nearly a sixth of its weight from three technology companies. If an actively managed fund filed a factsheet showing 36.3% in a single sector, it would be marketed as a sector tilt, not a total-market product.
VTI’s market-cap weighting and Magnificent Seven exposure raise a structural question that the 10-year return headline obscures: if the top 10 holdings represent 31.60% of the portfolio and Amazon alone sits at 3.20%, broad-market participation and concentrated mega-cap exposure are not mutually exclusive descriptions of the same fund.
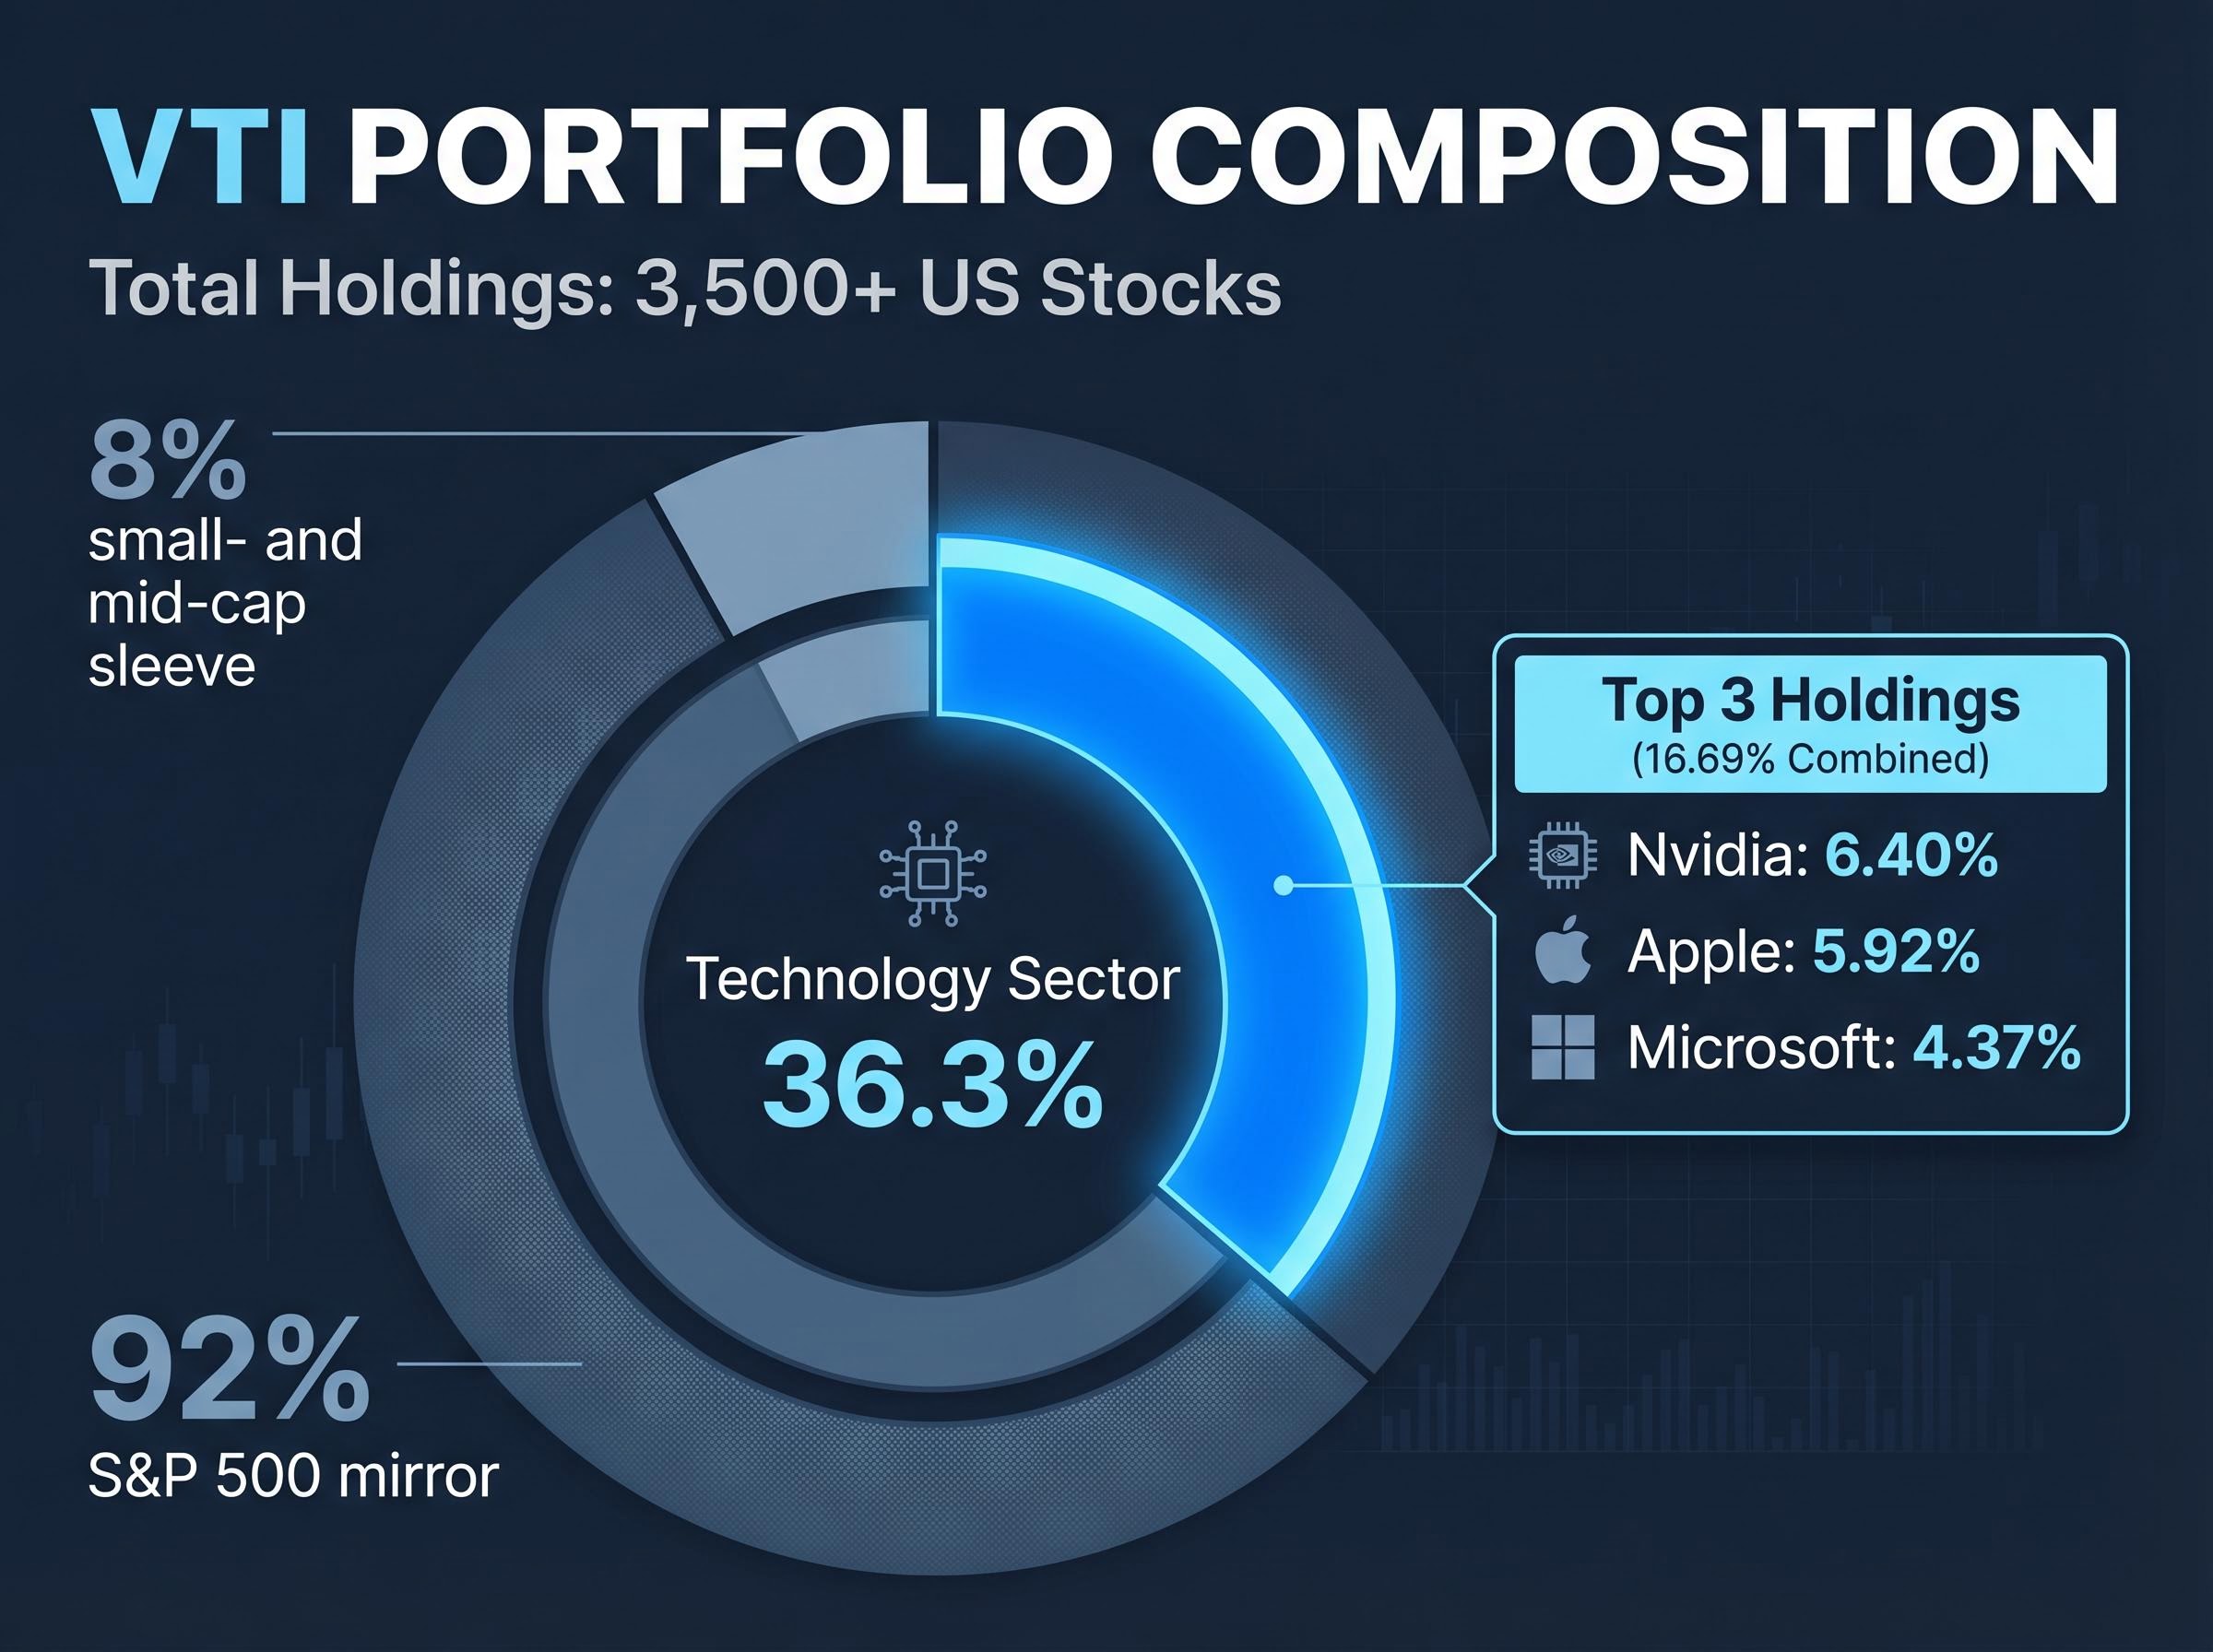
Approximately 92% of VTI mirrors the S&P 500. The remaining 8% covers small- and mid-cap names absent from the large-cap index, and this sleeve is VTI’s primary structural differentiator from VOO or a direct Mag7 allocation.
In periods where value creation broadens beyond mega-cap technology, this small- and mid-cap component is the mechanism through which VTI can outperform more concentrated large-cap products. The 2026 year-to-date data (VTI +5.36% vs. MAGS +0.92%) offers early, tentative evidence that such a broadening may be underway, though the sample is too short to confirm a trend.
At a surface level, the risk difference between holding 7 stocks and 3,500 is intuitive. The mechanics underneath, however, matter more than the count.
Concentration risk describes the degree to which a portfolio’s performance is determined by a small number of positions, and what happens to outcomes when those positions move together. VTI’s broad diversification produces annualised volatility in the range of approximately 15-20%. A seven-stock basket with highly correlated holdings carries materially higher volatility, because the positions are not independent bets pulling in different directions; they are variations on the same theme.
FINRA’s investor guidance on concentration risk specifically addresses the limitations of apparent diversification in portfolios or funds where a small number of highly correlated positions dominate returns, a dynamic that applies directly to any basket built around a single sector or theme.
The Magnificent Seven share a set of performance drivers that limit the diversification benefit of holding all seven rather than one or two:
Holding seven stocks is not seven independent bets when all seven respond to the same macroeconomic inputs; it is one bet expressed through seven tickers.
For context, the 5x leveraged MAG7.L product carries annualised volatility of approximately 117%, a figure cited here solely to illustrate why leveraged proxy comparisons are inappropriate for retail investors evaluating unleveraged alternatives.
The practical implication: when the drivers listed above move adversely, all seven names tend to move adversely together, and there is no offsetting sleeve of energy, industrials, or healthcare names to absorb the drawdown. VTI’s 3,500 positions, spanning every US sector and market cap tier, provide that absorption. The trade-off is clear: VTI caps upside concentration in exchange for structural downside cushioning.
Amazon is the Magnificent Seven member that most precisely illustrates a risk the entire group shares in varying degrees: what happens when a company at extreme scale tries to execute on multiple capital-intensive fronts simultaneously.
At a market capitalisation of approximately $2.839 trillion (as of 27 April 2026) and a share price of $263.99, Amazon is running heavy investment across five distinct business lines:
Each line competes for management attention and return on invested capital. Adam Spatacco of the Motley Fool, writing on 26 April 2026, assessed that Amazon is likely to be the worst-performing Magnificent Seven stock over the next 10 years, framing the case not as an absolute loss prediction but as a relative opportunity cost argument. By comparison, Nvidia (trading at $208.24 at the time of analysis) operates a more focused execution model concentrated on GPU design and AI infrastructure.
The execution pressure Amazon faces across five capital-intensive business lines connects to a broader structural concern about the cohort: hyperscaler free cash flow turning negative by late 2026 is the central risk Societe Generale’s strategists identified in April 2026, driven by approximately $600 billion in projected AI infrastructure investment across the group, roughly double 2025 spending levels, with revenue monetisation still in early stages.
The Amazon execution risk is not unique to Amazon. Each Magnificent Seven member faces its own version of the scale-versus-focus tension at multi-trillion-dollar market capitalisations. The question for investors concentrating in this group is a probability distribution question: at current valuations, how much execution perfection is already priced in? If the most diversified company in the cohort faces a credible case for decade-long relative underperformance, the assumption that owning all seven provides sufficient safety deserves scrutiny.
VTI is not an escape from technology concentration. It carries 36.3% tech weighting, and the Magnificent Seven feature prominently in its top holdings. The positive case for VTI rests on a different structural property: no single company’s execution failure can meaningfully derail the portfolio, because 3,500 positions cap individual-name impact.
The cost advantage compounds over time. Neil Patel of the Motley Fool, writing in 2026, positioned VTI as a pragmatic choice for investors sceptical of ongoing Mag7 concentration, emphasising its small- and mid-cap exposure and durable long-term performance record.
At a 0.03% expense ratio, VTI costs an investor holding $100,000 roughly $30 per year in fees. Over a 10-year horizon, that structural cost advantage compounds meaningfully relative to higher-fee thematic or actively managed alternatives.
VTI structurally outperforms concentrated Mag7 exposure under three conditions:
VTI’s 10-year cumulative return of 260.38% and annualised return of 13.68% provide the long-run participation baseline. The fund does not need the Magnificent Seven to fail; it needs the broader US economy to keep producing value across sectors. That is a different, and arguably less demanding, bet.
Any honest assessment must hold two facts simultaneously: the MAGS three-year annualised return of approximately 40.16% versus VTI’s 17.86% is a real and substantial performance gap, and the 2026 year-to-date reversal (VTI +5.36% versus MAGS +0.92%) is real and directionally significant.
The core investor decision is a probability judgement. Mag7 concentration bets on continued execution from seven companies at extreme valuations, anchored by Amazon’s $2.839 trillion market capitalisation and the demand multiples that sustain it. VTI bets on the long-run productivity of the entire US equity market, with a 260.38% cumulative ten-year return as the baseline.
Investors who want broad-market participation without VTI’s 36.3% technology tilt have a third option worth examining: equal-weight S&P 500 exposure via RSP, which Societe Generale’s chief US equity strategist identified in April 2026 as his preferred vehicle through early 2027, on the basis that RSP’s industrials, materials, and utilities weighting positions holders to capture AI infrastructure power demand without the free cash flow drag projected for hyperscalers through year-end 2026.
| Factor | VTI | Mag7 (via MAGS) |
|---|---|---|
| Return track record | 13.68% annualised (10-year) | ~40.16% annualised (3-year) |
| Concentration level | 3,500+ holdings, 36.3% tech | 7 holdings, ~100% tech |
| Volatility profile | ~15-20% annualised | Higher (concentrated basket) |
| Expense | 0.03% | Higher |
| Broadening-market upside | Captures automatically | Does not participate |
| Single-name risk | Capped by position sizing | ~14% per name (equal weight) |
Four investor-profile questions should drive this decision:
The data cannot tell investors whether the 2026 year-to-date broadening is the beginning of a structural rotation or a temporary blip. That is precisely the uncertainty a 10-year horizon choice must accommodate.
The Magnificent Seven’s three-year track record is real. So is the concentration risk embedded in a $2.839 trillion Amazon and a VTI fund where 36.3% of assets sit in technology. Mag7 concentration remains a defensible approach for investors with high conviction in sustained AI-driven mega-cap outperformance and the risk tolerance to absorb periods of sharp underperformance. VTI remains defensible for investors who want the full US equity market’s productivity without staking outcomes on any individual company’s execution at extreme valuations.
The 2026 year-to-date divergence, with VTI outperforming MAGS by approximately 4.4 percentage points, is too early to call a structural shift. It is, however, precisely the kind of signal a 10-year investor should be tracking quarter by quarter. The debate is not settled. The framework for monitoring it is.
This article is for informational purposes only and should not be considered financial advice. Investors should conduct their own research and consult with financial professionals before making investment decisions. Past performance does not guarantee future results.
VTI is a total-market ETF holding more than 3,500 US stocks across all market capitalisations at a 0.03% expense ratio, while the Magnificent Seven is a concentrated basket of seven mega-cap technology companies. VTI offers broad sector diversification with capped single-name risk, whereas a Magnificent Seven allocation bets heavily on continued AI-driven outperformance from a small, highly correlated group of stocks.
The answer depends on the time period examined. Over the three years to early 2026, the MAGS ETF (an unleveraged Magnificent Seven proxy) returned roughly 40.16% annualised versus VTI's 17.86%, but in 2026 year-to-date VTI has outperformed MAGS by approximately 4.4 percentage points, returning +5.36% compared to +0.92%.
VTI carries a 36.3% technology sector weighting as of April 2026, and its top three holdings, Nvidia, Apple, and Microsoft, together account for 16.69% of the fund. While it holds over 3,500 names, approximately 92% of the portfolio mirrors the S&P 500, meaning it has significant mega-cap technology exposure even though it is marketed as a total-market product.
The primary risk is that all seven stocks share the same performance drivers, including interest rate sensitivity, AI capital expenditure cycles, and regulatory pressure, meaning they tend to move adversely together rather than acting as independent positions. Societe Generale strategists flagged in April 2026 that hyperscaler free cash flow could turn negative by late 2026, driven by roughly $600 billion in projected AI infrastructure spending across the group.
VTI is positioned to outperform Magnificent Seven concentration under three conditions: when value creation broadens beyond mega-cap technology into small-cap, mid-cap, or non-tech sectors; when one or more Magnificent Seven members faces a significant execution failure; or when regulatory and antitrust pressure compresses multiple Magnificent Seven valuations simultaneously.


