
Since September 2024, the Federal Reserve has delivered 175 basis points of cuts across six separate reductions, yet the 10-year Treasury yield remains near 4.7% and 30-year mortgage costs have climbed rather than fallen. That single contradiction tells you more about the bond market in 2026 than any Fed press conference has.
This is not an abstraction. Long term treasury yields set the price of mortgages, auto loans, business credit lines, and the returns on retirement portfolios holding fixed-income assets. The broken relationship between what the Fed does with the overnight rate and what happens to the borrowing costs that actually touch your life is the reason refinancing has not become easier, and why the federal government’s own interest bill keeps compounding regardless of monetary policy.
Here is what the data tells you about why this gap exists, which three structural forces are keeping long-term rates elevated, why institutional interventions have failed to close it, and what conditions would genuinely move the needle. None of them involve a Fed meeting date.
How the Fed-yield relationship came apart in 2024
How the pattern worked
For roughly four decades, a reliable correlation existed: Fed easing cycles coincided with falling long-term Treasury yields. Researchers examining every cutting cycle stretching back to the 1980s found that the 10-year Treasury yield stood lower 100 days after the opening rate cut without a single exception across the entire sample period.
Studies of Federal Reserve easing cycles extending back to the 1980s showed the 10-year Treasury yield was lower 100 days after the first cut in every recorded instance. The September 2024 cycle ended that unblemished record.
The correlation was real, but the causality ran through macro conditions, not through the Fed’s rate tool. Cutting cycles have typically been launched in response to recessions or pronounced economic softness. Those environments produced declining inflation expectations, a shift of capital into safe-haven assets, and stronger appetite for government bonds, all of which pushed long-term yields downward in parallel with the policy rate. Because the two series moved in the same direction for so long, the distinction between them faded from view for most market observers.
The correlation was real, but the causality ran through macro conditions. Bond yield mechanics, specifically the way auction clearing prices and secondary market repricing interact with inflation expectations and fiscal risk perceptions, explain why two yields can diverge sharply even when one institution nominally sets the policy rate.
What happened in 2024
When the Fed launched its easing cycle in September 2024, it trimmed rates by a cumulative 100 basis points through three consecutive moves: an initial cut of 50 basis points, followed by two reductions of 25 basis points each. Rather than falling in tandem, the 10-year Treasury yield climbed 99 basis points across the same period, creating a roughly 200-basis-point gap between the path of monetary policy and the path of the rate that actually governs long-term borrowing.
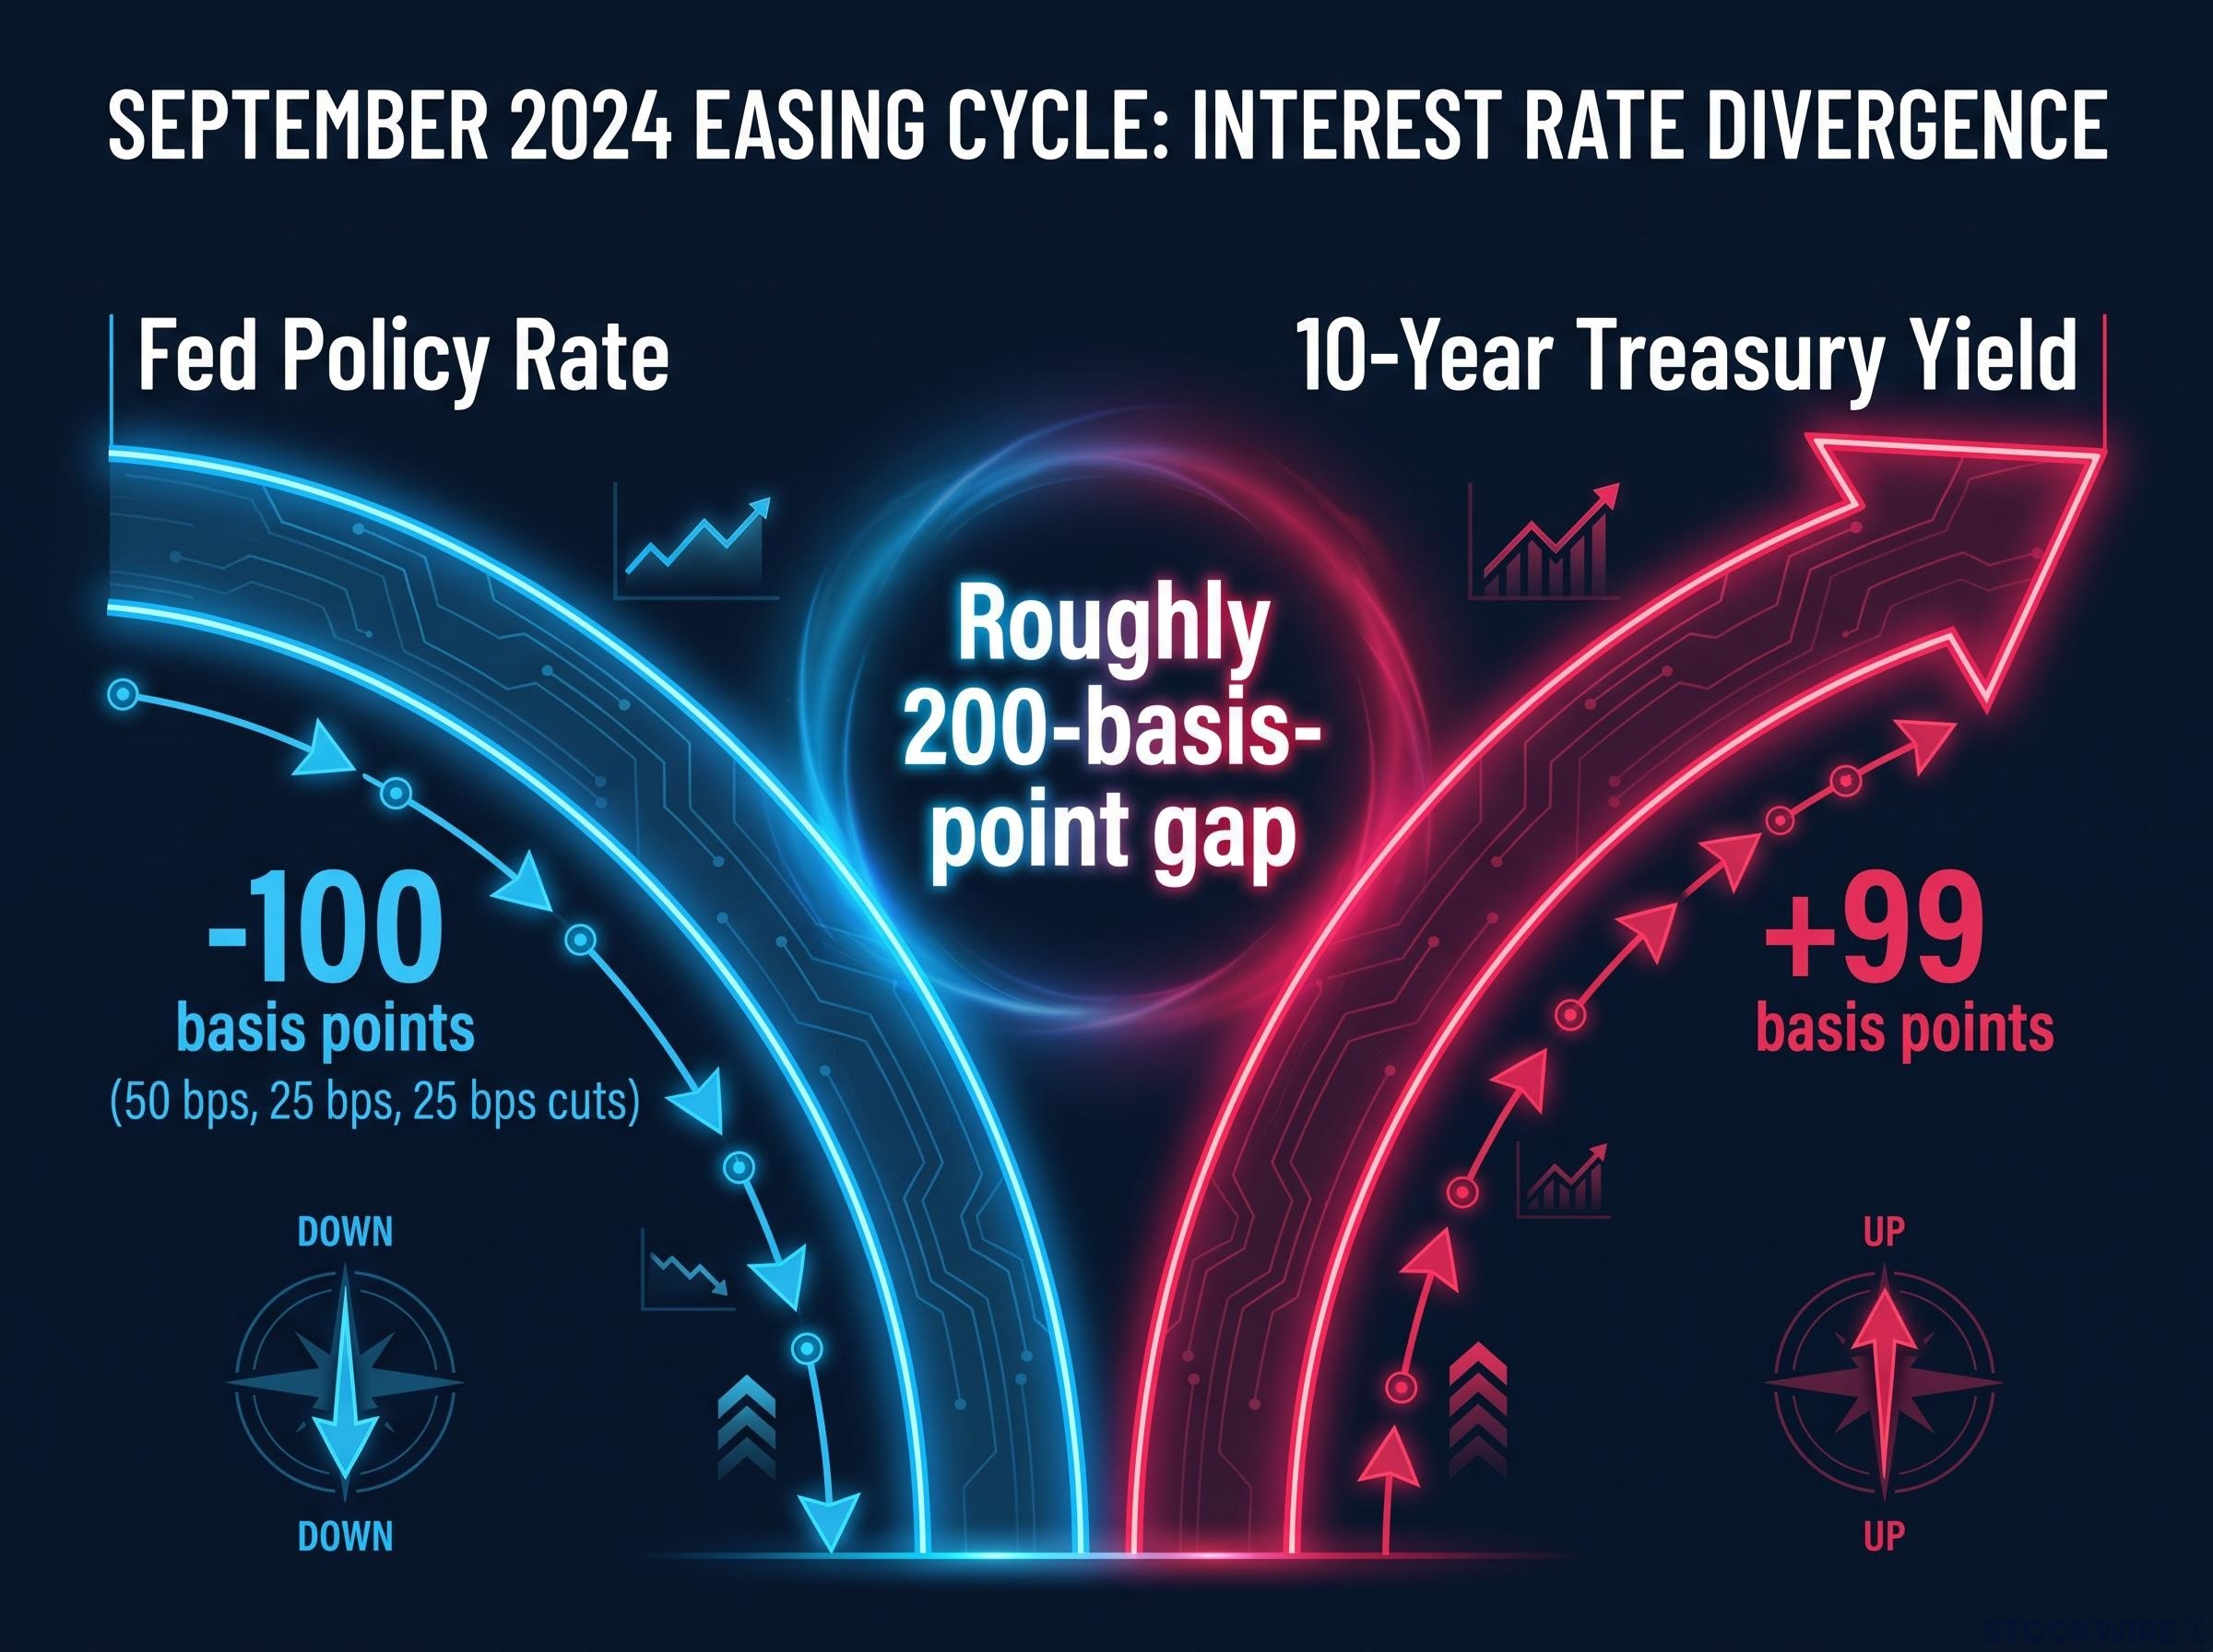
The pattern did not just weaken. It inverted.
The backdrop explains why. The U.S. economy repeatedly outperformed growth expectations through 2024-2025, inflation remained above the 2% target, and the labour market stayed strong. None of the recessionary conditions that historically powered the correlation were present. The mechanism was working correctly; the context had changed. Understanding that distinction reframes how you should interpret every future Fed announcement: the central bank never truly controlled long-term rates. The historical pattern was a coincidence of recessionary context, not a transmission mechanism. Waiting for a Fed cut to lower your mortgage rate is based on a misread of how the system works.
When big ASX news breaks, our subscribers know first
Why elevated yields are resistant to monetary policy
Three structural forces are holding long-term yields up, and each operates independently of the Fed’s overnight rate. They are listed here in ascending order of intractability, the hardest to fix comes last.
- Record deficit supply: Unprecedented peacetime borrowing is flooding the Treasury market with bonds.
- Corporate bond competition: An expanded high-quality corporate market forces Treasuries to compete for institutional capital.
- Inflation uncertainty and the term premium: Investors holding long-duration bonds demand extra compensation for purchasing-power risk that the overnight rate cannot address.
Why the self-reinforcing deficit cycle matters
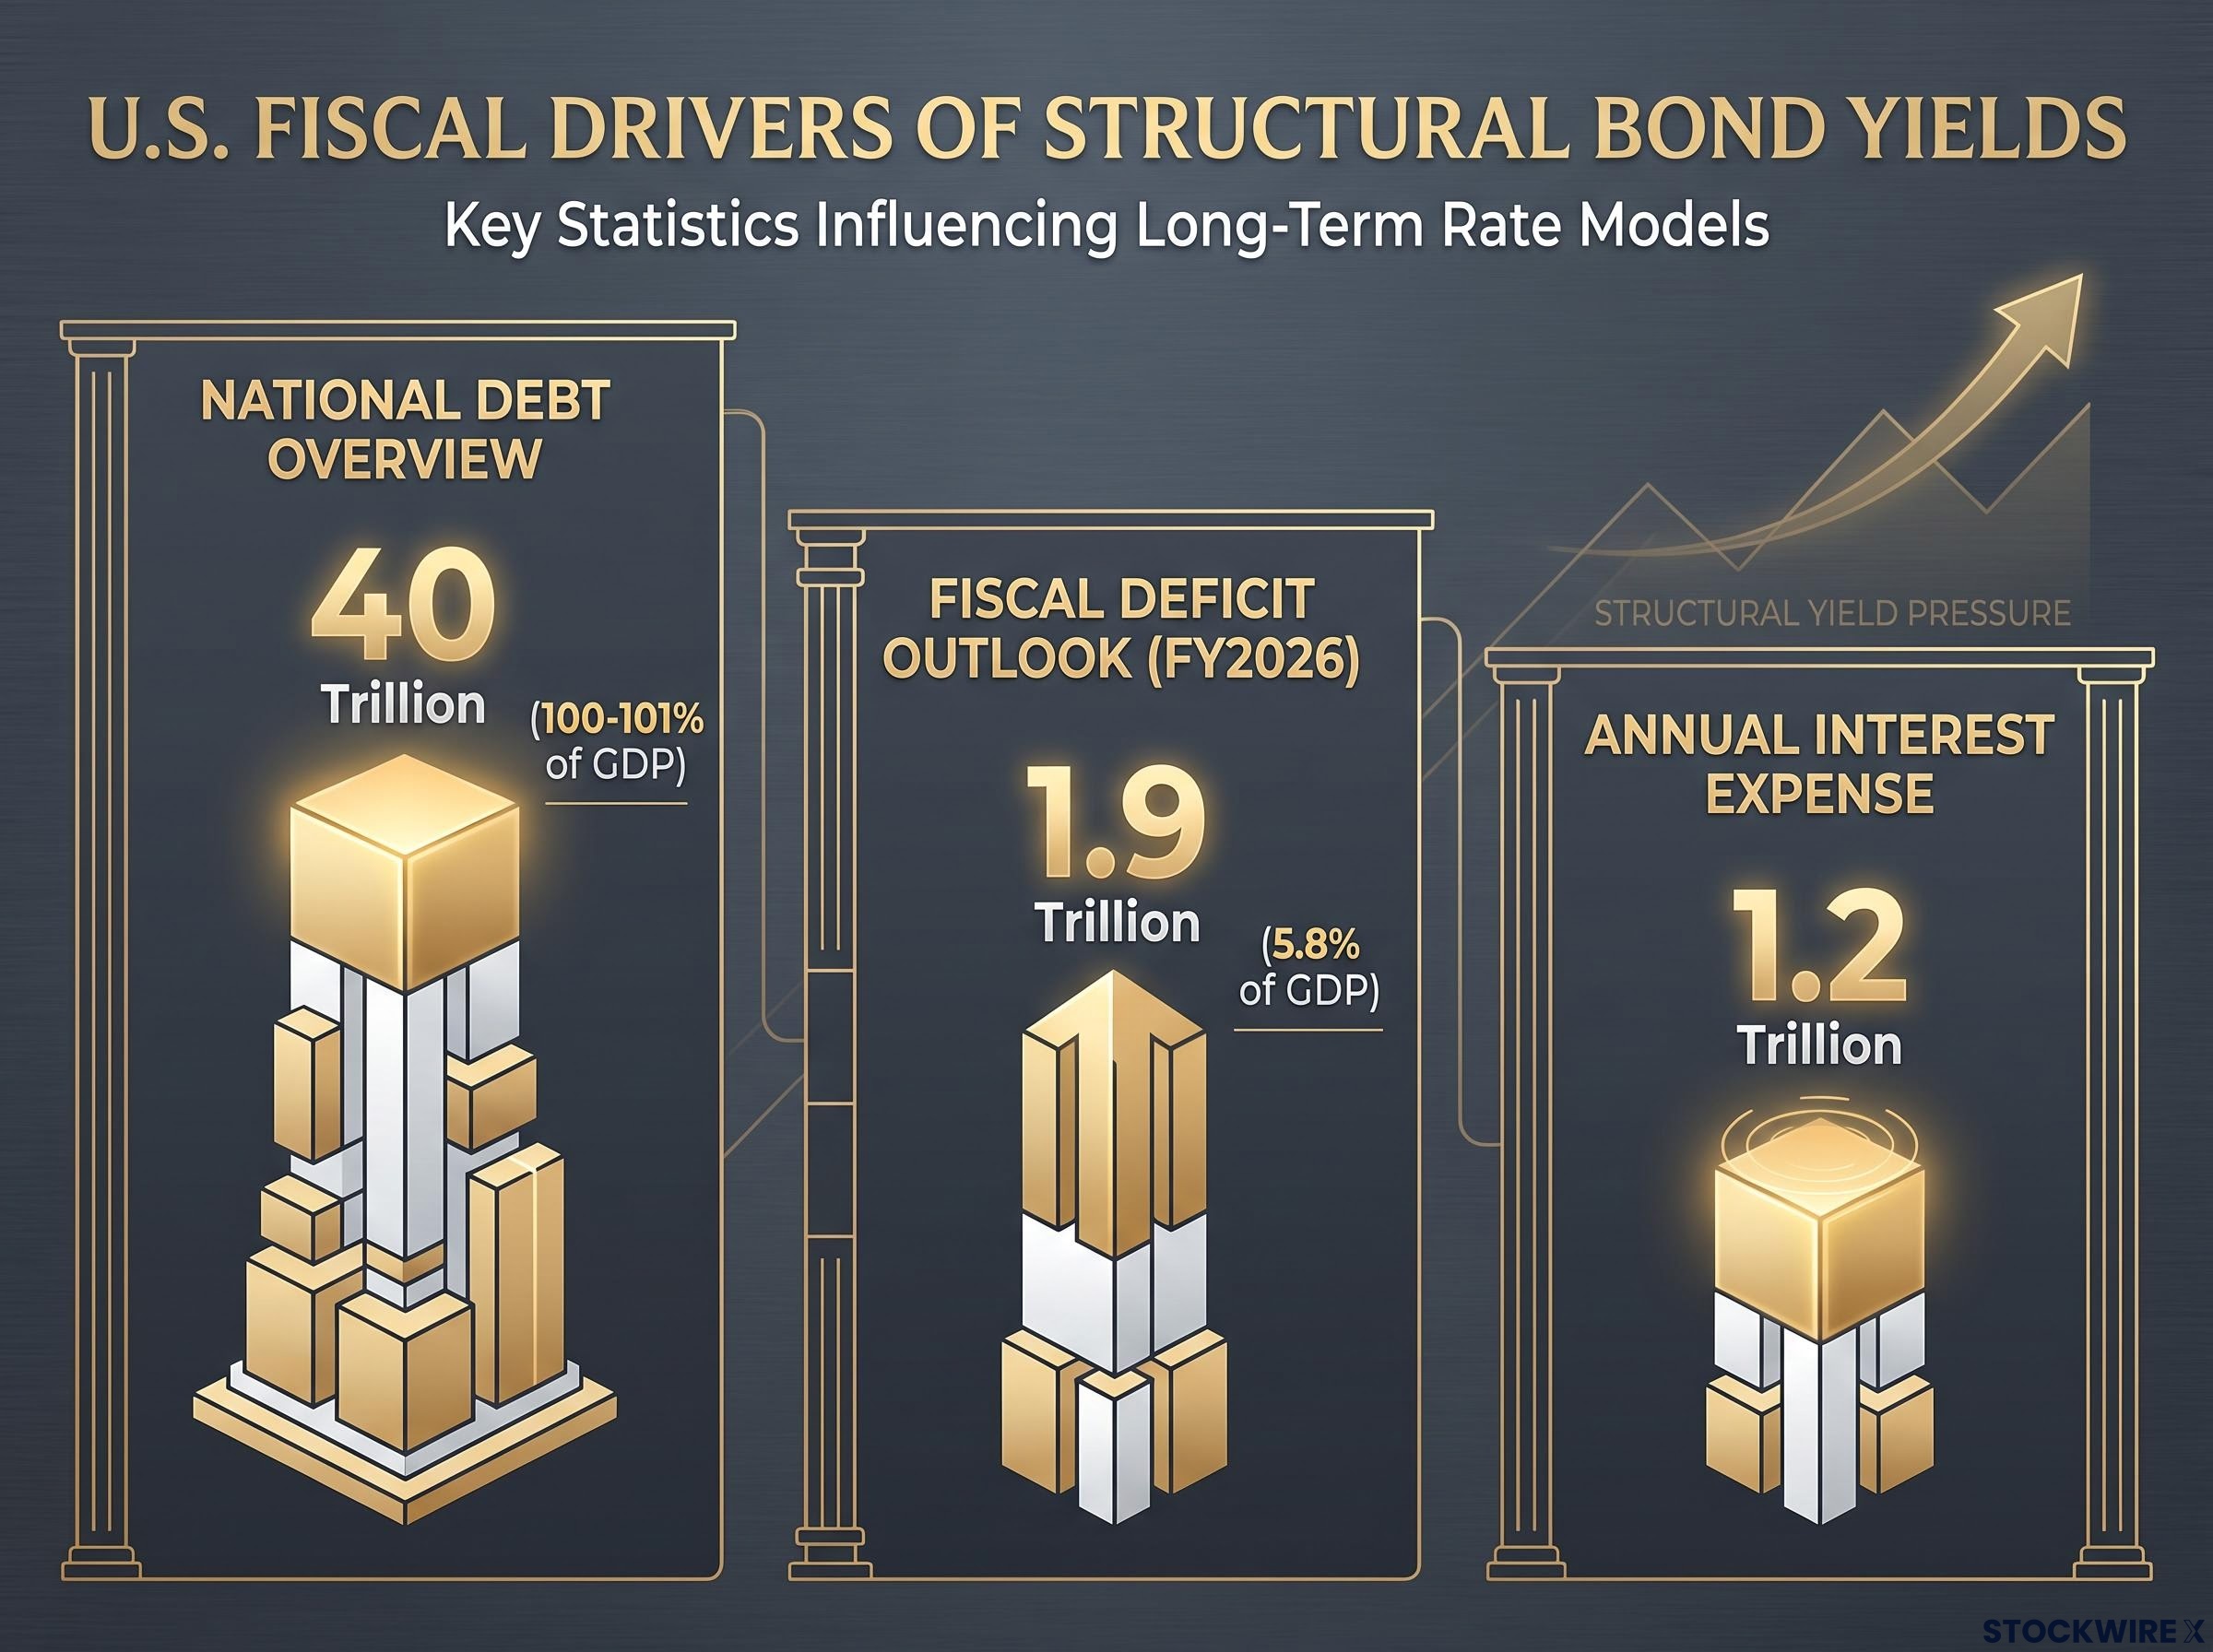
The fiscal numbers are the most quantifiable force. Total U.S. national debt has now crossed the $40 trillion threshold. Debt held by the public sits near 100-101% of GDP. The FY2026 deficit is projected at approximately $1.9 trillion (5.8% of GDP), and July 2026 alone recorded a $432 billion shortfall, the steepest single-month figure since March 2021.
Annual interest expense on the national debt is now estimated at roughly $1.2 trillion, which accounts for close to two-thirds of the year-to-date deficit. The arithmetic is self-reinforcing: a larger debt stock generates a larger interest bill, the interest bill requires additional borrowing to cover, and the resulting bond issuance fills the auction calendar irrespective of where the Fed sets the overnight rate. The Fed’s rate tool has no mechanism to offset this volume of supply.
The debt spiral portfolio effects extend beyond borrowing costs: rising Treasury yields have compressed the S&P 500 equity risk premium to near multi-decade lows, and the increase in monthly mortgage payments on a median home loan since 2021 illustrates how government borrowing costs transmit directly into household budgets through the bond market rather than through any central bank decision.
The second force is subtler but structurally important. Leading technology companies are bringing substantial volumes of corporate bonds to market to finance capital-intensive infrastructure programmes. Pension funds and other large institutional allocators, who once treated Treasuries as the near-automatic destination for safe-asset capital, now weigh government bonds against a wider menu of high-grade corporate alternatives. That competition means the Treasury must price its debt attractively enough to clear auctions, which keeps yields higher than they would otherwise be.
The third force is the deepest. The term premium, the additional compensation investors require for holding long-duration bonds, has risen because persistent uncertainty about long-run inflation makes investors unwilling to assume a stable 2% path over decades. Inflation has remained above the Fed’s 2% annual target for multiple consecutive years.
Recent Fed research finds that most of the rise in longer-term rates reflects higher term premiums, not higher expected future short rates.
That distinction matters. Cutting the policy rate addresses expected near-term short rates. It does not compress the term premium, which is driven by inflation credibility and fiscal sustainability concerns that monetary policy alone cannot resolve. Academic estimates put the sensitivity at 20-30 basis points per 1 percentage point increase in the deficit-to-GDP ratio, and roughly 2-3 basis points per 1 percentage point increase in debt-to-GDP.
The New York Fed term premium model, which decomposes 10-year Treasury yields into expected short rates and the compensation investors demand for duration risk, shows that recent rises in long-term yields are driven predominantly by the term premium component rather than by upward revisions to expected future policy rates.
| Structural force | Mechanism | What would need to change | Current trajectory |
|---|---|---|---|
| Record deficit supply | More bonds at auction force higher yields to clear supply | Sustained deficit reduction via Congress | Deficits widening; interest expense compounding |
| Corporate bond competition | High-quality corporate debt diverts institutional demand from Treasuries | Reduced corporate issuance or deterioration in credit quality | Corporate issuance elevated, particularly in technology |
| Inflation uncertainty (term premium) | Investors demand extra compensation for purchasing-power risk over long durations | Sustained inflation at or below 2% target for multiple years | Inflation above target; term premiums elevated |
Knowing which of these forces is dominant at any given moment helps you assess whether a change in Fed policy is even relevant to your borrowing or investment decisions, or whether the variable to watch is fiscal news out of Congress.
The Fed’s retreat from forward guidance
What forward guidance was
Over approximately 15 years, forward guidance became the Fed’s most powerful lever. Carefully constructed public statements were capable of shifting trillions of dollars in asset values without any rate move being required. The entire effectiveness of the tool rested on one condition: that markets believed the Fed determined where interest rates ultimately landed.
That belief has eroded.
What the current shift signals
Under the current Fed chair, communications have become noticeably more restrained. Post-meeting statements have grown shorter, press conference language has moved away from explicit signposting, and the forward guidance that once anchored market expectations has been pulled back. Ahead of a high-profile central banking gathering attended by delegates from more than 70 countries and widely regarded as the most consequential Fed address of the year, the chair indicated he was approaching his remarks without a prepared script.
When the Fed chair described his most consequential annual address, delivered before central bankers from more than 70 countries, as something he was approaching without prepared notes, the signal was worth taking seriously.
That is a signal worth reading carefully. An institution that stops committing to where rates are heading may be implicitly reflecting that it does not determine where they go. As long-term yields become dominated by term premiums and fiscal risk, the direct link from Fed promises to long-term outcomes weakens. The fed funds rate has been held at 3.50-3.75% through mid-2026, with some dissent favouring hikes amid persistent inflation pressures.
The interpretation that this communication shift represents reduced control is analytical inference, not formally documented Fed position. But it is consistent with how forward guidance works in theory: the tool loses force when the institution behind it can no longer deliver the outcomes it signals.
For you, this means the value of front-running Fed communications to time rate-sensitive decisions has diminished. The real variable to watch is not the next FOMC statement; it is the fiscal and inflation data that drives the structural forces long-term yields are actually responding to.
What the Treasury buyback episode revealed about institutional limits
Earlier this year, the 30-year Treasury yield touched 5.33%, a level last seen in 2007, prompting the Treasury to step in with a market intervention.
The response looked reasonable on paper. The Treasury announced it would at least double its bond repurchase activity, entering the market as a buyer to support prices and reduce yields. Yields declined and equities rallied in the immediate aftermath.
Then the maths caught up. In practice, the Treasury was deploying roughly $4 billion per buyback operation against a total national debt stock of approximately $40 trillion, a ratio of around one part in ten thousand. Within roughly two trading days, the gains had been entirely reversed: the 30-year yield was back above 5.2% by Thursday and pushed higher still through Friday.
The setback was not a problem of poor implementation. It was a problem of proportion: a programme calibrated to a different era of fiscal conditions cannot reanchor a market where annual net supply runs to approximately $1.9 trillion and risk premiums remain structurally elevated.
The bond market’s rapid rejection of the intervention reflected the market’s collective assessment of the underlying fiscal numbers. Short-lived rallies followed by reversion to higher yields are exactly what you would expect when underlying supply and risk premiums remain unchanged. Any future announced “support measures” should be interpreted in the context of this ratio: until the fiscal trajectory changes, interventions at this scale are noise, not signal.
Three conditions that would actually move the needle
Achieving a durable decline in long-term borrowing costs depends on one of three distinct developments. Each sits beyond the scope of the Fed’s rate-setting decisions.
- Meaningful deficit reduction. When the government issues fewer bonds, auction supply falls and the Treasury can place debt at tighter yields. Academic estimates suggest 20-30 basis points of yield reduction per 1 percentage point improvement in the deficit-to-GDP ratio. Cutting the deficit is the most structurally clean route to lower long-term rates, but the decision rests with Congress rather than the Fed, which makes timing and execution deeply uncertain.
- Confirmed, durable inflation normalisation. When buyers see realised inflation holding near the 2% target over an extended stretch, the risk compensation they demand for committing capital over long durations begins to contract, and yields drift lower without any deliberate policy push. The emphasis is on demonstrated results, not guidance or intent. The Fed’s 2% annual target has not been consistently met for multiple years. Investors upgrade central-bank credibility over time based on outcomes, not statements.
- Recession-driven flight to safety. Historically, this is the swiftest and most dependable route through which long-term Treasury yields have fallen. During economic contractions, capital flows toward the safest available assets, bidding up Treasury prices and compressing yields in the process. The tradeoff is explicit: lower borrowing costs arrive alongside job losses, weaker earnings, and tighter credit conditions. The relief is real; the cost is severe.
| Condition | Transmission mechanism | Realistic timeline | Key dependency |
|---|---|---|---|
| Deficit reduction | Less supply at auction; lower yields to clear | Years (requires legislative action) | Congressional fiscal policy |
| Inflation normalisation | Lower term premium as purchasing-power risk recedes | 12-24 months of sustained performance | Realised CPI at or below 2% target |
| Recession | Flight to safety drives bond prices up, yields down | Rapid once contraction begins | Economic downturn (with significant costs) |
What unites all three paths is equally clear. Each operates beyond the Fed’s immediate reach. Lower long-term borrowing costs are achievable, but only through developments that have no connection to the timing of the next policy rate adjustment. That reframes what you should be watching in financial news.
What this means for anyone watching bond markets now
Long-term yields are pricing fiscal and inflation realities accurately. Until one of the three conditions above materialises, the gap between where the Fed’s rate sits and where the 10-year trades will persist. The 175 basis points of cuts already delivered have not closed that gap, and more cuts of the same kind would face the same structural resistance.
For financial decisions tied to long-term borrowing costs, whether mortgage timing, business investment, or fixed-income portfolio positioning, the relevant inputs are fiscal and inflation developments rather than Fed meeting calendars. Anchoring those decisions to FOMC announcement dates means watching the wrong variable.
The 10-year yield and mortgage pricing are mechanically linked through a historical spread of approximately 2 percentage points, which is why the 175 basis points of Fed cuts delivered since September 2024 have not produced any relief for homebuyers: the spread sits between the benchmark Treasury and the mortgage rate, not between the overnight policy rate and the mortgage rate.
Institutional portfolio repositioning away from long-duration nominal Treasuries is already underway: BlackRock, JPMorgan, Goldman Sachs, and Bridgewater have independently reached convergent positioning conclusions, each reducing long-duration exposure and rotating toward real assets and inflation-linked strategies as the fiscal trajectory becomes a baseline rather than a tail risk.
The forward indicators that matter most now are:
- FY2027 deficit trajectory and any congressional action on spending or revenue
- Sustained CPI performance relative to the 2% target (months of data, not a single print)
- Material shifts in growth expectations that could trigger recession-driven demand for Treasuries
- Term premium estimates from Fed models, which signal whether long-duration risk appetite is changing
These are the variables that will determine where your borrowing costs go. The next FOMC statement is not one of them.
This article is for informational purposes only and should not be considered financial advice. Investors should conduct their own research and consult with financial professionals before making investment decisions. Past performance does not guarantee future results. Financial projections are subject to market conditions and various risk factors.
—