
Gold just broke its 200-day moving average, touched three-month highs above $4,681, and is now sitting in a zone where major banks say $5,000 is a credible 2026 target. All of this happened in the same week the US Treasury announced what it called an “unprecedented” sanctions campaign against Iran.
That is not a coincidence. Monday’s rally was not driven by a single variable. Operation Outcast, a sweeping US sanctions programme that placed restrictions on approximately 60 Iran-linked entities spanning jurisdictions including the UAE, Hong Kong, China, Singapore, Switzerland, and Europe, pushed geopolitical risk measurably higher. At the same time, the 10-year Treasury yield slipped 3.5 basis points to settle at 4.700%, a move that lowers the cost of holding a non-yielding asset like gold. And the 200-day simple moving average (SMA) at $4,516, a level that had previously capped rallies, was not only broken but held as support.
The 10-year Treasury yield slipping 3.5 basis points on Monday mattered not because of the nominal move but because of what it did to real yields, the true opportunity cost of holding gold, which respond to inflation expectations as much as to headline rate moves.
When macro catalysts, yield dynamics, and technical confirmation all align in the same session, the move deserves serious attention. Here is the macro catalyst, the specific price levels that determine whether the bull case stays intact, the momentum signals that would flash a warning before any reversal, and a three-scenario framework you can use to calibrate your own gold exposure right now.
What just moved gold to three-month highs, and why this week is different
US Treasury Secretary Scott Bessent called the sanctions “unprecedented,” and the scope backs up the language. Operation Outcast targets Tehran’s most critical revenue streams across five sectors and six jurisdictions, a scale that separates this from a typical one-country, one-sector penalty.
“Unprecedented” is the word Secretary Bessent used to describe Operation Outcast, a sanctions programme intended to close off every avenue of financing available to Iran’s Islamic Revolutionary Guard Corps (IRGC), covering five sectors: digital assets, technology, gold, aviation, and shipping.
The sanctions cover entities operating in the following regions:
- UAE, Hong Kong, China (Asia-Pacific broker networks)
- Singapore, Switzerland, Europe (shadow fleet vessels and intermediary firms)
The five sectors subject to restrictions are:
- Digital assets
- Technology
- Gold
- Aviation
- Shipping

That breadth matters. A single-sector sanction creates a one-day safe-haven spike. A multi-sector, multi-jurisdictional campaign creates the kind of sustained geopolitical uncertainty that historically supports gold over weeks and months rather than hours.
Gold touched an intraday high of $4,681 before settling near $4,631, a daily gain of approximately 0.62%. Notably, the US Dollar Index (DXY) was also trading higher on the day, up 0.22% to 99.05, which is an unusual pairing. Normally, gold and the dollar move inversely. When gold advances on a day the dollar also firms, it tells you the geopolitical bid is not simply dollar weakness in disguise. It is structural safe-haven demand, and that distinction matters for how long this support lasts.
When big ASX news breaks, our subscribers know first
The technical map: what gold needs to close above before $5,000 becomes a trade, not a target
The 200-day SMA at $4,516 is where this move’s credibility starts. Gold cleared it during the prior Friday’s session and, rather than being rejected back below, held the level as support through Monday’s rally. That sequence, breakout followed by a successful hold, is the first confirmation that buyers are committed rather than speculative.
From here, the path to $5,000 runs through a series of gates, each with its own confirmation requirement. The price levels matter, but so does how gold clears them. An intraday spike above a level proves interest. A daily or weekly close above it proves commitment.
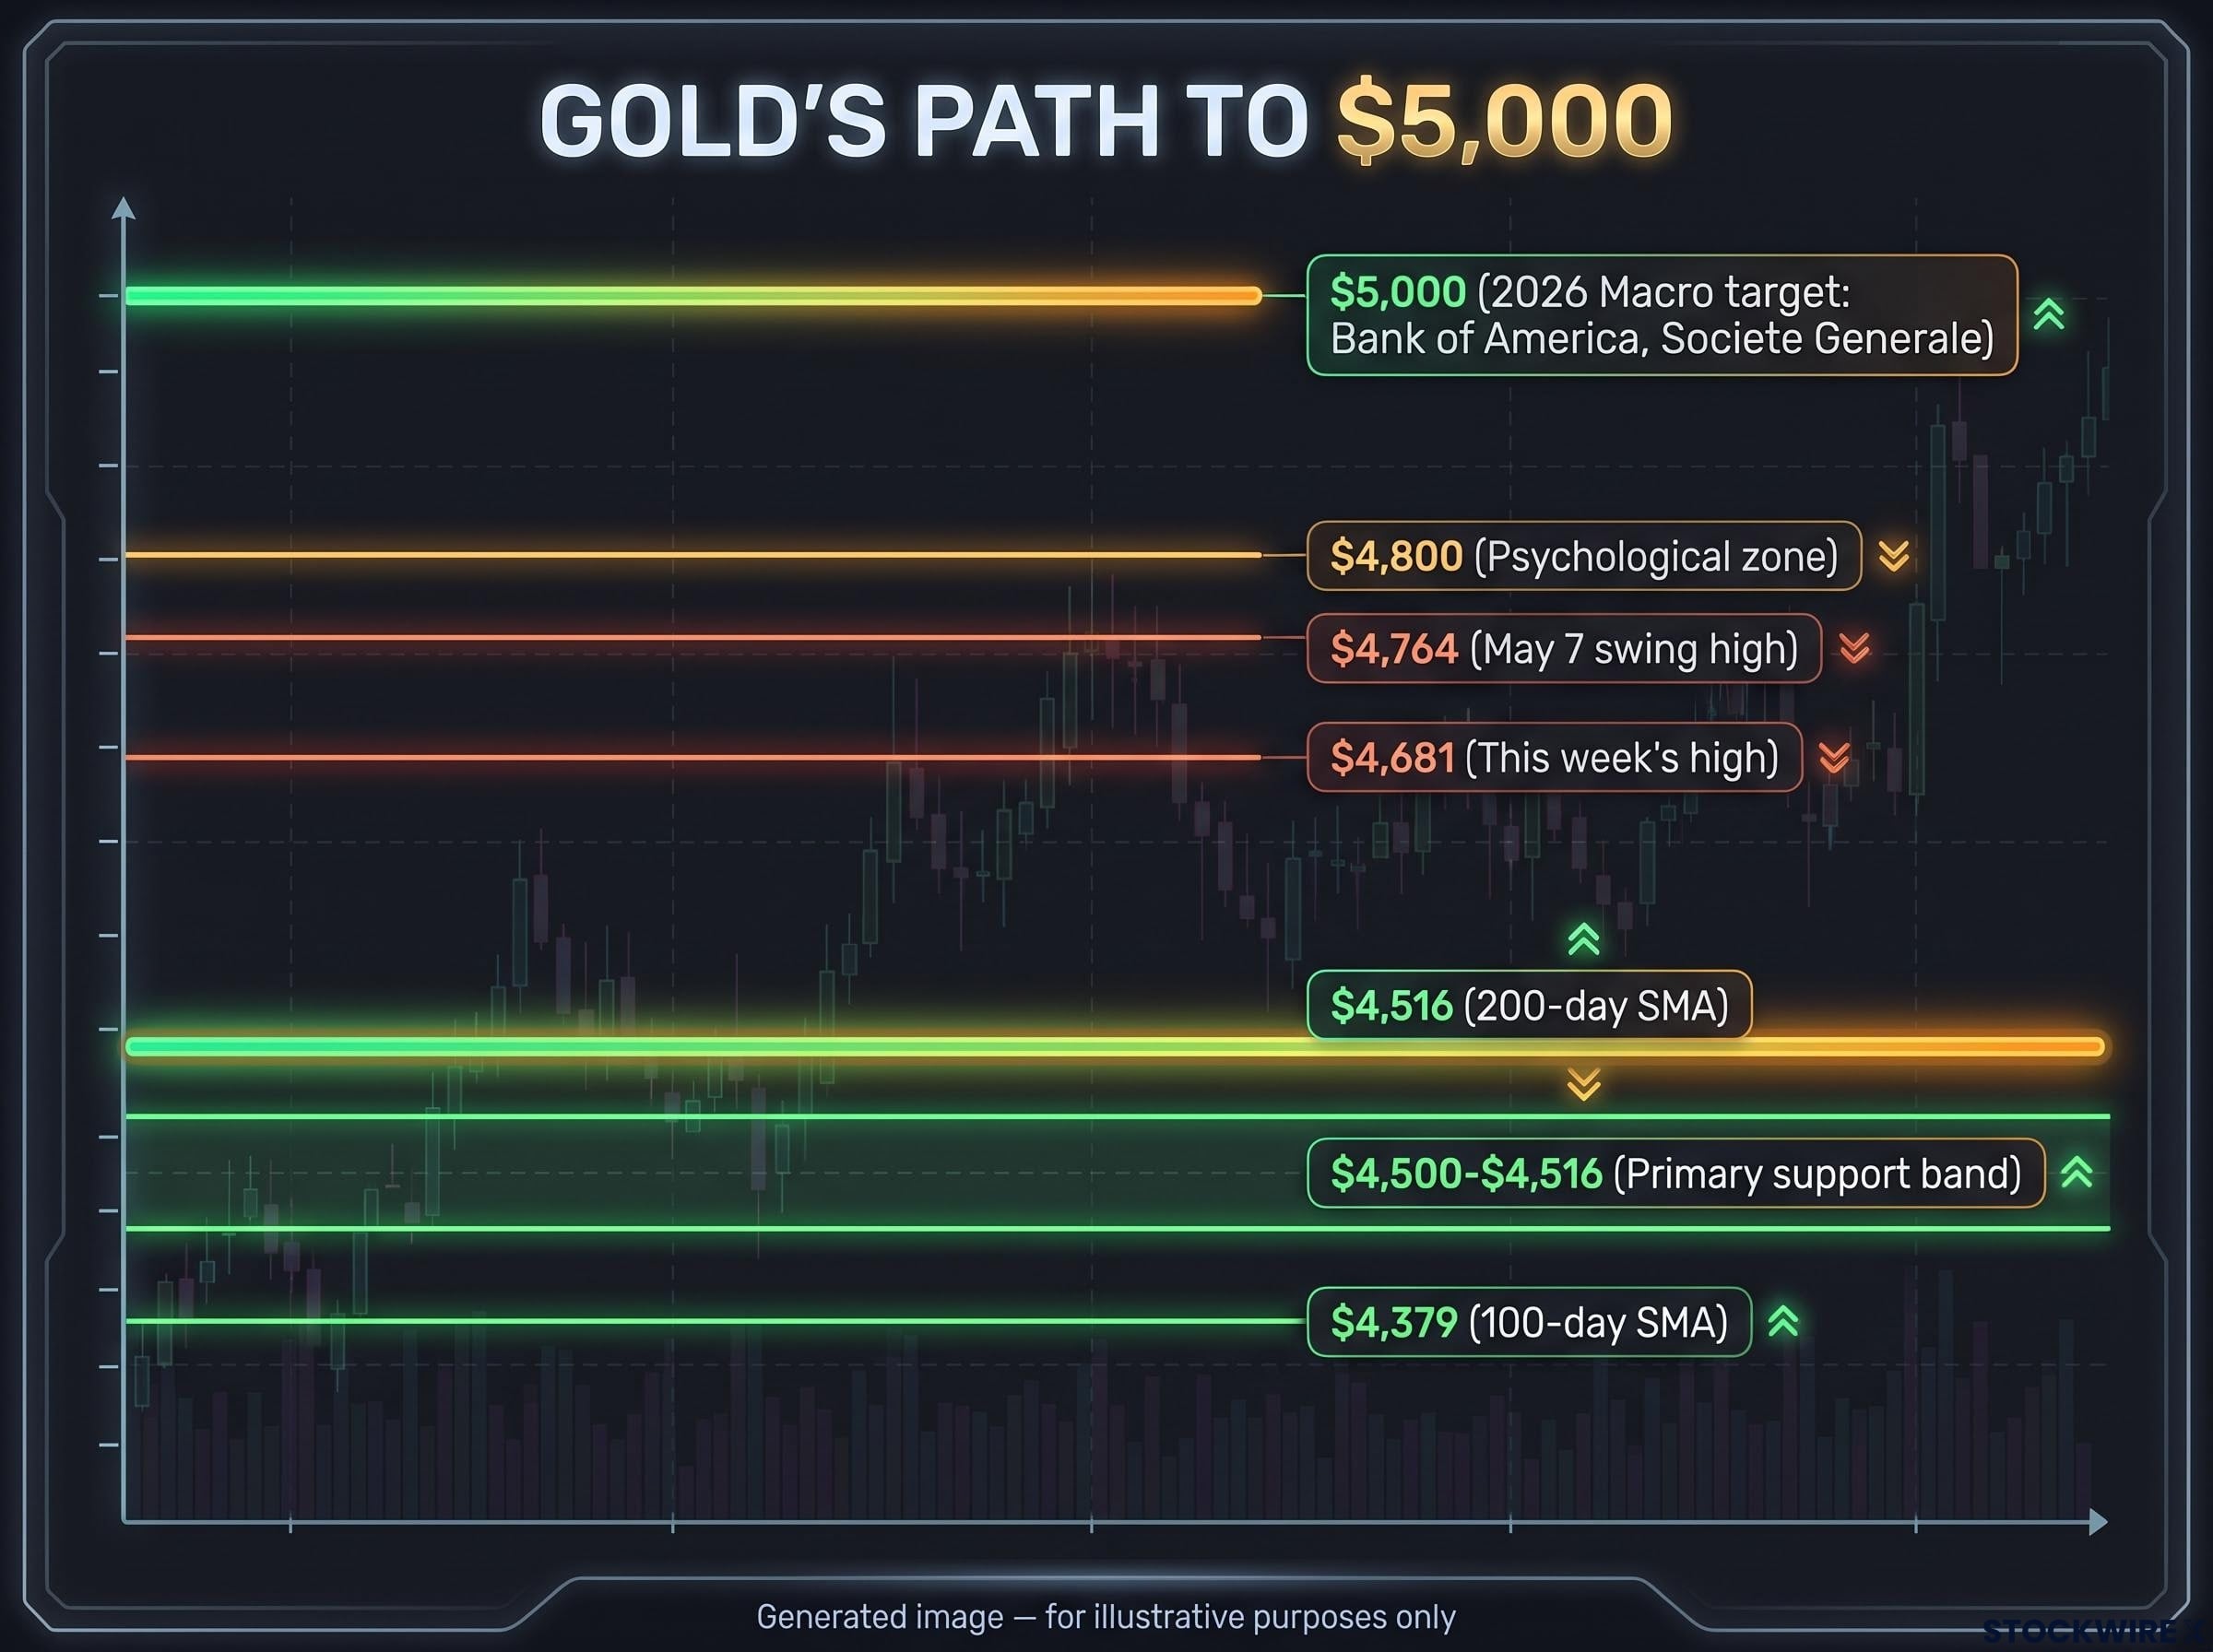
| Level | Price | Type | Significance | Confirmation |
|---|---|---|---|---|
| 200-day SMA | $4,516 | Support | Breakout foundation; bull/bear line | Daily close above |
| This week’s high | $4,681 | Resistance | First hurdle; already tested | Daily close above |
| May 7 swing high | $4,764 | Resistance | Gatekeeper to $4,800 zone | Sustained break and close |
| Psychological zone | $4,800 | Resistance | Options hedging and profit-taking | Weekly close above |
| Macro target | $5,000 | Resistance | Institutional target (BofA, SocGen) | Macro conditions sustained |
| Primary support band | $4,500-$4,516 | Support | 200-day SMA + round-number cluster | Daily close below = failed breakout |
| 100-day SMA | $4,379 | Support | Deeper structural floor | Triggers medium-term reassessment |
The $4,764 level, the 7 May swing high, is the gatekeeper. A sustained break and close above it would strongly suggest the broader uptrend that produced prior all-time highs is resuming. Above that, expect heavier two-way trade around $4,800, where options-related hedging flows and profit-taking from early longs will create friction.
Bank of America has lifted its 2026 outlook to a $5,000 target. Societe Generale projects $5,000-$6,000 by end of 2026 or shortly thereafter. Above $4,800, there is relatively little historical price structure, meaning round-number magnetism and macro narratives will dominate direction.
Bank of America and Societe Generale anchoring their $5,000-$6,000 targets to sustained macro conditions is consistent with the structural floor created by central bank demand, which has run above 1,000 tonnes annually since 2022 and is insulated from the short-term yield and dollar fluctuations that drive retail positioning.
Where the bull case breaks down: support levels that matter
The $4,500-$4,516 band is where the breakout thesis lives or dies. The clustering of the 200-day SMA and round-number psychological support creates a strong dip-buying zone, the kind of level where institutional buyers historically step in.
A daily close below $4,516 is the signal that the breakout is failing. If that happens, follow-through selling toward $4,379, the 100-day SMA, becomes likely and would force a medium-term reassessment of the bull narrative. For a reader with exposure to gold, $4,500-$4,516 is the number to have saved: as long as daily closes hold above it, there is no structural reason to reduce a long position on a pullback alone.
What RSI above 70 actually means here, and the one signal that would change the picture
The Relative Strength Index, a momentum indicator that measures the speed and magnitude of recent price changes on a scale of 0 to 100, is currently reading 68-72 on daily and hourly charts. During Monday’s session, the indicator pushed through the 70 threshold.
The instinct many readers will have is that RSI above 70 means “overbought” and therefore means “sell.” That reading is too blunt. When price has just broken a long-term moving average on the back of a clear macro catalyst, momentum tends to remain elevated for an extended period, and RSI can sustain levels of 80-85 before any meaningful top materialises. A high RSI in this environment is a signal that momentum is running hot, not that a turning point is at hand.
The higher-quality warning signal is bearish divergence, and it is worth understanding precisely.
Bearish divergence: RSI making lower highs while price makes higher highs. This is the signal that momentum is fading beneath the surface even as price looks strong.
Here is how to use the distinction:
- Elevated RSI alone signals that momentum is extended, consistent with a strong trend, not automatically a reason to exit
- Bearish divergence signals fading momentum beneath new price highs, warranting genuine caution and potential risk reduction
A reader who understands bearish divergence will not panic-exit a position because RSI crossed 70. They will instead monitor whether price highs are being confirmed by momentum highs, which is a far more reliable trigger for risk reduction.
Until that divergence appears, elevated RSI is consistent with the breakout thesis above the 200-day SMA.
Three scenarios, three positioning frameworks: how to use this setup
These are not predictions. They are a decision map. Your job is to monitor which scenario’s conditions are accumulating, and adjust exposure accordingly.
- Bullish base case (most aligned with current conditions)
- Trigger: Gold respects the $4,516 support band on any pullbacks; geopolitical tensions persist at current levels without material de-escalation
- Price path: Gold grinds higher, retests $4,681, then the $4,764 swing high; a confirmed break of $4,764 opens the path to $4,800, with consolidation likely before any sustained move toward $5,000
- Positioning implication: Hold existing long exposure; add on pullbacks toward $4,500-$4,516 if risk tolerance allows
- Bullish acceleration
- Trigger: Geopolitical tensions escalate further (counter-measures to sanctions, broader regional instability); real yields drift lower and Fed expectations tilt more dovish
- Price path: Gold moves through $4,681 and $4,764 quickly, tests $4,800, and can spike toward $5,000 faster than the base case anticipates; RSI pushes into the 80-85 range without immediate bearish divergence
- Positioning implication: A faster move compresses the decision window; trailing stops become more important than entry timing
- Bearish risk
- Trigger: Daily close below $4,516 signals a failed breakout; macro triggers include de-escalation of Operation Outcast, a meaningful rise in Treasury yields, or a sharp and sustained dollar rally
- Price path: Follow-through selling pushes price toward $4,379 (100-day SMA) and potentially back into a broader consolidation range
- Positioning implication: Reduce long exposure on a daily close below $4,516; the $5,000 narrative becomes more distant and the analytical focus shifts to whether the multi-year bull market has entered a consolidation phase
A move from approximately $4,650 to $5,000 represents roughly 7-8% upside over a 6-18 month horizon, well within normal gold volatility if the macro conditions hold.
Each scenario gives you a trigger to watch, not a prediction to follow. Monitor whether the conditions for your preferred scenario are accumulating or deteriorating, and size your exposure accordingly. The four macro signposts that determine which scenario unfolds are: Operation Outcast developments, 10-year Treasury yield direction, DXY trajectory, and ETF and institutional inflows into gold.
The four macro signposts that determine scenario outcomes operate within a broader context of structural demand shifts, including the emergence of Asian retail ETF buyers and accelerating central bank reserve diversification, that provide a demand floor largely independent of any single geopolitical catalyst.
The $4,516 line holds the whole story
Everything in this analysis compresses to a single structural level: $4,516, the 200-day SMA that gold broke, held, and now relies on to keep the bull thesis intact. If daily closes stay above it, the breakout is valid and the path through $4,764 toward $5,000 remains open.
The four variables that will tell you whether that holds:
- Operation Outcast developments: Escalation sustains safe-haven demand; de-escalation removes it
- 10-year Treasury yield: Declining or stable yields reduce the opportunity cost of holding gold; rising yields create friction
- DXY trajectory: A modest dollar does not threaten the thesis; a sharp, sustained rally does
- ETF and institutional flows: Continued inflows amplify the trend; outflows signal the institutional consensus is shifting
$5,000 is achievable within normal volatility on a 6-18 month horizon, according to forecasts from Bank of America and Societe Generale. But it requires the conditions that created this week’s rally to persist or intensify, not merely to hold. The $4,516 closing level will tell you whether the thesis has broken before the headlines do.
The institutional consensus behind $5,000 targets also reflects sovereign debt dynamics that have structurally reduced the safe-haven and diversification value of government bonds, shifting reserve managers and institutional allocators toward gold in a way that is independent of any single sanctions campaign or yield move.
This article is for informational purposes only and should not be considered financial advice. Investors should conduct their own research and consult with financial professionals before making investment decisions. Past performance does not guarantee future results. Financial projections are subject to market conditions and various risk factors.