Central banks collectively bought more gold in 2022 than in any year since records began in 1950. Then they did it again. And again. For three consecutive years, official-sector purchases exceeded 1,000 tonnes, a threshold never previously reached. In parallel, institutional investors responded through gold-backed exchange-traded funds (ETFs), vehicles that let large asset managers buy and sell gold exposure at scale, pouring in their largest half-year inflows since 2020.
That convergence is not background noise. Gold is doing something categorically different from the periodic fear-trade spikes of prior decades. The relevant question is not what gold’s spot price did last week but why the world’s most systemically consequential institutions, sovereign central banks and trillion-dollar asset managers alike, are structurally repositioning around it at the same time.
What follows is a framework for reading institutional gold flows as a macroeconomic signal rather than a sentiment indicator. By the end, you will understand what the convergence of ETF inflows and central bank buying reveals about how major institutions are pricing systemic risk in 2025 and 2026, and why that signal carries implications well beyond the gold market itself.
Three years of record central bank buying: what the numbers actually say
Start with 2022. Official-sector institutions accumulated a net 1,136 tonnes of gold, a total the World Gold Council (WGC) valued at approximately $70 billion. That represented more than twice the ~450 tonnes acquired in 2021, making it the single largest annual addition to central bank reserves across a data series spanning over seven decades, per WGC demand reports.
The WGC Gold Demand Trends 2022 report confirmed the 1,136-tonne figure as a 55-year record high, anchoring the quantitative baseline from which subsequent years of official-sector accumulation are measured.
1,136 tonnes in 2022: a figure representing the single largest annual addition to sovereign gold reserves on record, comfortably exceeding twice the volume purchased the year before.
The following year moderated only slightly. In 2023, net official-sector purchases came in at approximately 1,037 tonnes, accounting for roughly one-quarter of total global gold demand. Then 2024 delivered a third consecutive year above the threshold: approximately 1,045-1,092 tonnes.
In 2025, the pace stepped down to 863 tonnes. That moderation deserves honest acknowledgement, but it also deserves context. The 2010-2021 average was approximately 473 tonnes per year. Even the 2025 figure sits roughly 82% above that baseline.
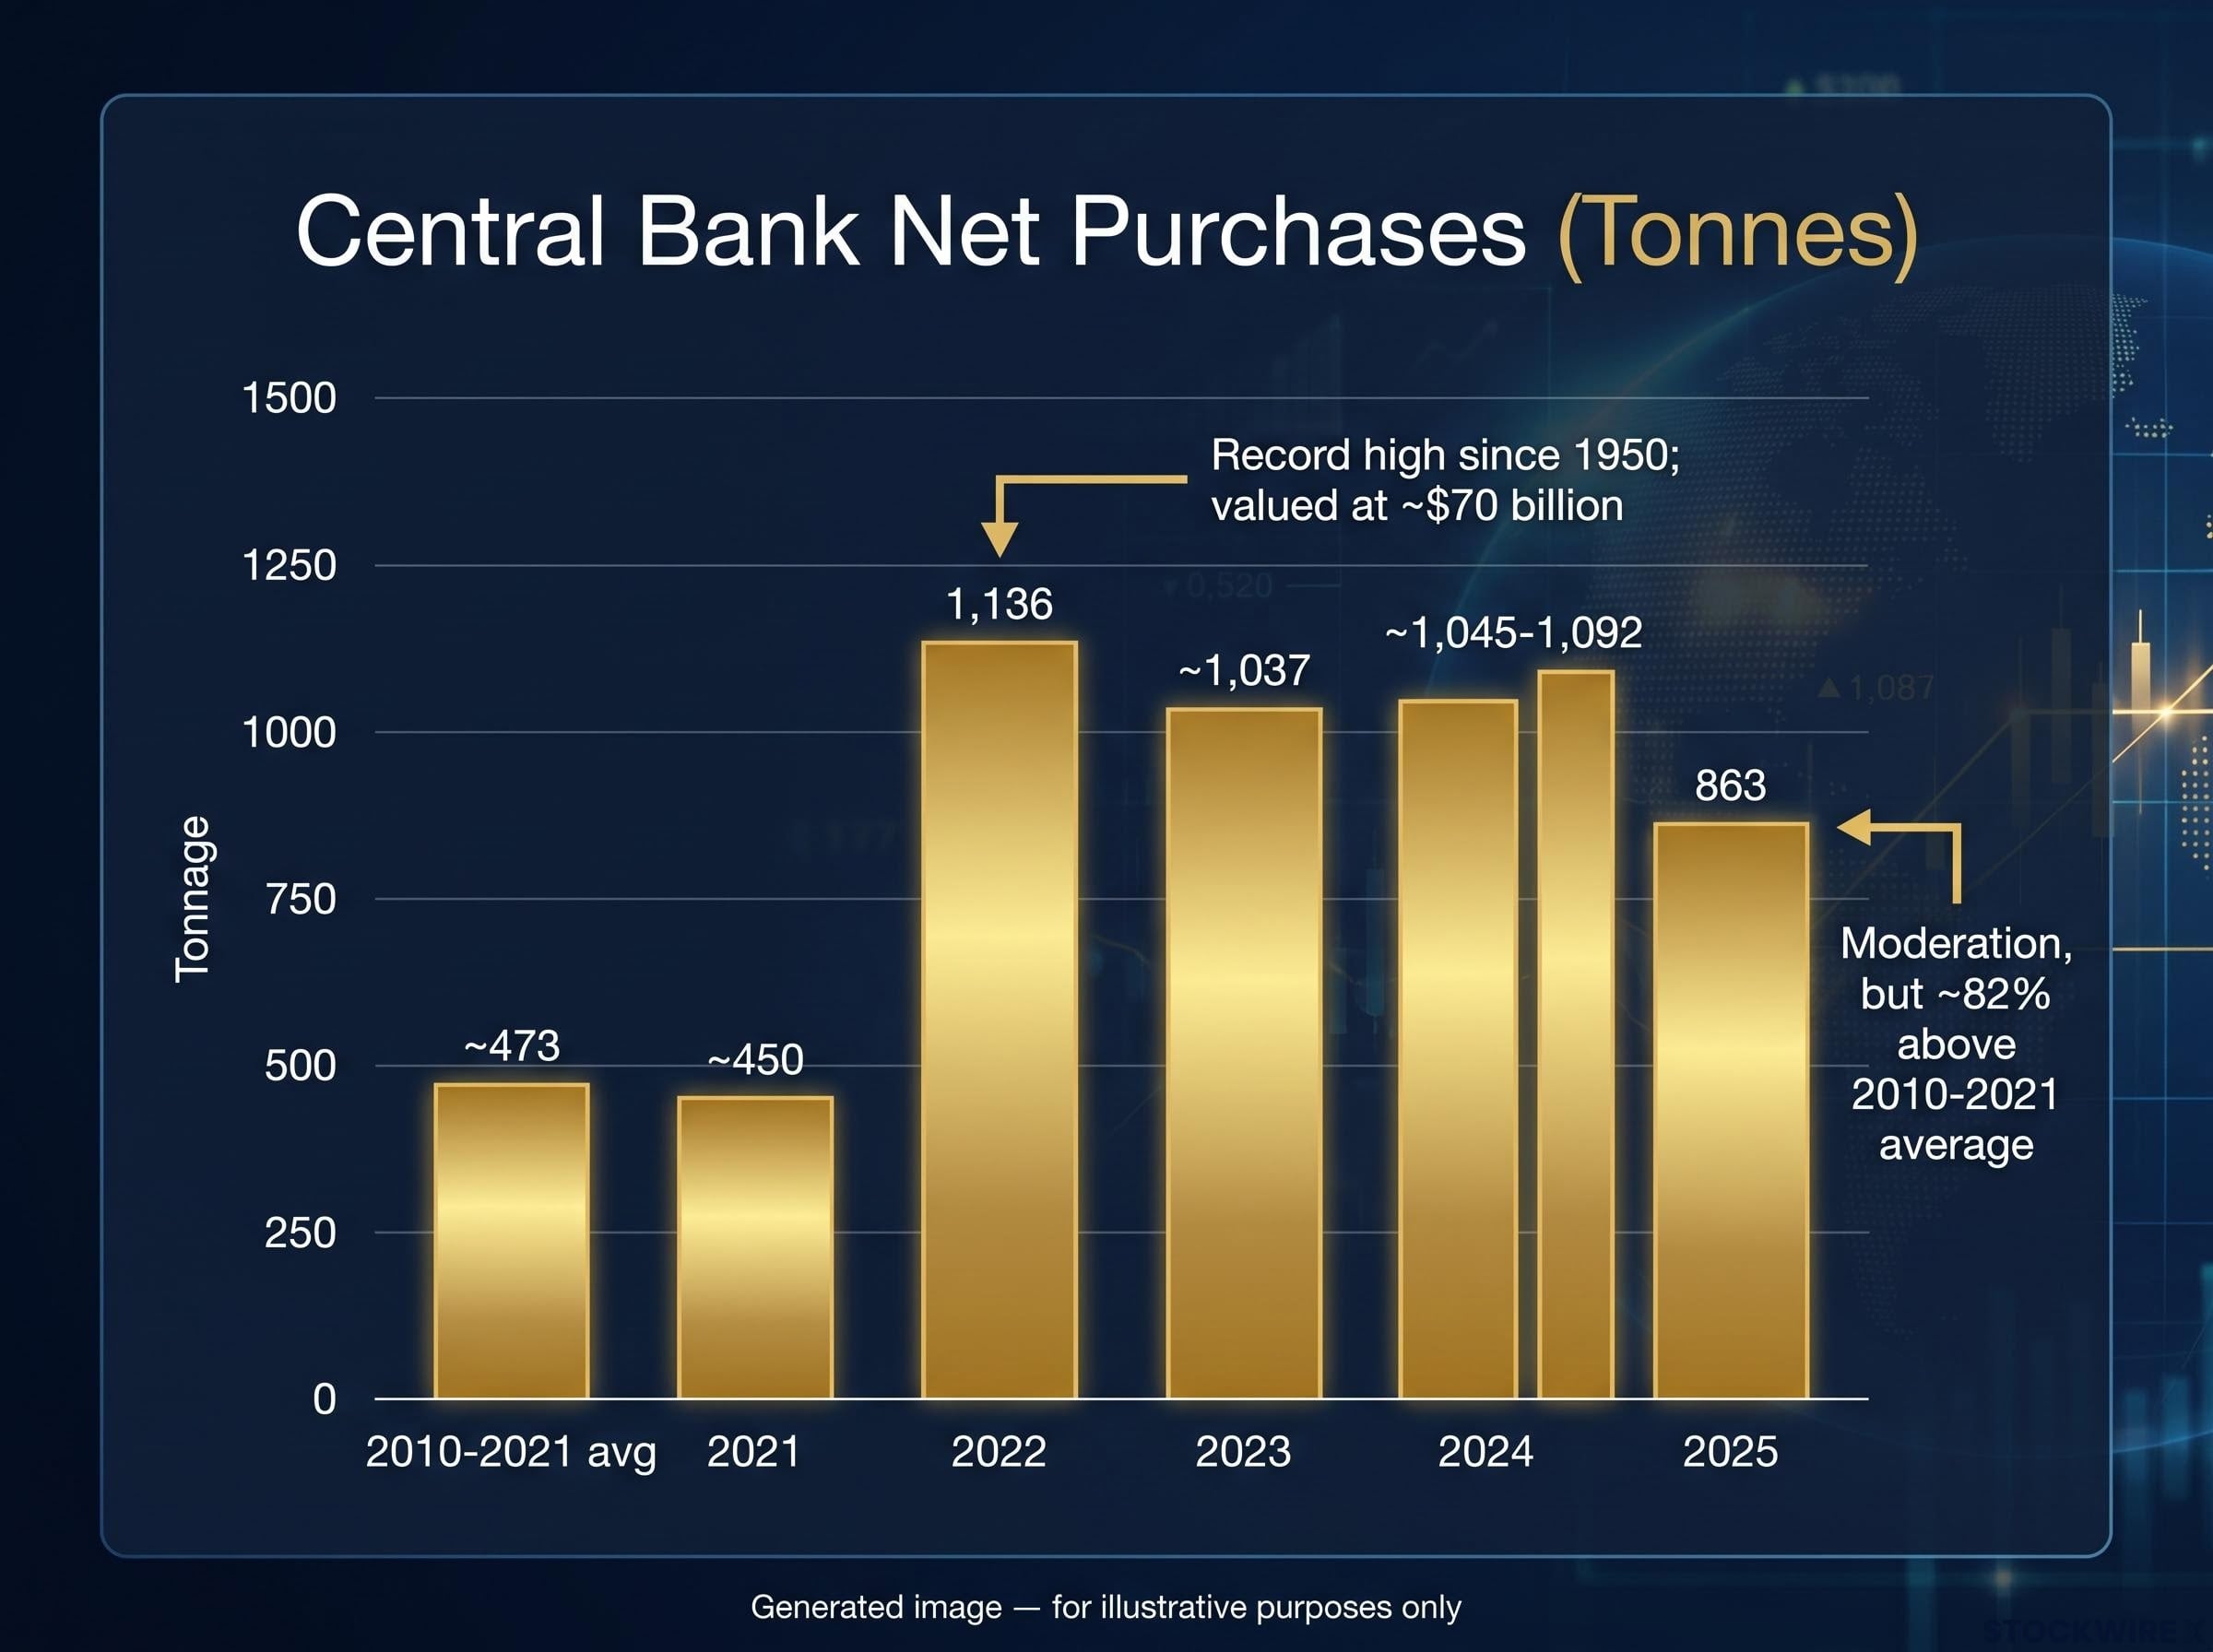
| Year | Central Bank Net Purchases (tonnes) | Year-on-Year Change | Notable Context |
|---|---|---|---|
| 2010-2021 avg. | ~473 | Baseline | Historical reference period |
| 2022 | 1,136 | +152% vs 2021 | Record high since 1950; linked to geopolitical uncertainty and inflation |
| 2023 | ~1,037 | -8.7% | ~25% of total global gold demand |
| 2024 | ~1,045-1,092 | Roughly flat | Third consecutive year above 1,000 tonnes |
| 2025 | 863 | -17% to -21% | Moderation, but still ~82% above 2010-2021 average |
Three consecutive years above 1,000 tonnes is not a coincidence or a geopolitical reflex. It represents a generational shift in how sovereign institutions are structuring their balance sheets. The 2025 figure confirms the new baseline rather than threatening it.
Who is buying, and why it matters which countries lead
The buyers driving this trend are not advanced-economy central banks rotating marginal allocations. They are emerging-market sovereigns with distinct but structurally related motivations.
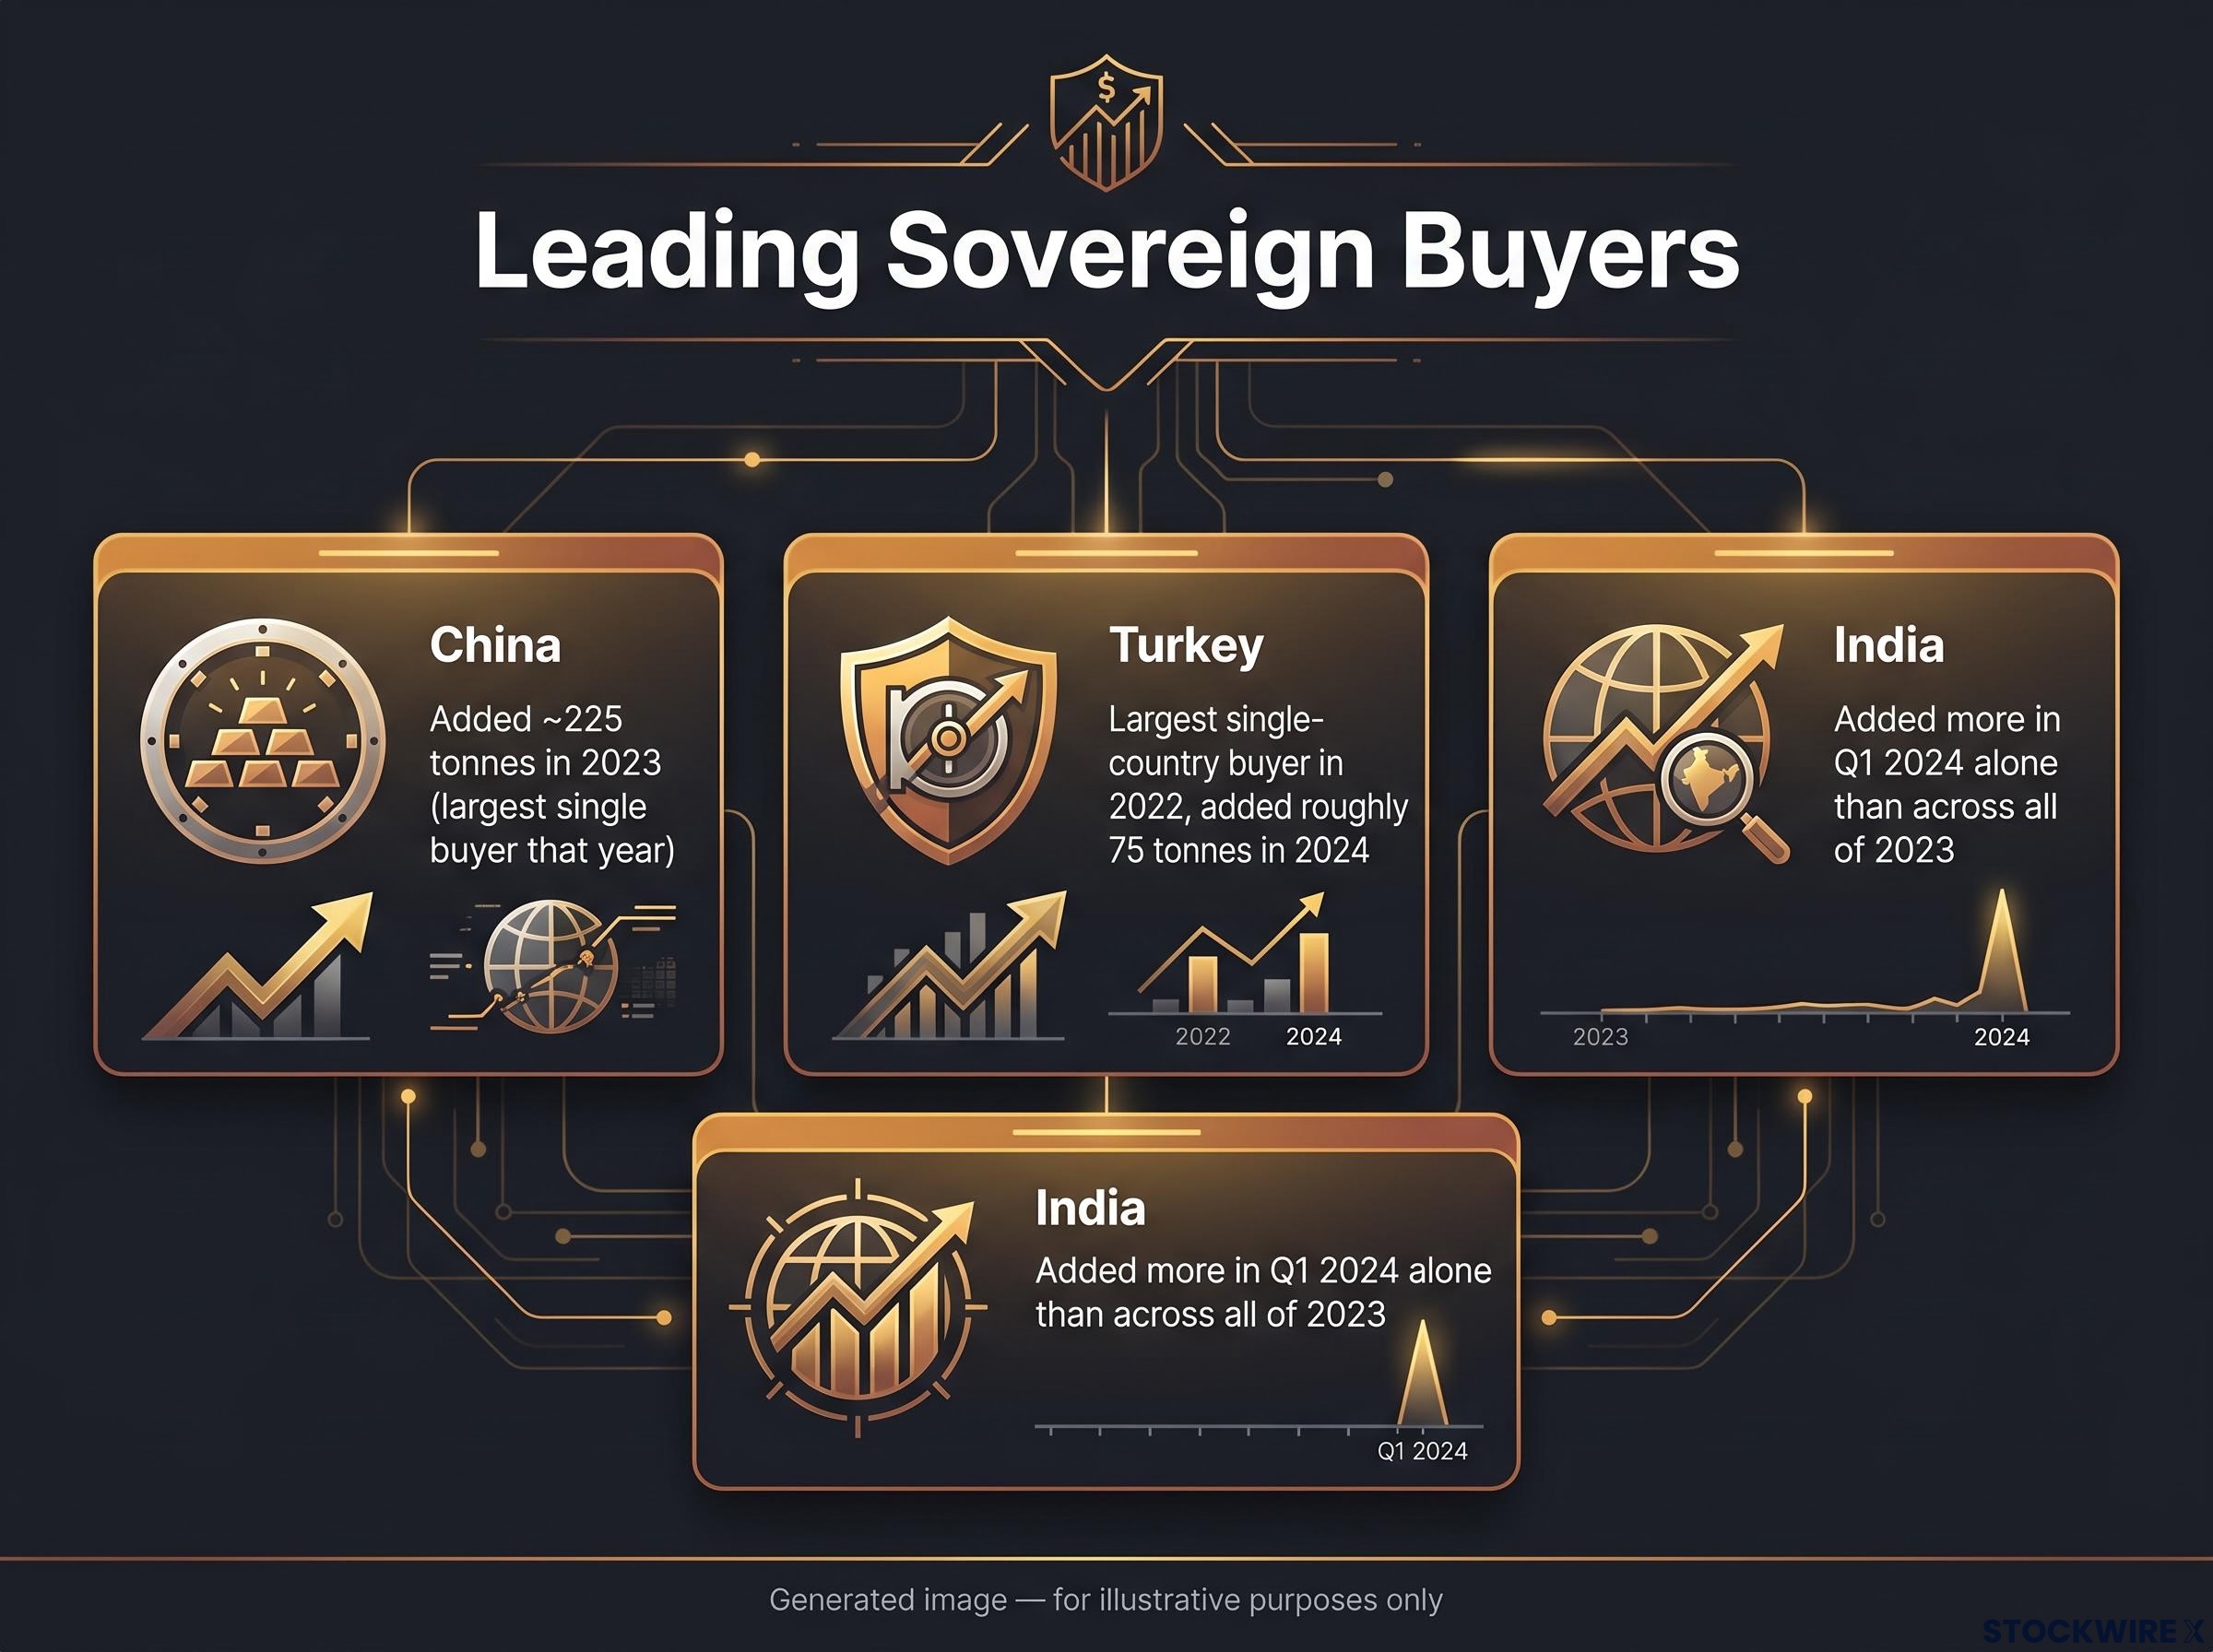
China’s People’s Bank of China added a cumulative ~225 tonnes in 2023 alone, making it the largest single buyer that year, with steady additions continuing through 2024. China’s rationale centres on reducing dependence on dollar-denominated reserves. Turkey was the largest single-country buyer in 2022 and returned to significant net purchases in 2024, adding roughly 75 tonnes despite persistent domestic currency pressures, using gold as a reserve anchor. India’s Reserve Bank added more in Q1 2024 alone than across all of 2023, reflecting methodical, long-horizon reserve growth.
Each country illustrates a different facet of the same structural calculation: the assets they previously relied on for reserve security are no longer sufficient on their own.
When big ASX news breaks, our subscribers know first
What gold ETF inflows reveal about institutional portfolio thinking
Central banks operate on multi-year planning horizons. Gold ETFs capture a different layer of institutional conviction, one that moves faster and responds to shorter-term risk signals. When both layers point in the same direction, the combined message is analytically sharper than either alone.
The key data points from gold ETF flows in 2025 tell a clear story of sustained positioning, not a single-week spike:
- H1 2025 aggregate: approximately $38 billion in net inflows, adding roughly 397 tonnes, the largest half-year since 2020
- Weekly inflow episode (original source): 46.7 tonnes (approximately $6.4 billion), a ten-month peak for single-week inflows according to WGC data, with demand concentrated in North American and European-listed products
- Weekly inflow episode (early 2025): approximately 52.4 tonnes (~$5 billion), the largest weekly influx since March 2022, driven primarily by US-listed products
These are distinct episodes, not competing accounts of the same week. Together, they illustrate a pattern of recurrent, large-scale institutional demand.
H1 2025: $38 billion in net inflows, roughly 397 tonnes added. The largest half-year gold ETF inflow since 2020.
Gold ETFs serve as liquid, scalable, balance-sheet-efficient proxies for gold exposure. Their primary users are asset managers, hedge funds, and pension funds, institutions that can scale positions up or down quickly. The sustained half-year aggregate is the signal worth weighting most heavily. It tells you that major portfolio allocators are not reacting to a single geopolitical headline but are persistently increasing their structural gold allocation. That is a different and more consequential message than any individual weekly spike can deliver.
The stock-bond correlation breakdown documented by the BIS in 2022-2023 is part of the same structural picture: institutional allocators who previously relied on government bonds as portfolio diversifiers are now treating gold as a replacement, a shift that reinforces the ETF inflow trend from the demand side of the portfolio rather than the reserve-management side.
Why gold now? The structural logic behind sovereign and institutional accumulation
The data sections above establish what is happening. This section addresses why.
Gold’s structural characteristics as a reserve asset are well understood in central banking circles but often under-explained in financial commentary aimed at investors. The properties that matter most:
- No counterparty risk: gold is not another institution’s liability
- No issuer risk: it is not tied to any single government’s creditworthiness
- Cannot be frozen or sanctioned: unlike foreign-currency reserves held in other nations’ banking systems
- Finite supply: mine production cannot scale quickly to meet surges in demand
- Universal recognition: accepted as a reserve asset across every major central bank framework globally
The post-2022 environment gave these properties fresh operational weight. When foreign-currency reserves held in Western banking systems demonstrated their vulnerability to sanctions, sovereign institutions with even modest geopolitical exposure re-evaluated what “safe” reserves actually meant. WGC surveys consistently show emerging-market central banks citing geopolitical fragmentation, sanctions exposure, and long-term currency stability as primary motivations for increasing gold holdings.
The dollar-reserve de-dollarisation trend underlying these purchases reached a symbolic milestone in mid-2026, when OMFIF survey data showed, for the first time on record, that more central banks declared intentions to reduce dollar holdings than to increase them.
The convergence signal: when ETF buyers and central banks agree
When both slow-moving sovereign institutions and faster-moving institutional asset managers are increasing gold exposure simultaneously, the signal compounds. Central bank purchases indicate that sovereign institutions expect persistent structural vulnerabilities in the global monetary and geopolitical system and are adjusting their reserve architecture accordingly. ETF inflows indicate that large portfolio allocators are increasingly wary of near-term risk and reward in equities and credit and are allocating defensively.
The fact that central bank net buying exceeded 1,000 tonnes for three straight years while ETF flows recorded their largest half-year gains in several years tells you that institutional concerns are both cyclical and structural. Major institutions are not simply reacting to headlines. They are embedding gold more deeply into long-term policy and portfolio frameworks. For a central bank, the decision to accumulate gold at this scale is a statement about which risks they believe are not priced correctly anywhere else in their reserve portfolio, and the sustained pace of buying indicates those institutions have not changed their view.
Caveats that belong in any honest analysis of gold flows
The structural case is real. It is also not unconditional. Three caveats deserve equal analytical standing:
- Opportunity cost is real. Gold generates no yield. In periods of high real interest rates, the cost of holding gold instead of income-producing instruments, such as government bonds paying meaningful real returns, has historically been material. Gold’s role as a long-horizon diversifier does not eliminate this drag on portfolio performance during such environments.
- ETF flows are reversible. Inflows driven partly by acute geopolitical tension can unwind if those tensions ease. The structural case may remain intact while the tactical positioning reverses. Readers who conflate ETF flow direction with the structural thesis are misreading the signal.
- Official data can be opaque. China and Russia disclose gold purchases with lags or not at all. Turkey uses swaps and other operations that complicate headline reserve figures. The resulting data uncertainty cuts in both directions: actual buying may be higher or lower than reported.
2025 moderation: 863 tonnes. Down from the 2022-2024 average of roughly 1,070 tonnes, but still nearly double the 2010-2021 historical average of ~473 tonnes.
The 2025 moderation to 863 tonnes illustrates real variability around the elevated trend. It should caution against assuming the 1,000-tonne-plus pace was a permanent new normal. Gold’s role is best understood as long-horizon insurance and diversification, not a reliable short-term inflation tracker or a substitute for income-producing assets. Readers who treat the institutional buying signal as a simple buy endorsement are misreading what the data actually says.
For readers wanting to understand why this structural thesis does not translate into reliable short-term price signals, our full explainer on gold price prediction documents three rate cycles where gold moved in the opposite direction from what the most widely cited trading rules would have forecast.
This article is for informational purposes only and should not be considered financial advice. Investors should conduct their own research and consult with financial professionals before making investment decisions.
What this signals beyond gold itself
The three-year central bank buying cycle and H1 2025 ETF inflow data jointly confirm a structural thesis. Three implications follow:
- A higher and more resilient demand floor under gold prices. Official-sector purchasing is far less sensitive to short-term price swings than speculative flows. Even the moderated 2025 figure leaves that floor materially stronger than in prior decades.
- A broad reassessment of systemic risk. The pattern of buyers and their stated motivations, dollar-dominance concerns, sanctions risk, inflation regime uncertainty, reflects not a reaction to a single crisis but a recalibration of reserve architecture across emerging-market institutions.
- Ongoing pressure on an inelastic supply profile. Gold mine supply cannot scale quickly. Persistent demand from both sovereign and institutional buyers tightens that constraint over longer horizons.
For finance professionals reading institutional flow data, gold is increasingly being treated less as a short-term fear trade and more as a counterparty-free, sanctions-resistant structural reserve. That reclassification carries implications for how risk and resilience are priced across the global financial system, not just within the gold market.
Private credit opacity compounds the systemic risk picture: the ECB has mapped approximately 425 billion euros in private credit exposure across European insurers, banks, and pension funds, identifying a category of opaque institutional risk that shares the same structural logic driving gold accumulation, namely that standard reserve and portfolio instruments carry hidden second-order vulnerabilities.
Whether the structural case continues to be confirmed depends on whether the conditions driving it persist: dollar-dominance concerns, sanctions risk, and inflation regime uncertainty. The 2025 data gives no indication of a reversal. If there is one thing the institutional flow data tells you clearly, it is this: the world’s most systemically important institutions have priced in a world where the instruments they previously relied on for reserve security are no longer adequate on their own. That is a signal worth understanding regardless of where gold’s spot price sits on any given day.
Past performance does not guarantee future results. Financial projections are subject to market conditions and various risk factors.