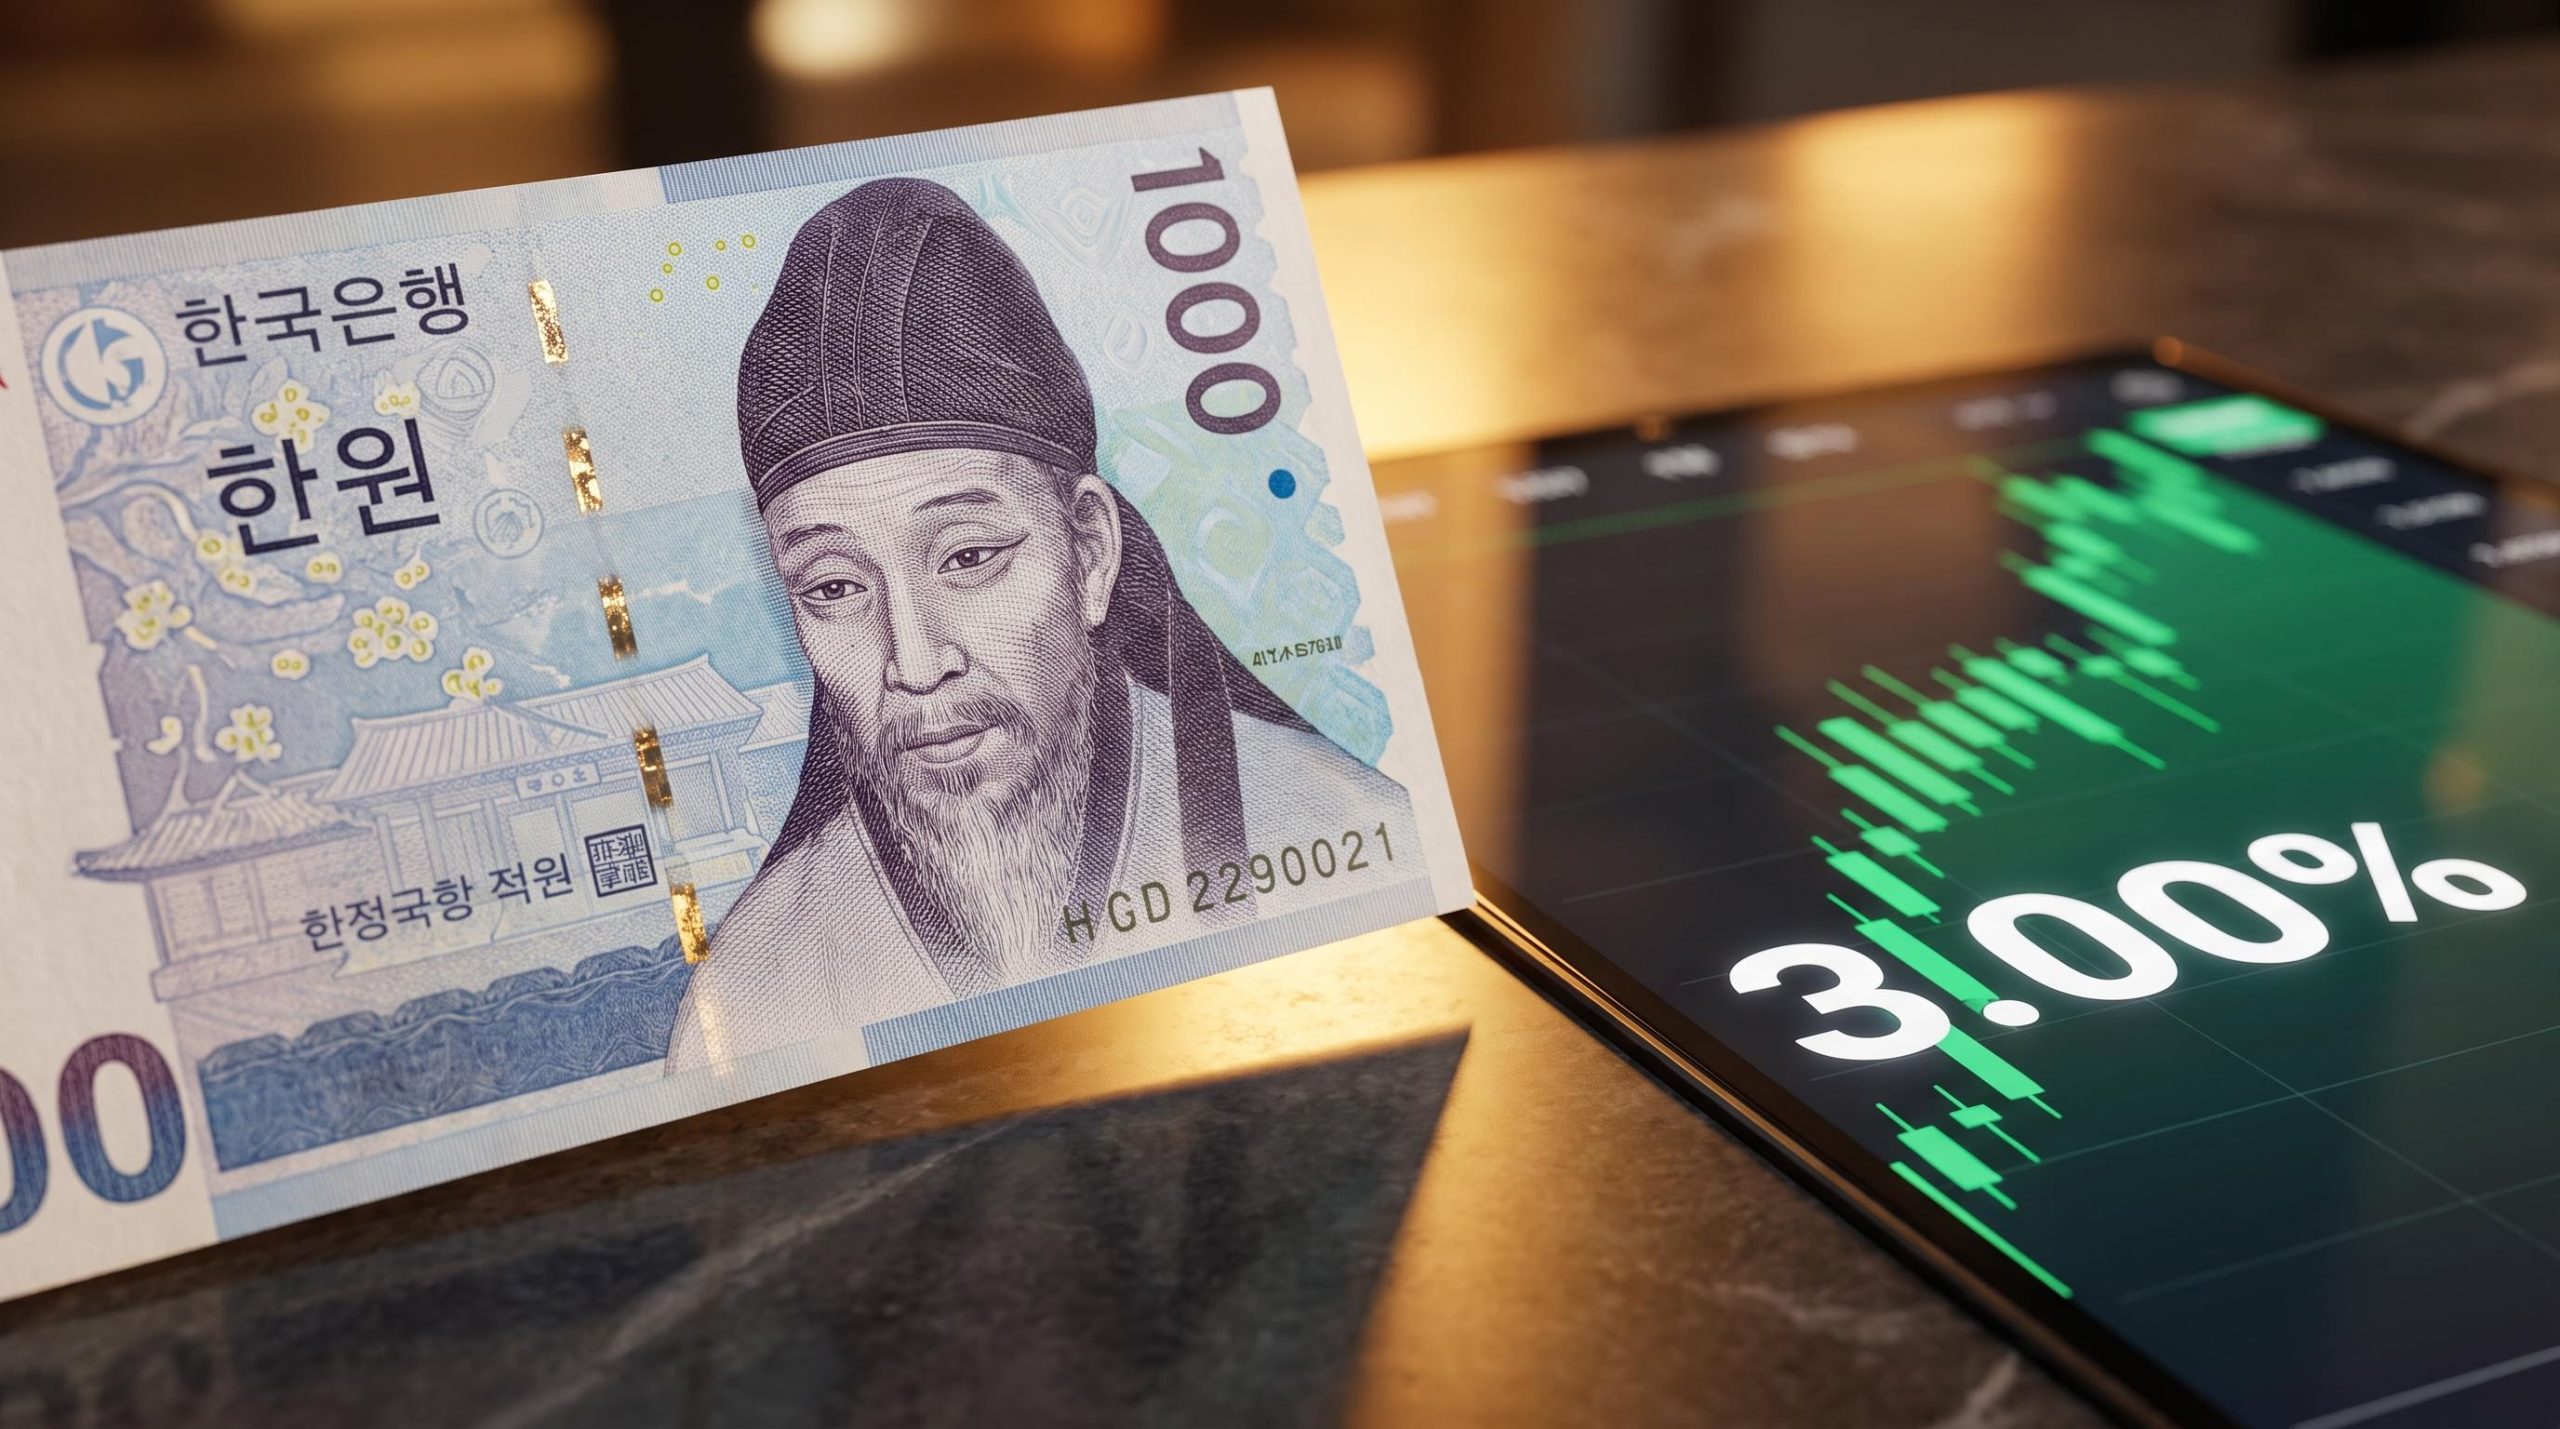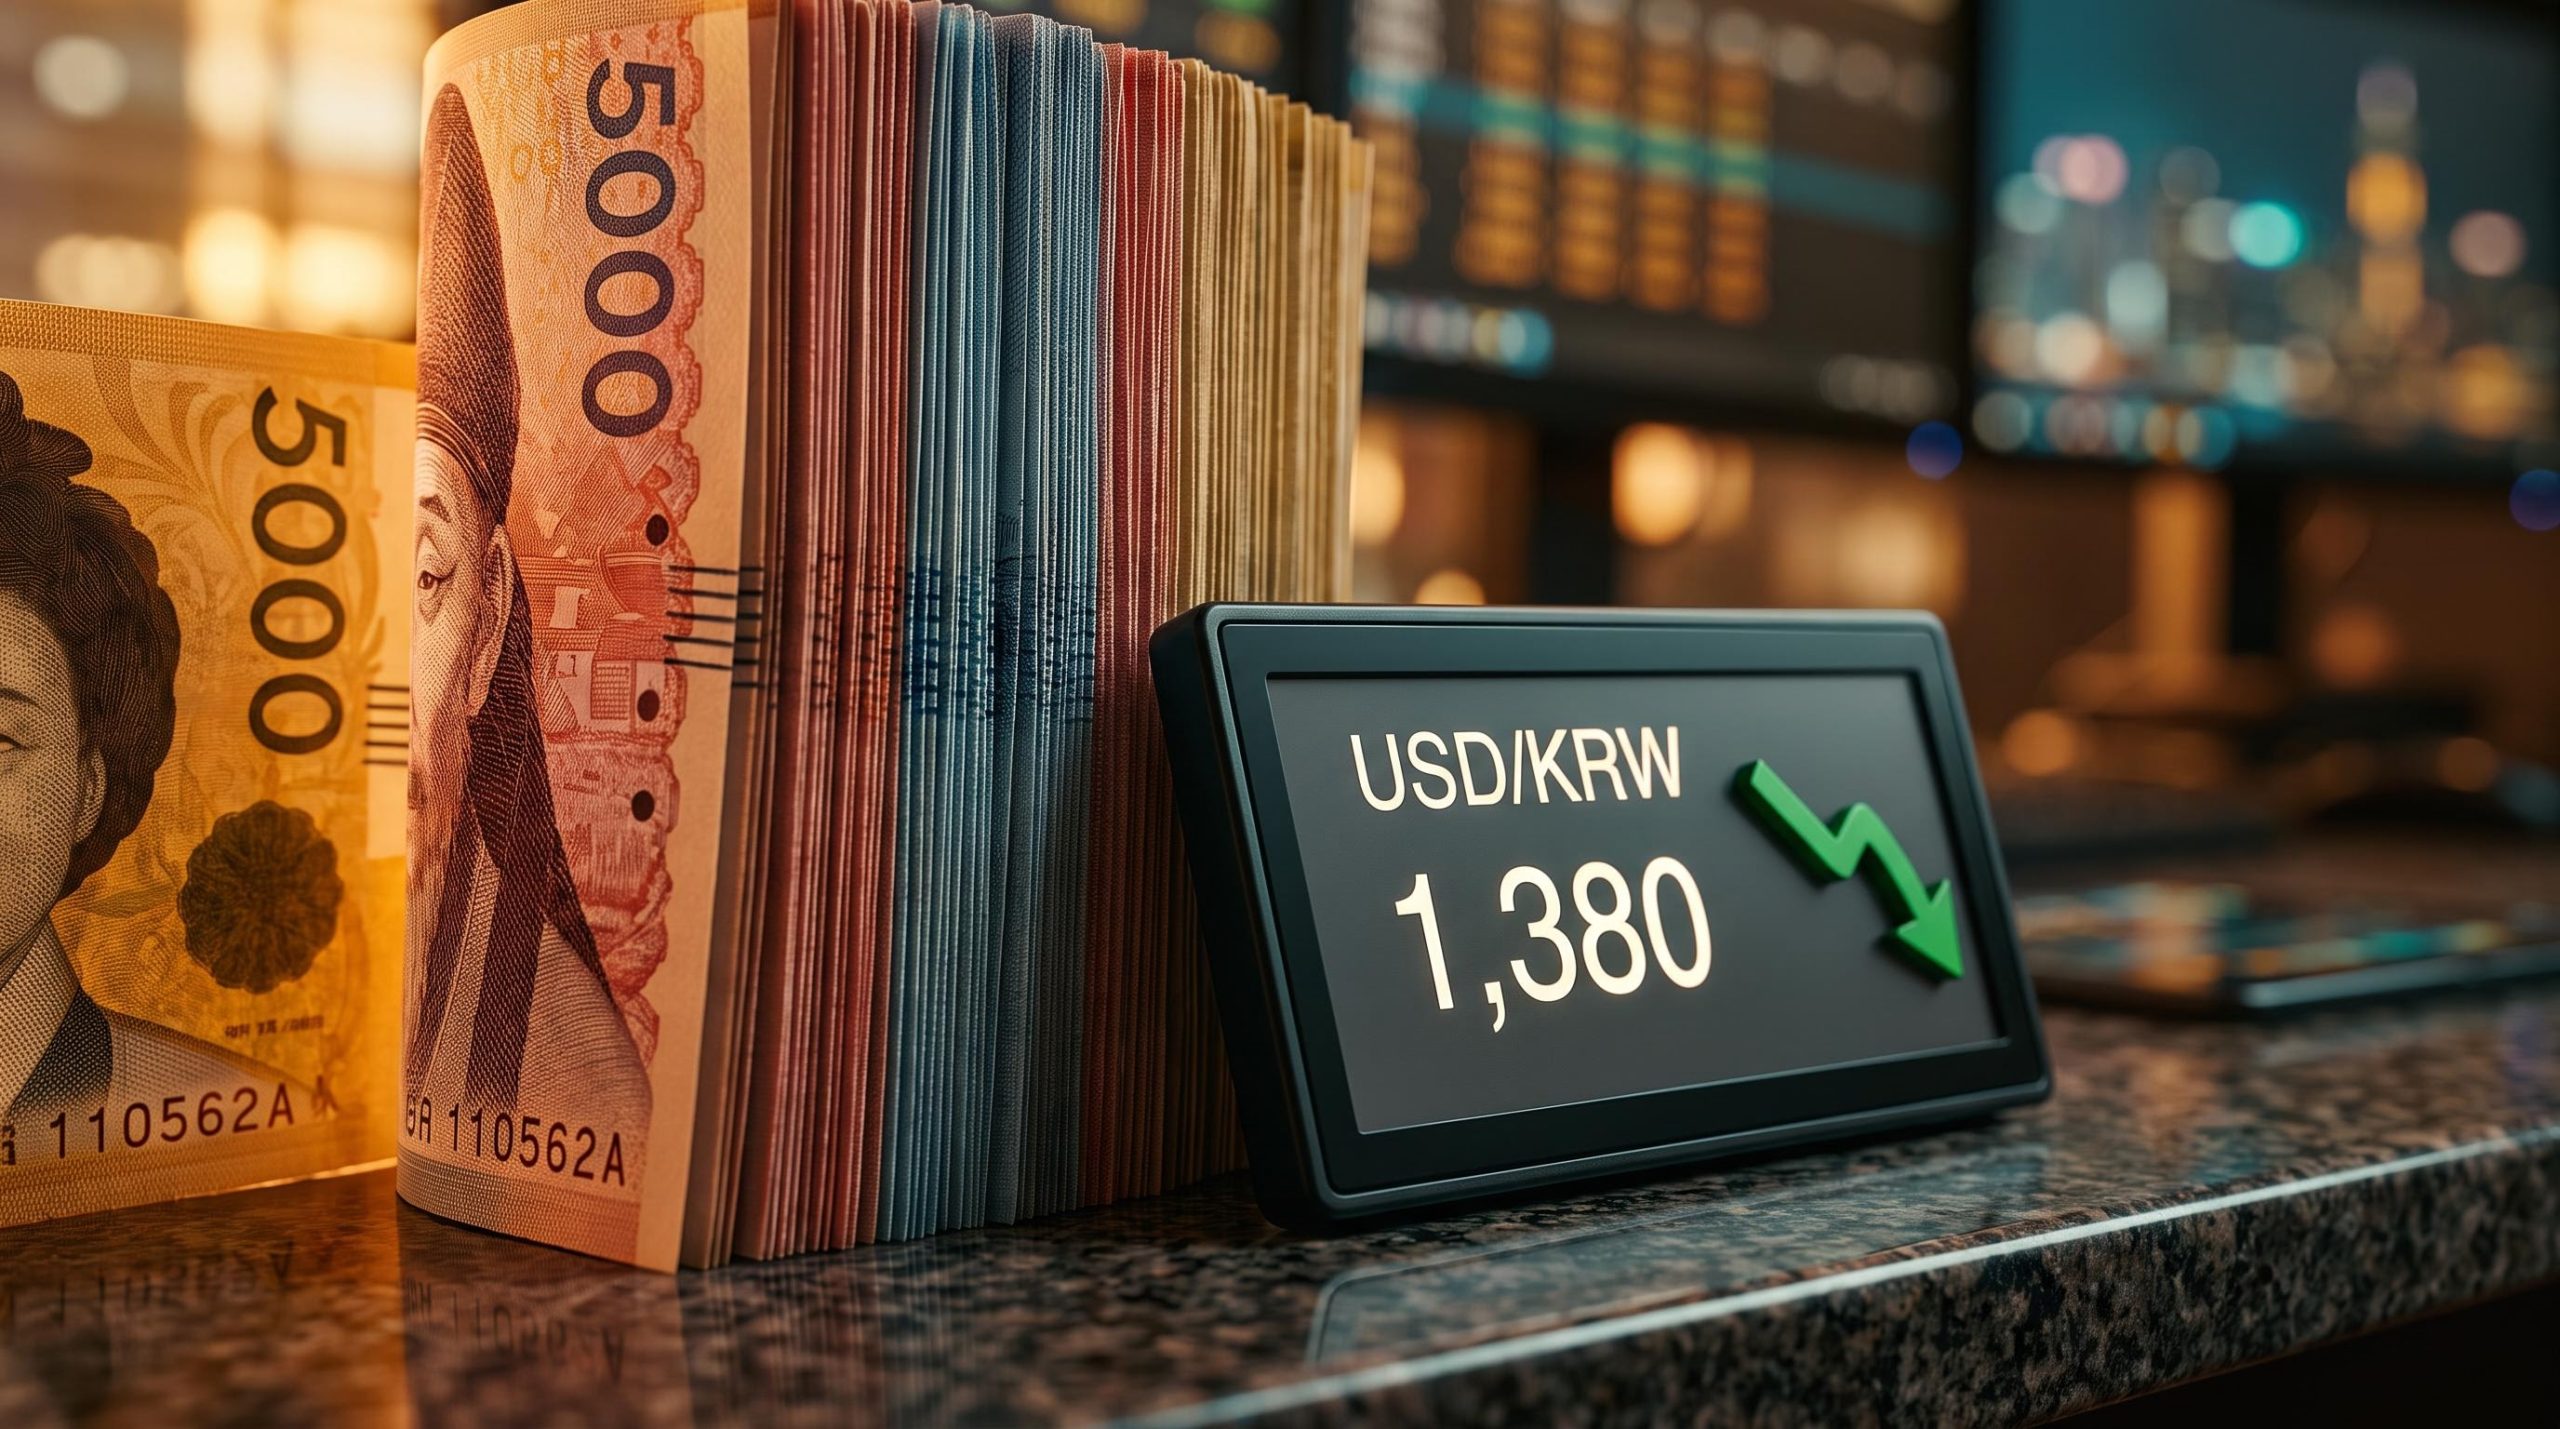
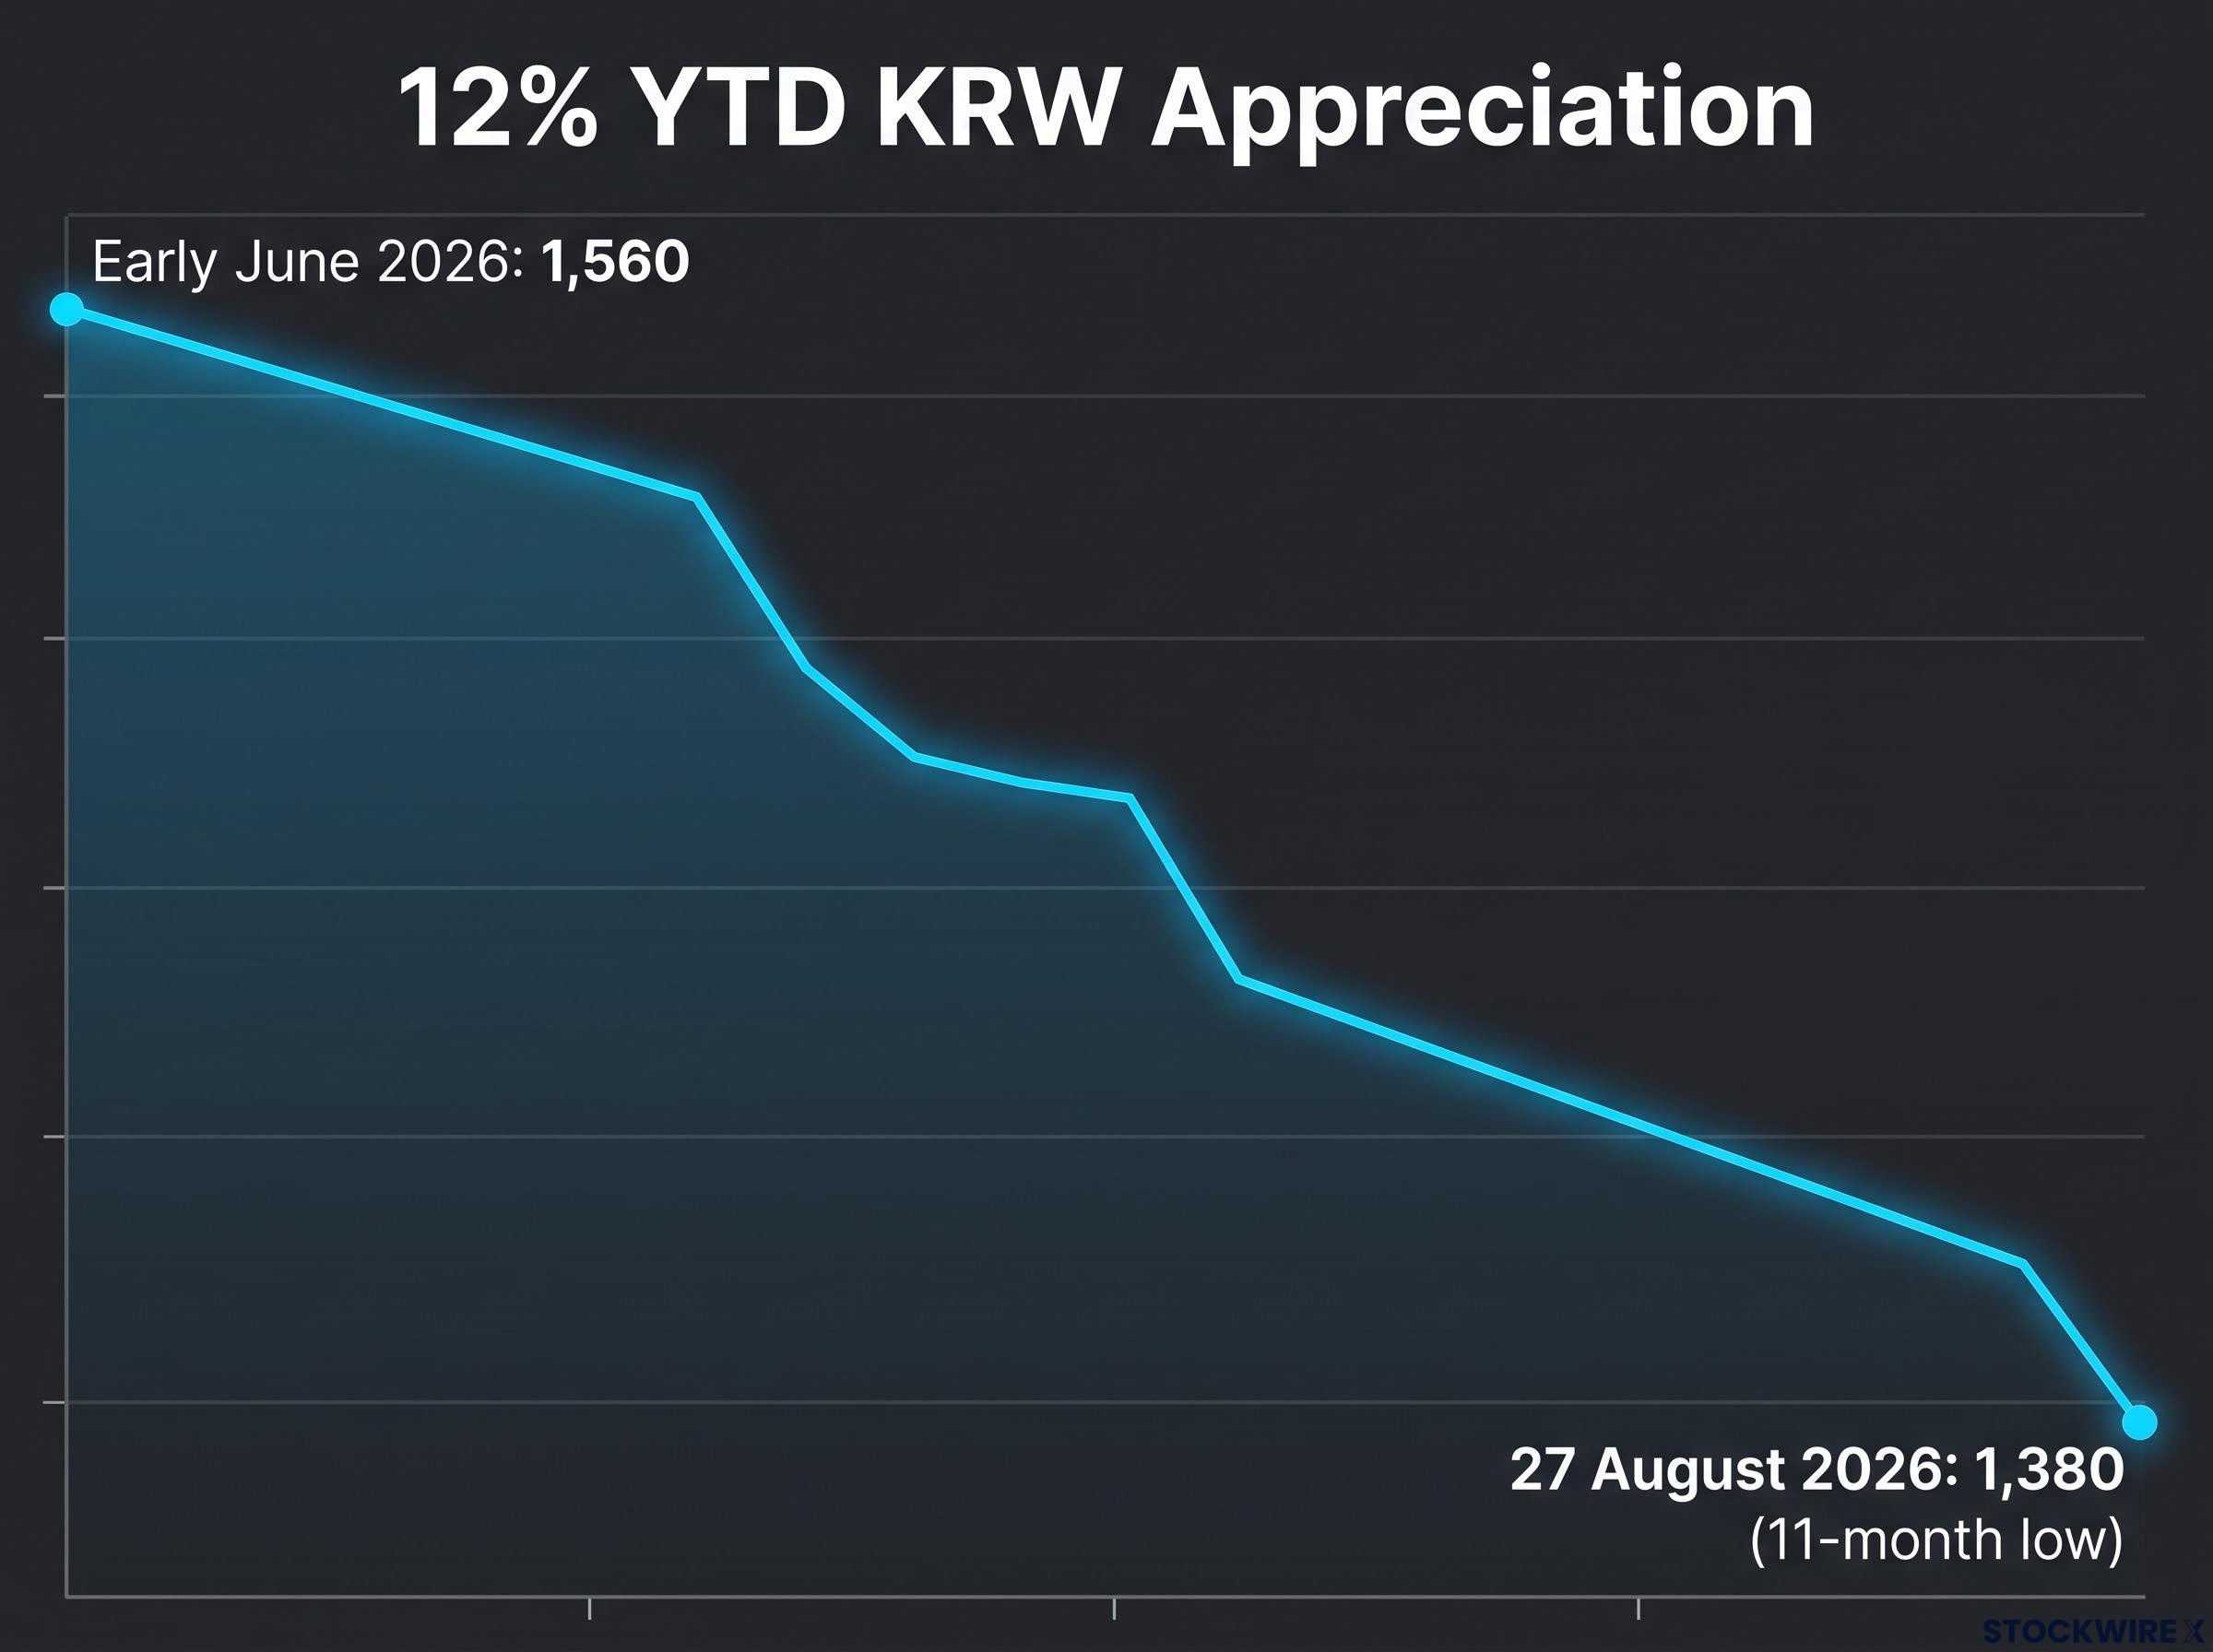
A 12% currency rally in under three months demands an explanation. When USD/KRW shifted from around 1,560 in early June and broke beneath 1,380 before the end of August 2026, the explanation turned out to be corporate boardrooms, not central banks.
Two overlapping forces produced the move. Samsung Electronics announced a shareholder return framework of KRW90-110 trillion (roughly $65-80 billion), the largest capital return programme ever from a Korean company. SK Hynix followed with a KRW40 trillion buyback-and-cancellation programme, with all acquired shares to be destroyed. Together, these commitments reach KRW130-150 trillion. Both companies fund their payouts primarily from dollar-denominated semiconductor export revenues, and every dollar converted to buy back KRW-denominated shares is a dollar sold in the foreign exchange market.
The question is whether this represents a durable structural shift or a time-bounded technical flow with a known expiry date. Here is the transmission from semiconductor boardrooms to the FX market, the reason Korean won strength and the AI memory trade are functionally the same position, and why Societe Generale’s “stretched” verdict should shape how you think about hedging from here.
What a 12% won rally in three months actually looks like
The numbers tell the story before the analysis does. Consider what has happened to USD/KRW in barely a quarter:
- Early June 2026: USD/KRW at approximately 1,560
- 27 August 2026: USD/KRW settling near 1,380, reaching a fresh 11-month low
- Year-to-date KRW appreciation: roughly 12% against the US dollar
- Session move on 27 August: a decline of 0.3%
This was not a speculative spike. The won’s appreciation built steadily over weeks, with each session reinforcing the previous one rather than gapping and fading. That pattern distinguishes it from the kind of short-term emerging-market currency volatility that reverses within days. What happened here was a multi-month repricing, the kind that forces portfolio managers to reassess their FX hedging posture rather than wait it out.
Societe Generale, 25 August 2026: Analysts characterised the USD/KRW move as appearing “stretched,” noting the pair is now more exposed to an upside dollar correction than to another large leg down absent a new positive shock.
That single word, “stretched,” frames the analytical tension. The move is real, grounded in identifiable flows, and supported by genuine semiconductor fundamentals. But at 12% in roughly 12 weeks, the question is no longer whether the rally was justified. The question is how much of it can stick once the flows that produced it begin to taper.
If you hold Samsung or SK Hynix through ADRs or direct Korean exchange listings, you have already received an FX tailwind on top of any equity gains. What matters now is whether that tailwind is permanent or on a clock.
When big ASX news breaks, our subscribers know first
The buyback-to-currency transmission: how corporate boardrooms move FX markets
The scale of the two programmes sets the stage.
| Company | Programme Size (KRW) | Approximate USD Equivalent | Execution Window |
|---|---|---|---|
| Samsung Electronics | KRW90-110 trillion | $65-80 billion | Full-year 2026; finalised January 2027 |
| SK Hynix | KRW40 trillion | $28-29 billion | 20 August – 19 November 2026 |
Samsung’s framework, approved on 21 August 2026, combines cash dividends, share buybacks, and potential cancellations. It is explicitly the largest capital return programme ever announced by a Korean company. SK Hynix’s programme runs a tighter three-month window, with all acquired shares to be cancelled upon completion. SK Hynix has also raised its broader shareholder return target to more than 50% of cumulative free cash flow over 2025-2027, making this buyback an early deployment within a multi-year commitment.
The transmission from corporate decision to currency pressure operates through three reinforcing channels:
Custodian settlement mechanics add a layer of FX demand that operates independently of whether Korean equities are rising or falling; when foreign investors buy a KOSPI dip, their custodian banks must sell USD to settle those trades in won, generating the same directional currency pressure as inbound capital entering a rising market.
- Corporate dollar conversion. Both companies generate cash predominantly in US dollars from memory and semiconductor exports. Deploying that cash into KRW-denominated buybacks means selling dollars in the FX market, reducing corporate dollar hoarding that would otherwise leave those dollars offshore.
- Foreign investor participation. A meaningful share of both companies’ float is held by foreign investors through ADRs, global mutual funds, and ETFs. Fresh foreign capital entering to participate in or front-run the buyback programmes must be converted from USD to KRW, creating direct dollar-selling pressure.
- Sentiment-driven inflows. AI-driven equity enthusiasm brings incremental global investor interest in Korean semiconductor equities beyond pure buyback mechanics, generating a secondary wave of KRW demand that amplifies the mechanical corporate flow.
Gross programme size vs. realistic net FX impact
Not every won of the combined KRW130-150 trillion commitment translates into FX pressure. Three factors dampen the headline figure. Domestic investors participating in buybacks already hold KRW, so no currency conversion occurs. Pre-existing corporate KRW balances used to fund portions of the programmes do not generate fresh conversion. And not every foreign holder who sells into the buyback immediately repatriates proceeds; some reinvest within Korea.
The analytical point, however, is not that the headline overstates the impact. It is that even a modest net fraction of KRW130-150 trillion is macro-relevant for USD/KRW on a multi-month horizon. These are among the largest sustained corporate FX flows in Korea’s history.
Why the AI memory trade and the KRW trade are the same trade
SK Hynix ranks as the second-largest memory maker globally and is a key supplier of high-bandwidth memory (HBM), the specialised chips that sit inside Nvidia’s AI accelerators, to Nvidia and other AI chip designers. HBM is the memory technology that allows AI processors to handle the massive data throughput required by large language models and generative AI workloads. Samsung is the world’s largest memory producer, with AI-linked profit capacity that directly underwrites its record shareholder return framework.
When global investors buy the AI memory trade through Korean-listed shares or ADRs, the dollar inflows must be converted to KRW to purchase local equity. That makes AI equity enthusiasm a direct FX demand driver. Inbound dollar capital to South Korea ran at elevated levels for weeks ahead of the August buyback announcements, supported by strong investor appetite for Korean semiconductor and memory chip producers. The SK Hynix ADR-related dollar inflows that built through July 2026 then received a further boost when the late August buyback programmes were announced.
Korea’s position as an HBM supplier is structurally difficult to replicate quickly. The manufacturing processes, packaging technology, and supply relationships with AI chip designers represent years of accumulated capability. This positions Korea as a chokepoint in global AI supply chains rather than a generic emerging-market technology market, and it means the inflow thesis extends beyond any single buyback window.
Korea’s position at the centre of Asia FX upside reflects a confluence that generic regional baskets cannot replicate: a BoK rate hike providing policy credibility, a $650 billion domestic investment pipeline anchoring sustained foreign inflows, and semiconductor export revenues structurally distinct from the lower-yield trade economies that populate regional currency indices.
SK Hynix framed its buyback programme in regulatory filings as returning an “AI-fuelled windfall” to shareholders.
The practical distinction is between two types of flow:
- Mechanical buyback flows are time-bounded, board-authorised, and follow a predictable schedule. They end on a known date.
- Sentiment-driven AI inflows are less predictable and can reverse faster than mechanical flows. If hyperscaler capex becomes more selective or memory pricing compresses, these flows can evaporate without warning.
What this tells you is that your Korean equity gains and your FX gains are not separate outcomes. The same thesis that drives one drives the other, and the same risk that unwinds one is likely to unwind both simultaneously. Treating them as independent positions underestimates the concentration of your exposure.
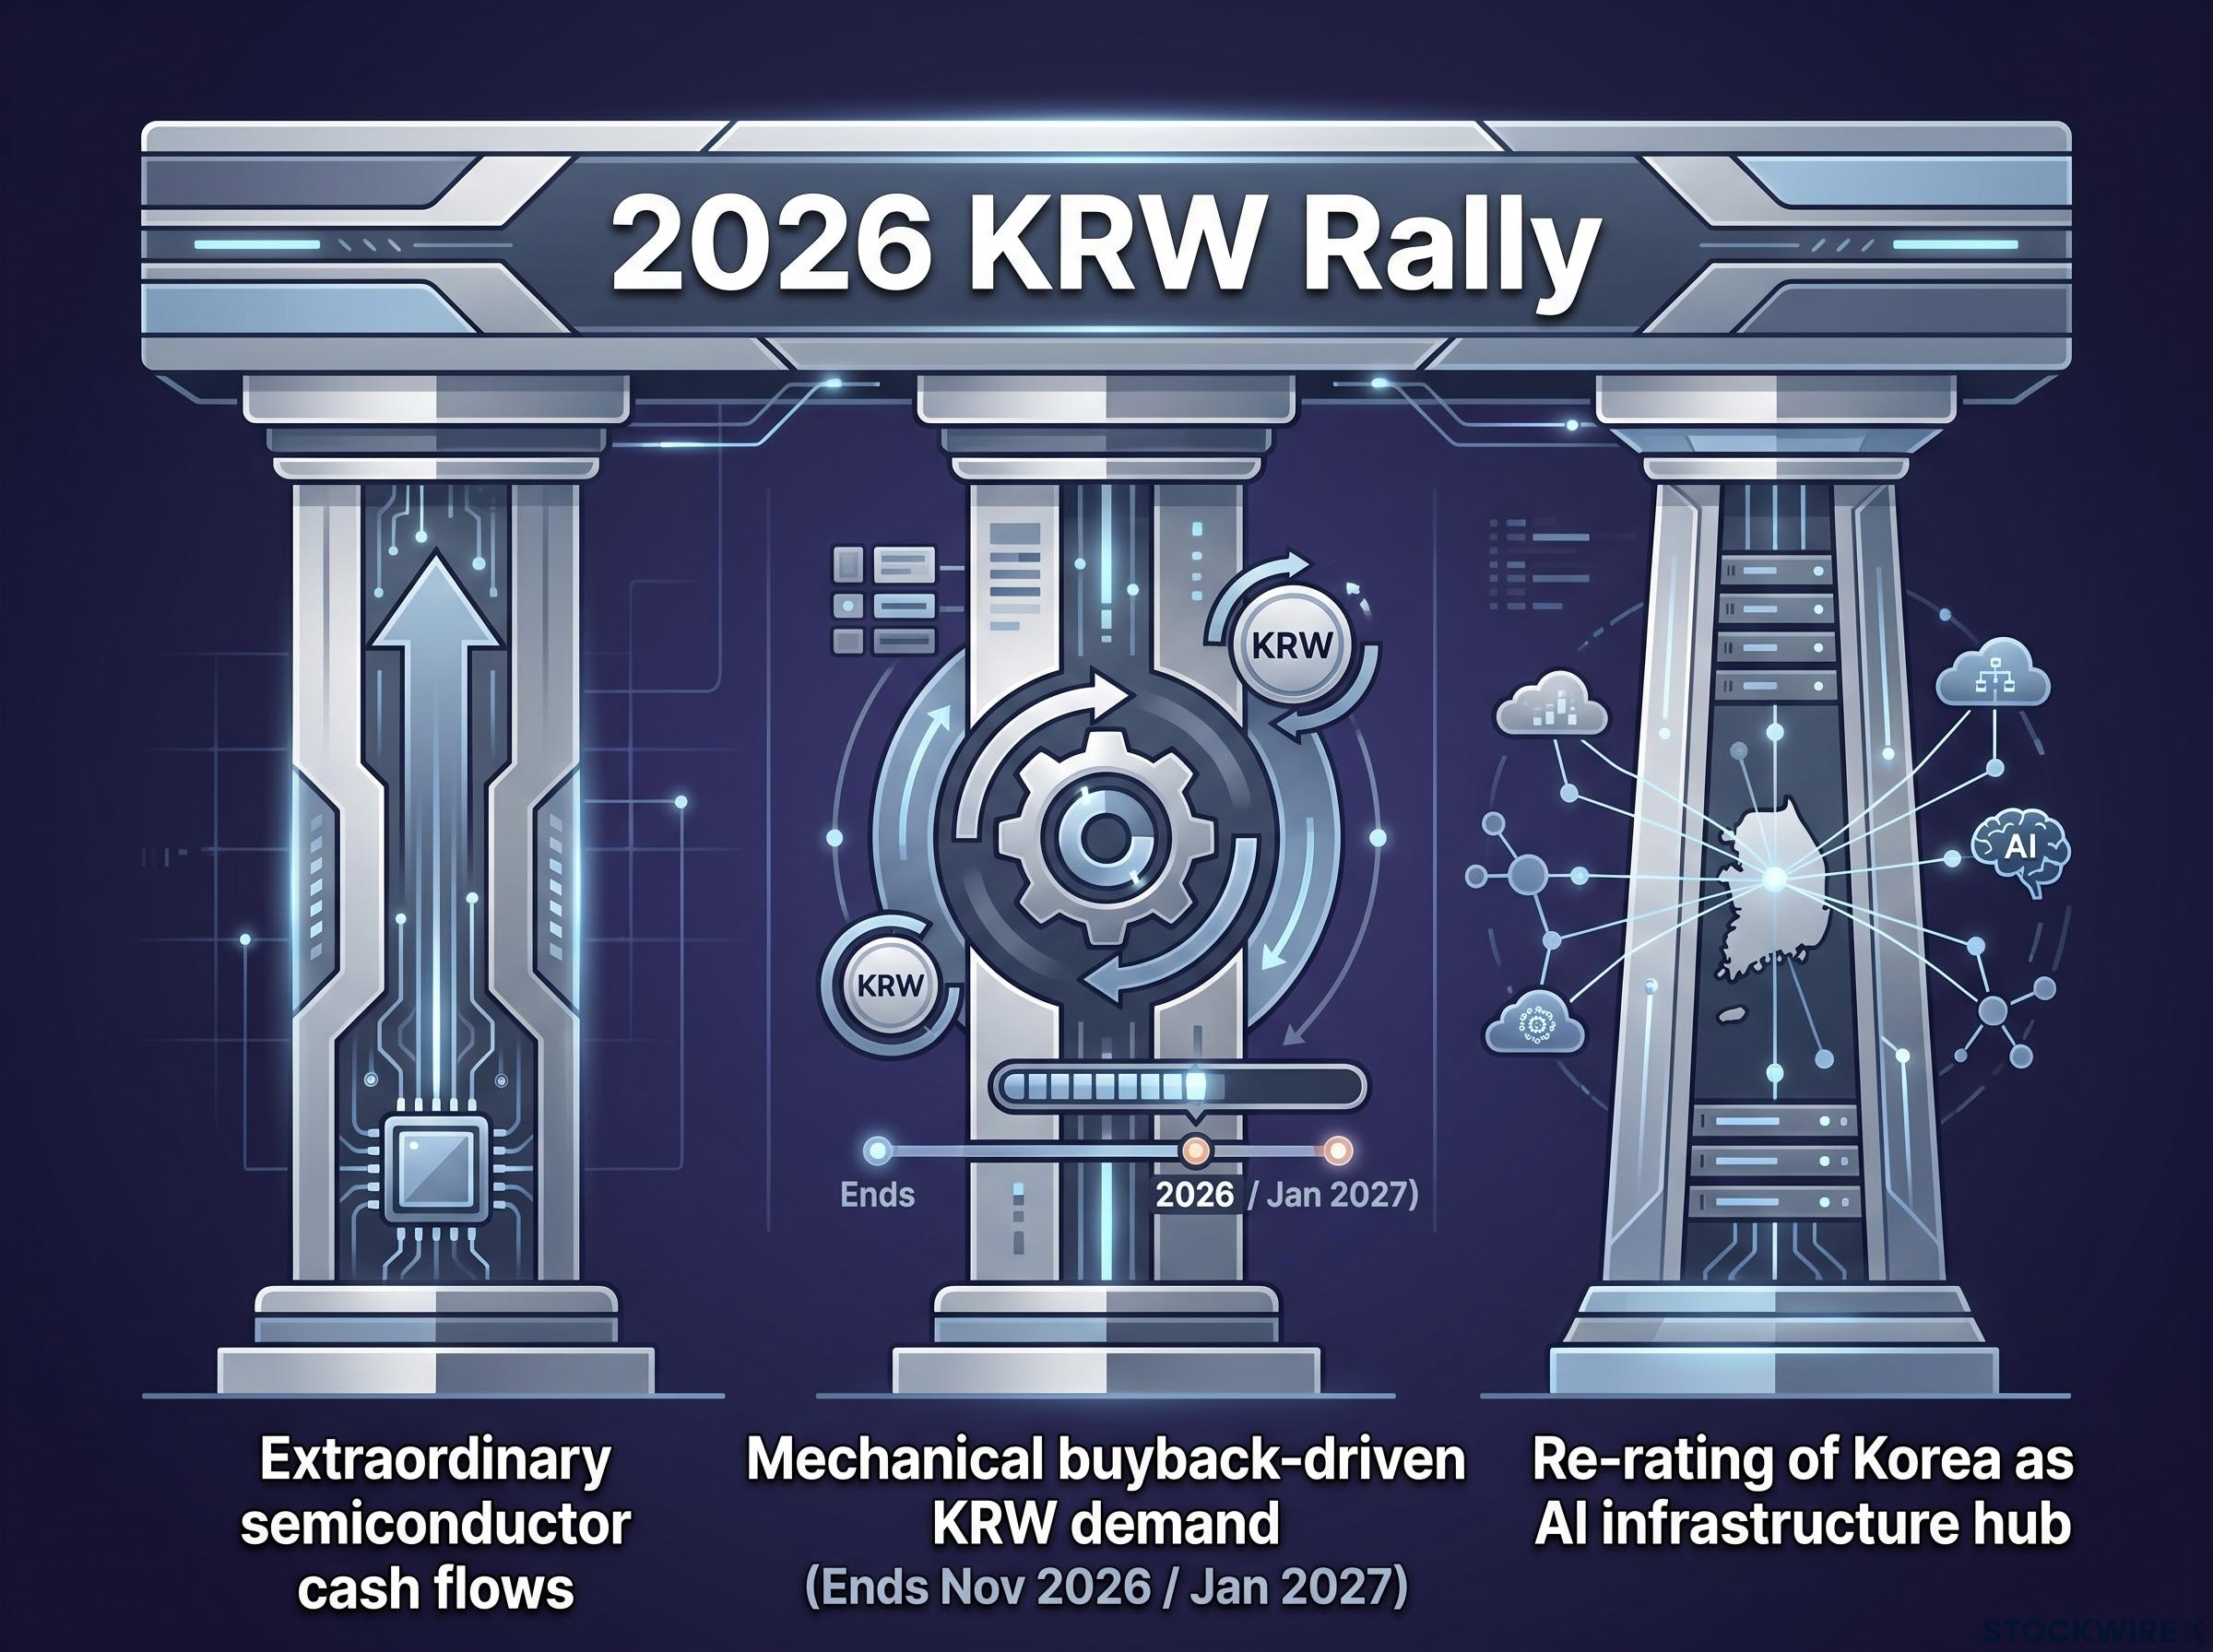
Three pillars holding the KRW up, and when each one runs out
The 2026 won rally rests on three identifiable pillars. Each has a different durability profile, and each carries a different risk.
| Pillar | Durability Assessment | Key Risk | Approximate Horizon |
|---|---|---|---|
| Extraordinary semiconductor cash flows | Moderate; tied to AI capex cycle | Hyperscaler spending becomes selective, compressing memory pricing | Cyclical; multi-quarter visibility |
| Mechanical buyback-driven KRW demand | Time-bounded; board-authorised | Flows end on schedule regardless of fundamentals | SK Hynix: 19 November 2026; Samsung: January 2027 |
| Re-rating of Korea as AI infrastructure hub | Most durable but most sentiment-dependent | Valuation reaches levels where marginal buyers hesitate | Open-ended but vulnerable to positioning crowding |
The first pillar, extraordinary semiconductor cash flows, underpins the other two. AI infrastructure demand drives memory pricing power and capacity utilisation, which underwrites the ability to commit to record shareholder returns. If hyperscaler capital expenditure becomes more selective, memory pricing and free cash flow compress, and the foundation supporting the buyback programmes weakens.
The HBM market trajectory matters for any durability assessment of Korea’s semiconductor cash flows: Micron projects the market will grow from approximately $35 billion in 2025 to $100 billion by 2028, mid-80% gross margins are confirmed across the segment, and industry-wide HBM inventory sits at only 3-4 weeks, meaning the pricing power underwriting these buyback commitments rests on manufacturing scarcity rather than cyclical demand.
The second pillar is the most mechanically certain and the most finite. SK Hynix’s three-month window ends 19 November 2026. Samsung’s 2026 programme finalises in January 2027. After those dates, the specific technical flow disappears even if earnings remain healthy. For anyone holding Korean equity or currency exposure today, the November date is effectively a known risk event: the most mechanical source of KRW support disappears on a fixed schedule, and the remaining pillars are softer.
The third pillar is the most durable in theory but the most fragile in practice. Korea’s structural position as an AI infrastructure hub is genuine, but at a 12% year-to-date appreciation, much of the positive scenario is already reflected in the price. Societe Generale’s “stretched” characterisation captures this precisely: the current level requires both buyback activity and AI enthusiasm continuing concurrently.
What the three-pillar picture means for different positions
The FX risk profile differs depending on where you sit. Equity and ADR investors are receiving a dual tailwind, rising share prices and a strengthening won, that could reverse simultaneously if the AI memory thesis weakens or buyback flows end. The correlation means the downside is not additive; it is multiplicative.
Macro and FX traders face asymmetric risk tilted toward dollar rebounds once buyback execution slows past November. Position sizing and stop-loss discipline matter more at this stage of the move than at earlier entry points.
Corporate treasurers and real-money allocators may find that locking in part of the FX benefit while optionality remains affordable is more attractive than staying fully unhedged through the buyback wind-down period.
What comes after the buyback window closes
The post-November 2026 period, after SK Hynix’s window closes, and the post-January 2027 period, after Samsung’s programme finalises, represent the true test of whether this repricing was structural or buyback-driven. The answer will come from two variables, and one reversion signal:
- Sustained AI hyperscaler capex maintaining memory pricing power and semiconductor free cash flow through the first half of 2027
- Continued foreign inflows into Korean semiconductor equities independent of buyback mechanics, driven by Korea’s structural HBM position rather than programme-driven momentum
- Reversion signal: USD/KRW drifting back above 1,450 in the months following the buyback window’s close
Societe Generale’s framing, 25 August 2026: The current USD/KRW level is contingent on both buyback activity and AI enthusiasm continuing concurrently. It is not a guaranteed permanent equilibrium.
SK Hynix’s multi-year commitment to return more than 50% of cumulative free cash flow through 2027 provides a medium-term anchor that extends beyond individual windows. But an anchor is not the same as continuous mechanical buying pressure. Future commitments may come in smaller increments, with different execution timelines, and without the concentrated three-month urgency of the current programme.
The rally has a built-in stress test. If USD/KRW holds near 1,380 through the first quarter of 2027 without buyback mechanical support, the structural re-rating thesis is validated. If it drifts back toward 1,450 or beyond, the move was a flow-driven overshoot, and investors who treated it as permanent paid for that assumption. Knowing that date gives you a concrete timeline for reassessing your hedging posture, rather than waiting for a reversal signal the market may not telegraph in advance.
For investors wanting to model how durable the semiconductor cash flows underwriting these buyback commitments actually are, our deep-dive into memory pricing dynamics examines the DRAM and NAND contract price data, the structural procurement shift toward multi-year deposit-backed supply agreements, and the supply timeline constraints that shape free cash flow visibility through 2027.
This article is for informational purposes only and should not be considered financial advice. Investors should conduct their own research and consult with financial professionals before making investment decisions. Past performance does not guarantee future results. Financial projections are subject to market conditions and various risk factors.