
Intuit posted a quarter that beat on both revenue and earnings per share, and the stock fell 10-12% in after-hours trading. That is not a typo.
The disconnect matters beyond Intuit itself. Earnings guidance misreads are a recurring feature of technology reporting seasons, and stock-based compensation (SBC) accounting is one of the most common zones where the headline number and the underlying reality diverge. If you understand what happened here, you will be better equipped for every ambiguous earnings release you encounter from here on.
This piece separates what was real from what was optical in Intuit’s quarter. One figure was an accounting methodology shift that created a phantom earnings collapse. The other was a genuine growth signal worth pricing in. Here is how to tell the difference, and how to apply that distinction the next time a guidance number looks catastrophically bad before the footnotes arrive.
What the reported numbers actually showed
Before any confusion enters the picture, the quarter itself deserves a clean look. Intuit delivered a beat on virtually every line that matters.
| Metric | Reported | Consensus estimate |
|---|---|---|
| Quarterly revenue | ~$4.35-$4.4 billion (up ~13-14% YoY) | ~$4.27-$4.28 billion |
| Adjusted EPS | $4.03 | $3.55 |
| GAAP EPS | ~$1.34 | ~$0.77 |
The two EPS figures reflect different measurement bases: the $4.03 is the adjusted (non-GAAP) number, which strips out items like SBC, while the $1.34 is the GAAP figure, which includes them. Both beat their respective consensus estimates comfortably.
The two EPS figures reflect different measurement bases, and the gap between them is not incidental: GAAP vs non-GAAP earnings diverge by roughly 25-30% at the S&P 500 median, with technology sector gaps frequently reaching 40-50%, which is why the choice of benchmark matters so much when guidance numbers land.
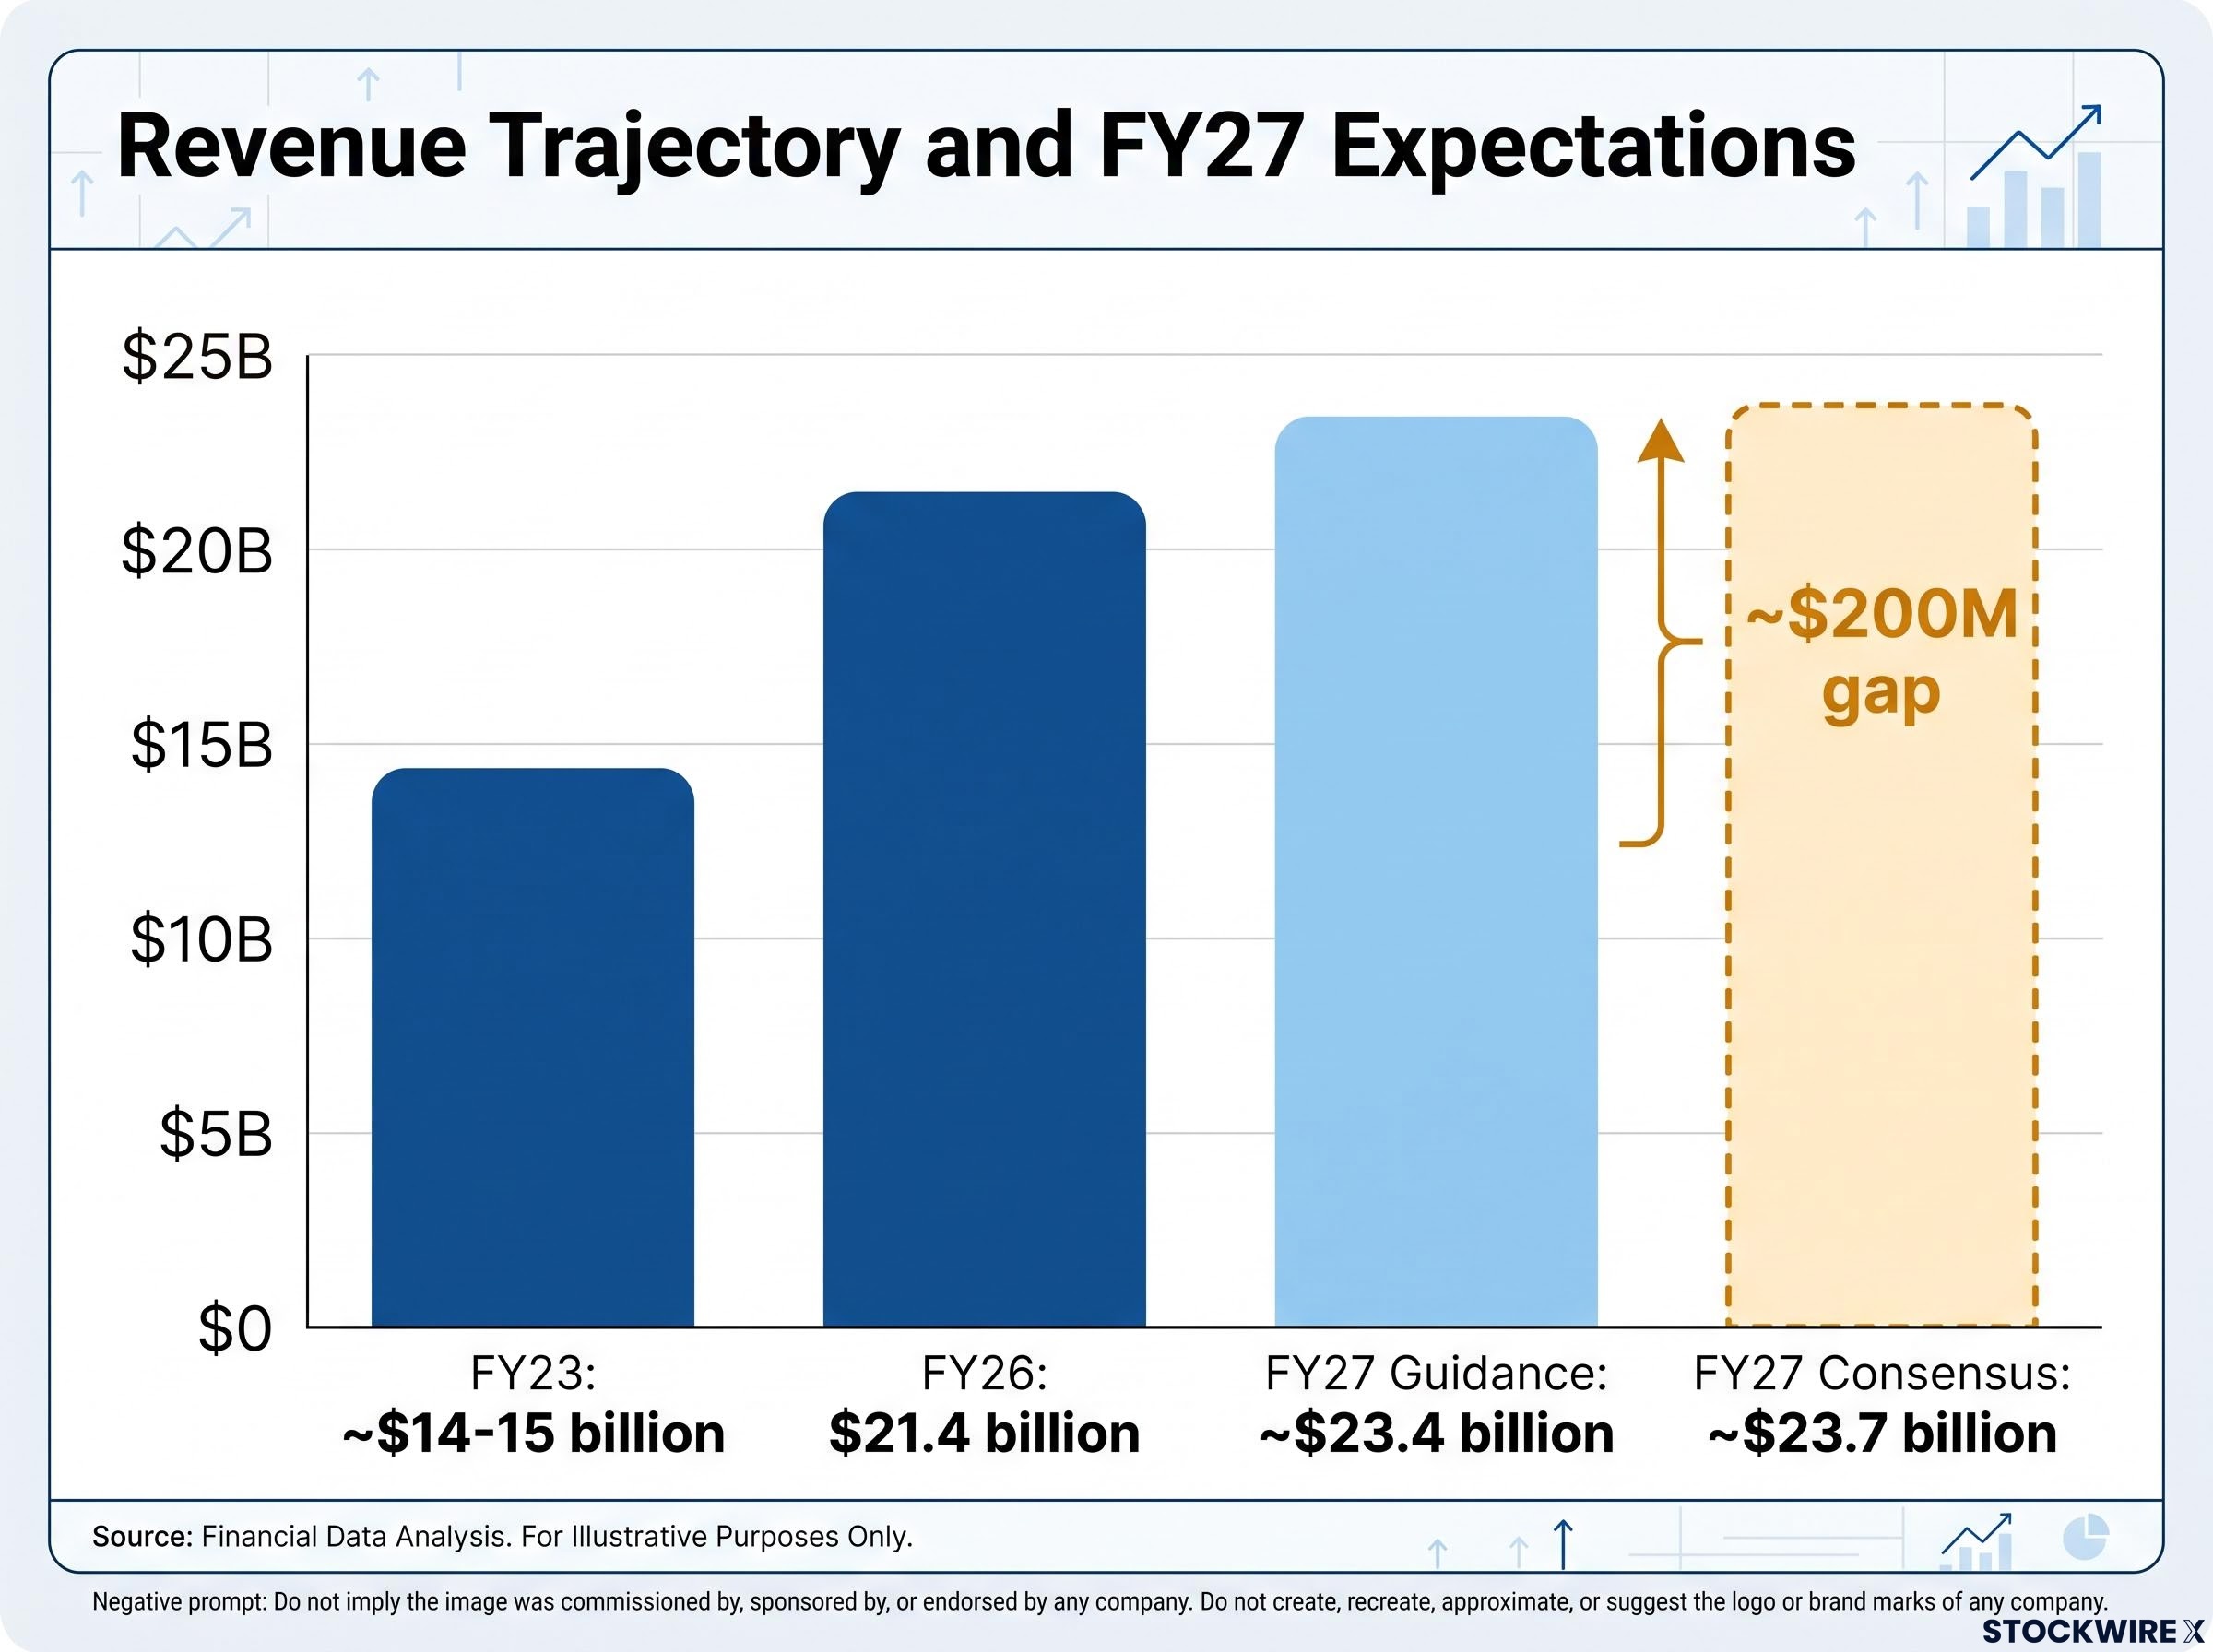
This was not a one-quarter anomaly. Full-year FY26 revenue reached approximately $21.4 billion, representing roughly 14% growth. That compounds from approximately $14-15 billion in FY23, meaning Intuit has added nearly $7 billion in annual revenue across three fiscal years.
Anyone who bought or sold based solely on the reported quarter had no rational basis for panic. The underlying business delivered exactly what a healthy, compounding franchise looks like.
When big ASX news breaks, our subscribers know first
How Intuit’s SBC methodology shift distorted EPS guidance
Here is what the headline guidance looked like to an algorithm scanning the earnings release on the evening of 25 August 2026.
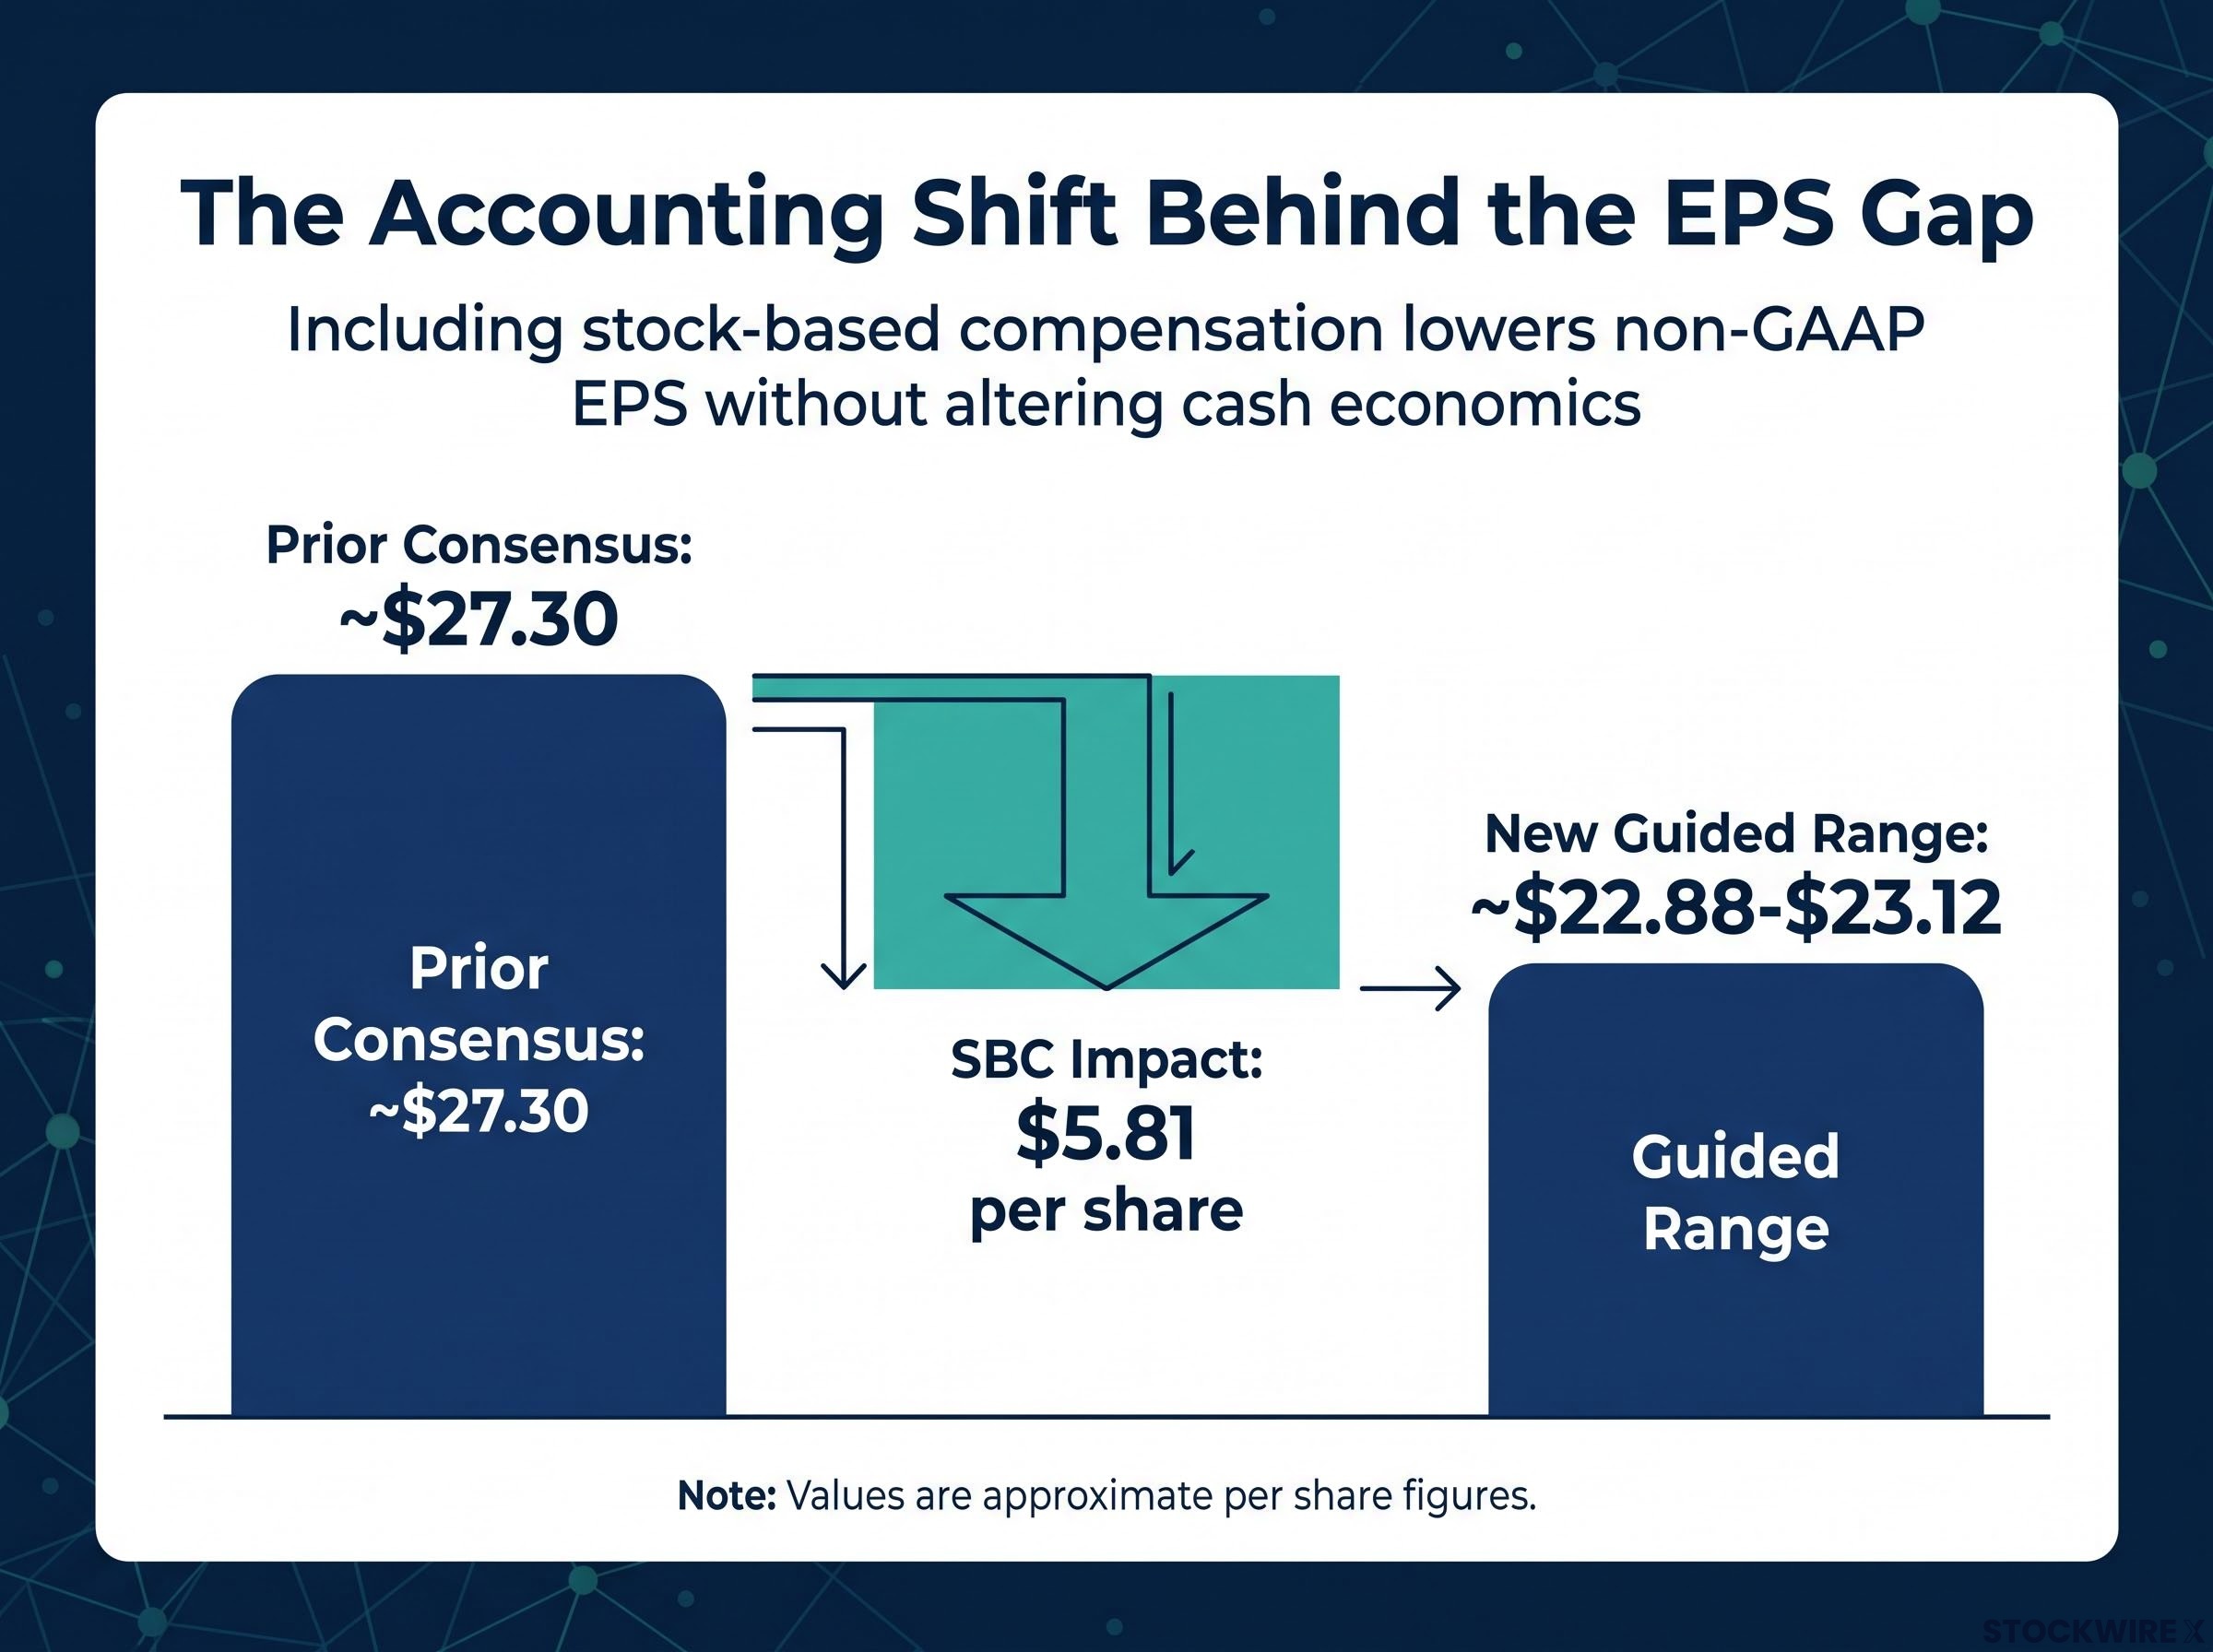
FY27 non-GAAP EPS guidance: approximately $22.88-$23.12. Prior consensus: approximately $27.30. That is an apparent gap of nearly $5 per share, the kind of number that triggers immediate, aggressive selling.
Then came the footnote.
Effective 1 August 2026 (the start of fiscal 2027), Intuit disclosed two reporting changes. First, Mailchimp would be managed and reported as a separate operating segment. Second, and far more consequentially, stock-based compensation would no longer be excluded from non-GAAP metrics.
Why companies change SBC treatment in non-GAAP reporting
Non-GAAP earnings figures were originally designed to strip out one-off or non-cash items so investors could see the recurring cash economics of a business. SBC was frequently excluded under this logic, on the theory that it was a non-cash charge and therefore not reflective of operating performance.
That practice became increasingly controversial as SBC grew to represent a meaningful portion of total compensation at large software companies. Excluding it effectively understated the true cost of running the business. Intuit’s decision to include SBC going forward reflects a broader trend across the software sector toward more conservative, economically grounded non-GAAP reporting.
Institutional analysts treating non-GAAP reporting as a lens rather than a verdict is precisely what separated the fast-money algorithmic reaction from the more measured analyst response that emerged the following morning; the GAAP versus non-GAAP trap catches retail investors who accept adjusted figures without examining what has been excluded.
The company quantified the impact explicitly. FY27 non-GAAP operating income guidance includes approximately $2.02 billion in SBC expense. On a per-share basis, that equates to $5.81.
| Metric | Old methodology (SBC excluded) | New methodology (SBC included) |
|---|---|---|
| FY27 non-GAAP EPS | ~$27.30 (prior consensus) | ~$22.88-$23.12 (guided) |
| SBC impact per share | N/A (excluded) | $5.81 |
The key number: $5.81 per share in SBC expense accounts for the bulk of the apparent EPS gap between the new guidance and old consensus. This is a recalibration of the accounting framework, not evidence that Intuit’s underlying profit generation has weakened.
The apparent EPS collapse was, in essence, a comparison of two different measuring sticks. Anyone who compared the new guidance directly to old consensus without adjusting for SBC inclusion was comparing numbers that were never meant to sit side by side.
How the selloff unfolded and why it partially reversed
The sequence that played out between the evening of 25 August and the morning of 26 August 2026 follows a pattern worth recognising, because it repeats across earnings seasons.
- Intuit released earnings after market close on 25 August 2026. The headline guidance figures hit the tape.
- Algorithms and fast-money traders compared the new EPS guide to old consensus without adjusting for the SBC methodology change. The gap looked catastrophic.
- Selling began immediately. Shares dropped approximately 9-12% from the regular-session close in after-hours trading.
- By the morning of 26 August, analyst coverage began correcting the narrative. Research notes highlighted that the guidance incorporated the SBC change and was therefore not directly comparable to prior consensus.
- A portion of the selloff reversed, leaving a smaller drawdown of approximately 3-4% by the 26 August trading session.
A large after-hours decline that gives back most of its ground the following morning, absent any fresh news, typically points to a disclosure that was misread rather than a deterioration in the underlying business. The speed and scale of that reversal is itself a clue about what actually drove the initial move.
The speed of the partial recovery tells you something specific. The market did not receive new positive information overnight. What it received was time to read the footnotes. That distinction, between new information and better-processed existing information, is what separates a genuine repricing from an algorithmic misfire.
What the revenue guidance truly implies for Intuit’s growth trajectory
With the accounting distortion cleared, the genuine question comes into focus. And it is a real one.
FY27 revenue guidance of $23.279-$23.512 billion came in below analyst consensus of approximately $23.7 billion. This is not an optical gap. This is a modest but genuine miss on the top line, and it implies a deceleration from the growth trajectory that took Intuit from roughly $14-15 billion in FY23 to $21.4 billion in FY26.
The post-clarification drawdown of approximately 3-4% is more plausibly tied to two separate concerns:
- SBC is now treated as a recurring cost. Even though the methodology change is an accounting event, it forces investors to confront the full economic cost of running Intuit, including compensation that was previously excluded from the profitability picture.
- The revenue trajectory is softer than expected. A guidance midpoint of roughly $23.4 billion against $23.7 billion in consensus is not a collapse, but for a company trading on a premium multiple, any deceleration in revenue growth affects what that multiple can sustain.
| Concern | Accounting artifact or genuine signal? |
|---|---|
| FY27 EPS ~$5 below old consensus | Accounting artifact (SBC methodology change) |
| FY27 revenue ~$200M below consensus | Genuine signal (softer growth trajectory) |
| Initial 9-12% after-hours selloff | Mostly artifact (partially reversed) |
| Residual 3-4% drawdown | Genuine repricing (defensible) |
That distinction determines whether the stock is now cheap, fairly priced, or still adjusting. The accounting change that triggered the initial panic is largely an optical distortion. The revenue shortfall relative to consensus is the figure that warrants genuine scrutiny.
What this playbook looks like across earnings season
The Intuit case is specific, but the pattern is not. Here is a four-step framework for reading guidance when methodology changes are involved, anchored to the data points that just played out.
- Check for methodology changes before comparing guidance to consensus. If a company changes the definition of “adjusted” or non-GAAP metrics, the new guidance is not apples-to-apples with old consensus. Intuit quantified the effect at $5.81 per share. Not every company will be this transparent; look for it in the earnings supplement and prepared remarks, not just the headline release.
- Distinguish one-off reporting adjustments from underlying business performance. The EPS gap here was an artefact of the SBC reclassification. The revenue miss versus consensus, roughly $200 million at the midpoint, reflects a real shift in growth expectations. Treating both as equivalent leads to poorly calibrated reactions in either direction.
- Watch the intraday recovery as a signal in itself. When a stock drops 9-12% after hours and then claws back most of that loss by the following morning without any new information arriving, it strongly suggests the initial move was rooted in a misreading of the disclosure. If you see that pattern, the footnotes deserve your attention before any trade does.
- Flag SBC accounting as a frequent source of confusion in tech earnings. A wide range of technology and software businesses strip SBC out of their non-GAAP figures. When a company reverses that practice, as Intuit did here, the reported EPS can shift dramatically even though cash generation and competitive position are unchanged. The $5.81 per-share impact in this case shows just how sizeable that optical effect can be.
A non-GAAP guidance figure only tells you something useful once you understand what the company has chosen to include or exclude. When those definitional boundaries shift, any direct comparison to prior consensus is unreliable until you account for the change.
For readers wanting to build the habit of checking for methodology changes before any guidance comparison, our full explainer on earnings report red flags covers metric omissions, non-GAAP manipulation signals, and the cash flow cross-checks that surface distortions before they become costly trading decisions.
What Intuit’s repricing leaves on the table
The two-part verdict is now clean. The accounting panic was irrational and has partially corrected. The revenue deceleration concern is real, and the market is right to price it in.
What remains is a residual 3-4% drawdown and a forward question. FY27 revenue guidance at a midpoint of approximately $23.4 billion represents a modestly softer trajectory than the compounding pace of the prior three years. Whether that repricing is too harsh or too mild depends on something this analysis cannot answer for you: your view of Intuit’s long-term growth prospects and the multiple you assign to a high-quality software franchise at a more mature revenue base.
The variable that matters most from here is the forward revenue trajectory, not the EPS line that triggered the initial panic. Can Intuit accelerate from the FY27 base, or is the deceleration structural? That is the question worth holding as you monitor the next several quarters of reporting.
The variable that matters most from here is the forward revenue trajectory, but the capital return picture provides important context: Intuit generated approximately $8.617 billion in free cash flow in FY26, returning $5.5 billion via share repurchases and raising its quarterly dividend 15%, a profile that becomes more relevant to valuation once the accounting distraction is cleared.
The accounting distraction has been cleared out. The real question is now visible.
This article is for informational purposes only and should not be considered financial advice. Investors should conduct their own research and consult with financial professionals before making investment decisions. Past performance does not guarantee future results. Financial projections are subject to market conditions and various risk factors.