Australia’s headline Consumer Price Index (CPI) came in at 3.5% year-on-year in July, against expectations of 3.3%. The monthly CPI rose 1.0%, overshooting the 0.8% consensus. Within hours, the probability of the Reserve Bank of Australia (RBA) holding rates steady at its next meeting dropped from above 80% to just over 60%.
The gap between what markets expected and what arrived is the story. Investors had largely settled into a consensus that inflation was on a clean glide-path toward rate cuts. July’s print fractured that consensus, introduced a non-trivial probability of another hike, and pushed the timeline for the first cut materially further out. This is not a marginal revision; it is a directional shift in the policy outlook.
Here is what the data actually showed, how professional markets have repriced the rate path, what it means across equities, bonds, and the Australian dollar, and which upcoming releases will determine whether July was a one-off or the beginning of a more persistent problem.
What the July inflation data actually showed
Start with the headline number and it looks like progress. Annual CPI slowed to 3.5% from 3.8% in June. That is a move in the right direction. But the monthly figure told a different story: a 1.0% rise against the 0.8% markets had expected, lifting the CPI index level to 103.07 from 102.03 in June.
The annual slowdown was not accompanied by the monthly softness markets needed to see. A 7.5% jump in fuel prices, following several months of declines, was the primary culprit. That makes the fuel contribution potentially reversible, and analysts will be watching closely to see whether it washes out in subsequent prints. But the damage to the rate outlook was done before the composition analysis had even landed.
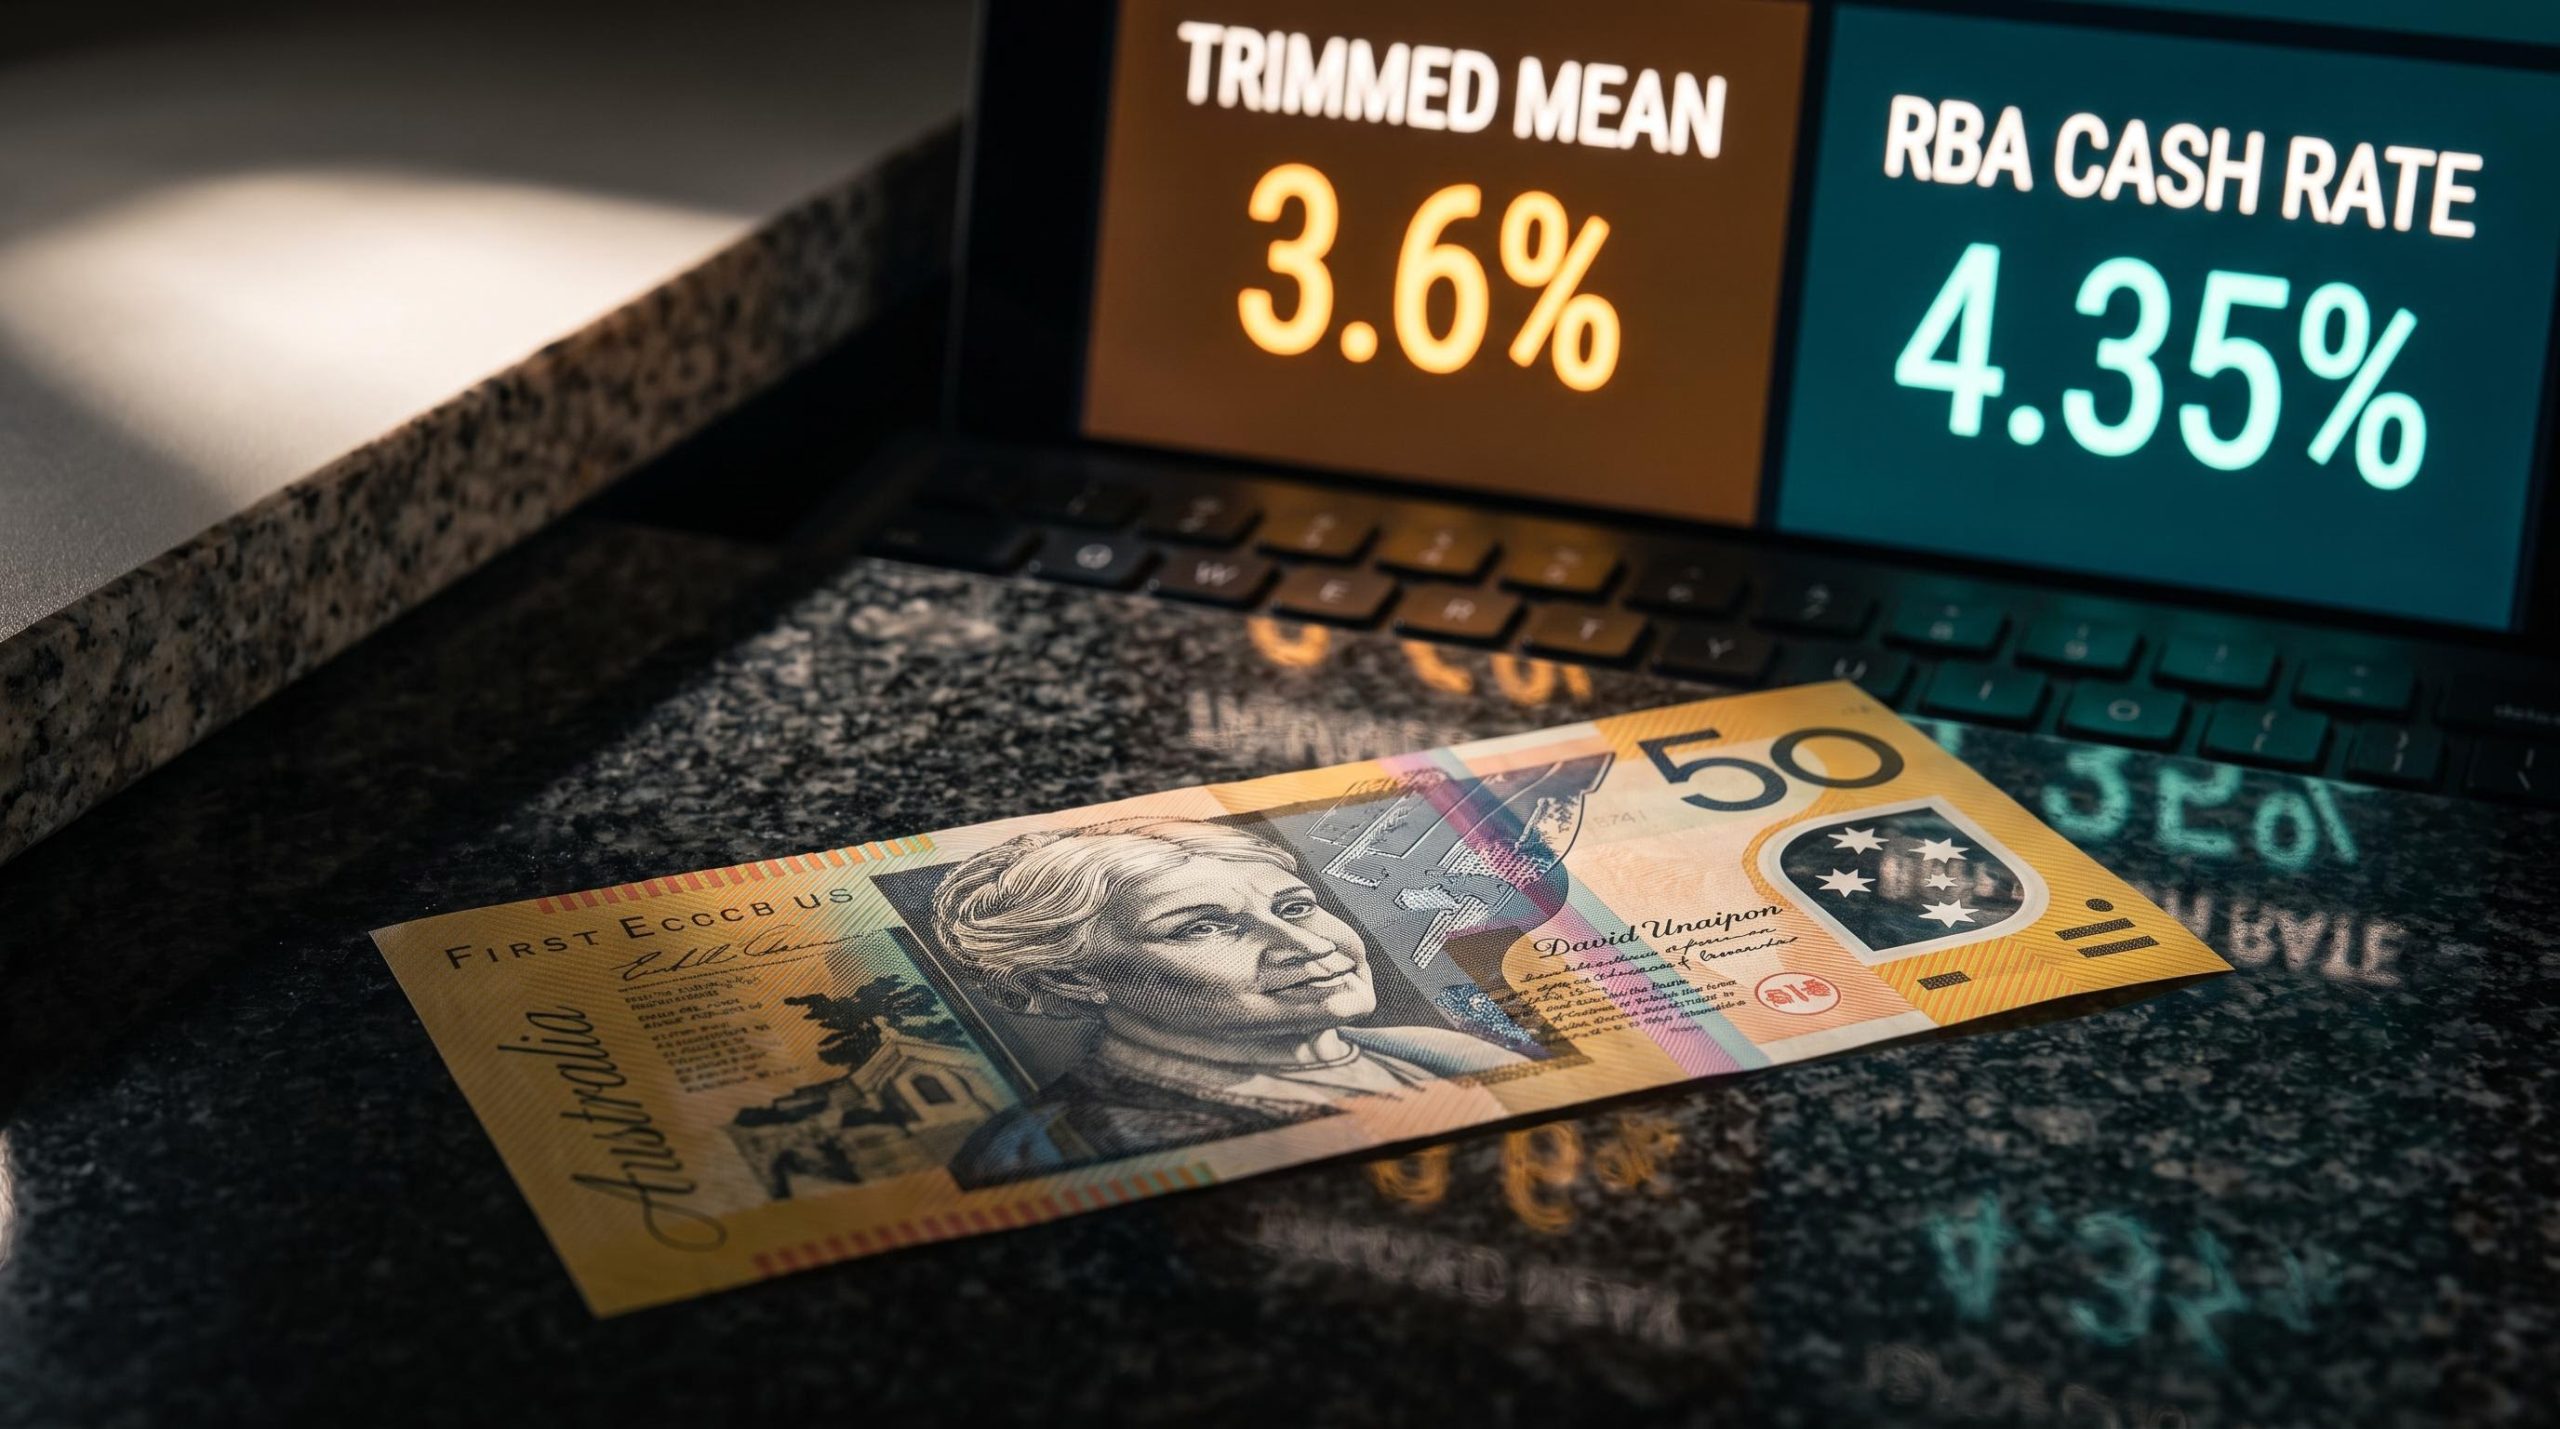
The ABS monthly CPI indicator release confirmed the annual headline rate at 3.5% alongside the trimmed mean reading of 3.6%, giving the RBA a core inflation figure that had barely shifted from the prior month despite the headline improvement.
The structurally more concerning figure sits underneath. Trimmed mean inflation, which strips out the most volatile price movements and is the measure the RBA watches most closely, came in at 3.6% year-on-year, above the 3.5% expectation.
The trimmed mean divergence from headline CPI is not a new phenomenon in this cycle; May’s print showed the same conflict, with headline falling sharply while underlying inflation accelerated to a reading that made an immediate cut structurally impossible for the RBA.
The trimmed mean barely moved. At 3.6% against expectations of 3.5%, the RBA’s preferred core measure is telling you that the underlying inflation problem is not being solved quickly. The headline easing is not the all-clear signal some investors were hoping for.
The RBA’s target band is 2-3%, and the central bank does not expect inflation to return to the midpoint of that band until early 2028. Every monthly print now carries material weight.
| Metric | Actual | Consensus | Prior month |
|---|---|---|---|
| Monthly CPI | 1.0% | 0.8% | N/A |
| Annual headline CPI (year-on-year) | 3.5% | 3.3% | 3.8% |
| Trimmed mean CPI (year-on-year) | 3.6% | 3.5% | 3.6% |
When big ASX news breaks, our subscribers know first
How rate markets have repriced the RBA outlook
Before the July data landed, the consensus was relatively settled. Markets priced an above-80% probability of the RBA holding steady at 4.35% at its next meeting, and the broader orientation was toward an easing cycle beginning sooner rather than later. The question was timing, not direction.
What the RBA’s own documents say about the path ahead
The repricing was swift. The hold probability dropped from above 80% to just over 60%. Market pricing now reflects approximately a 50% chance of a cash-rate increase by year-end, according to the RBA’s August Statement on Monetary Policy. The ASX 200 finished the session flat, surrendering its initial advance as the day progressed, a reaction that tells you equities absorbed the data without panic but also without conviction.
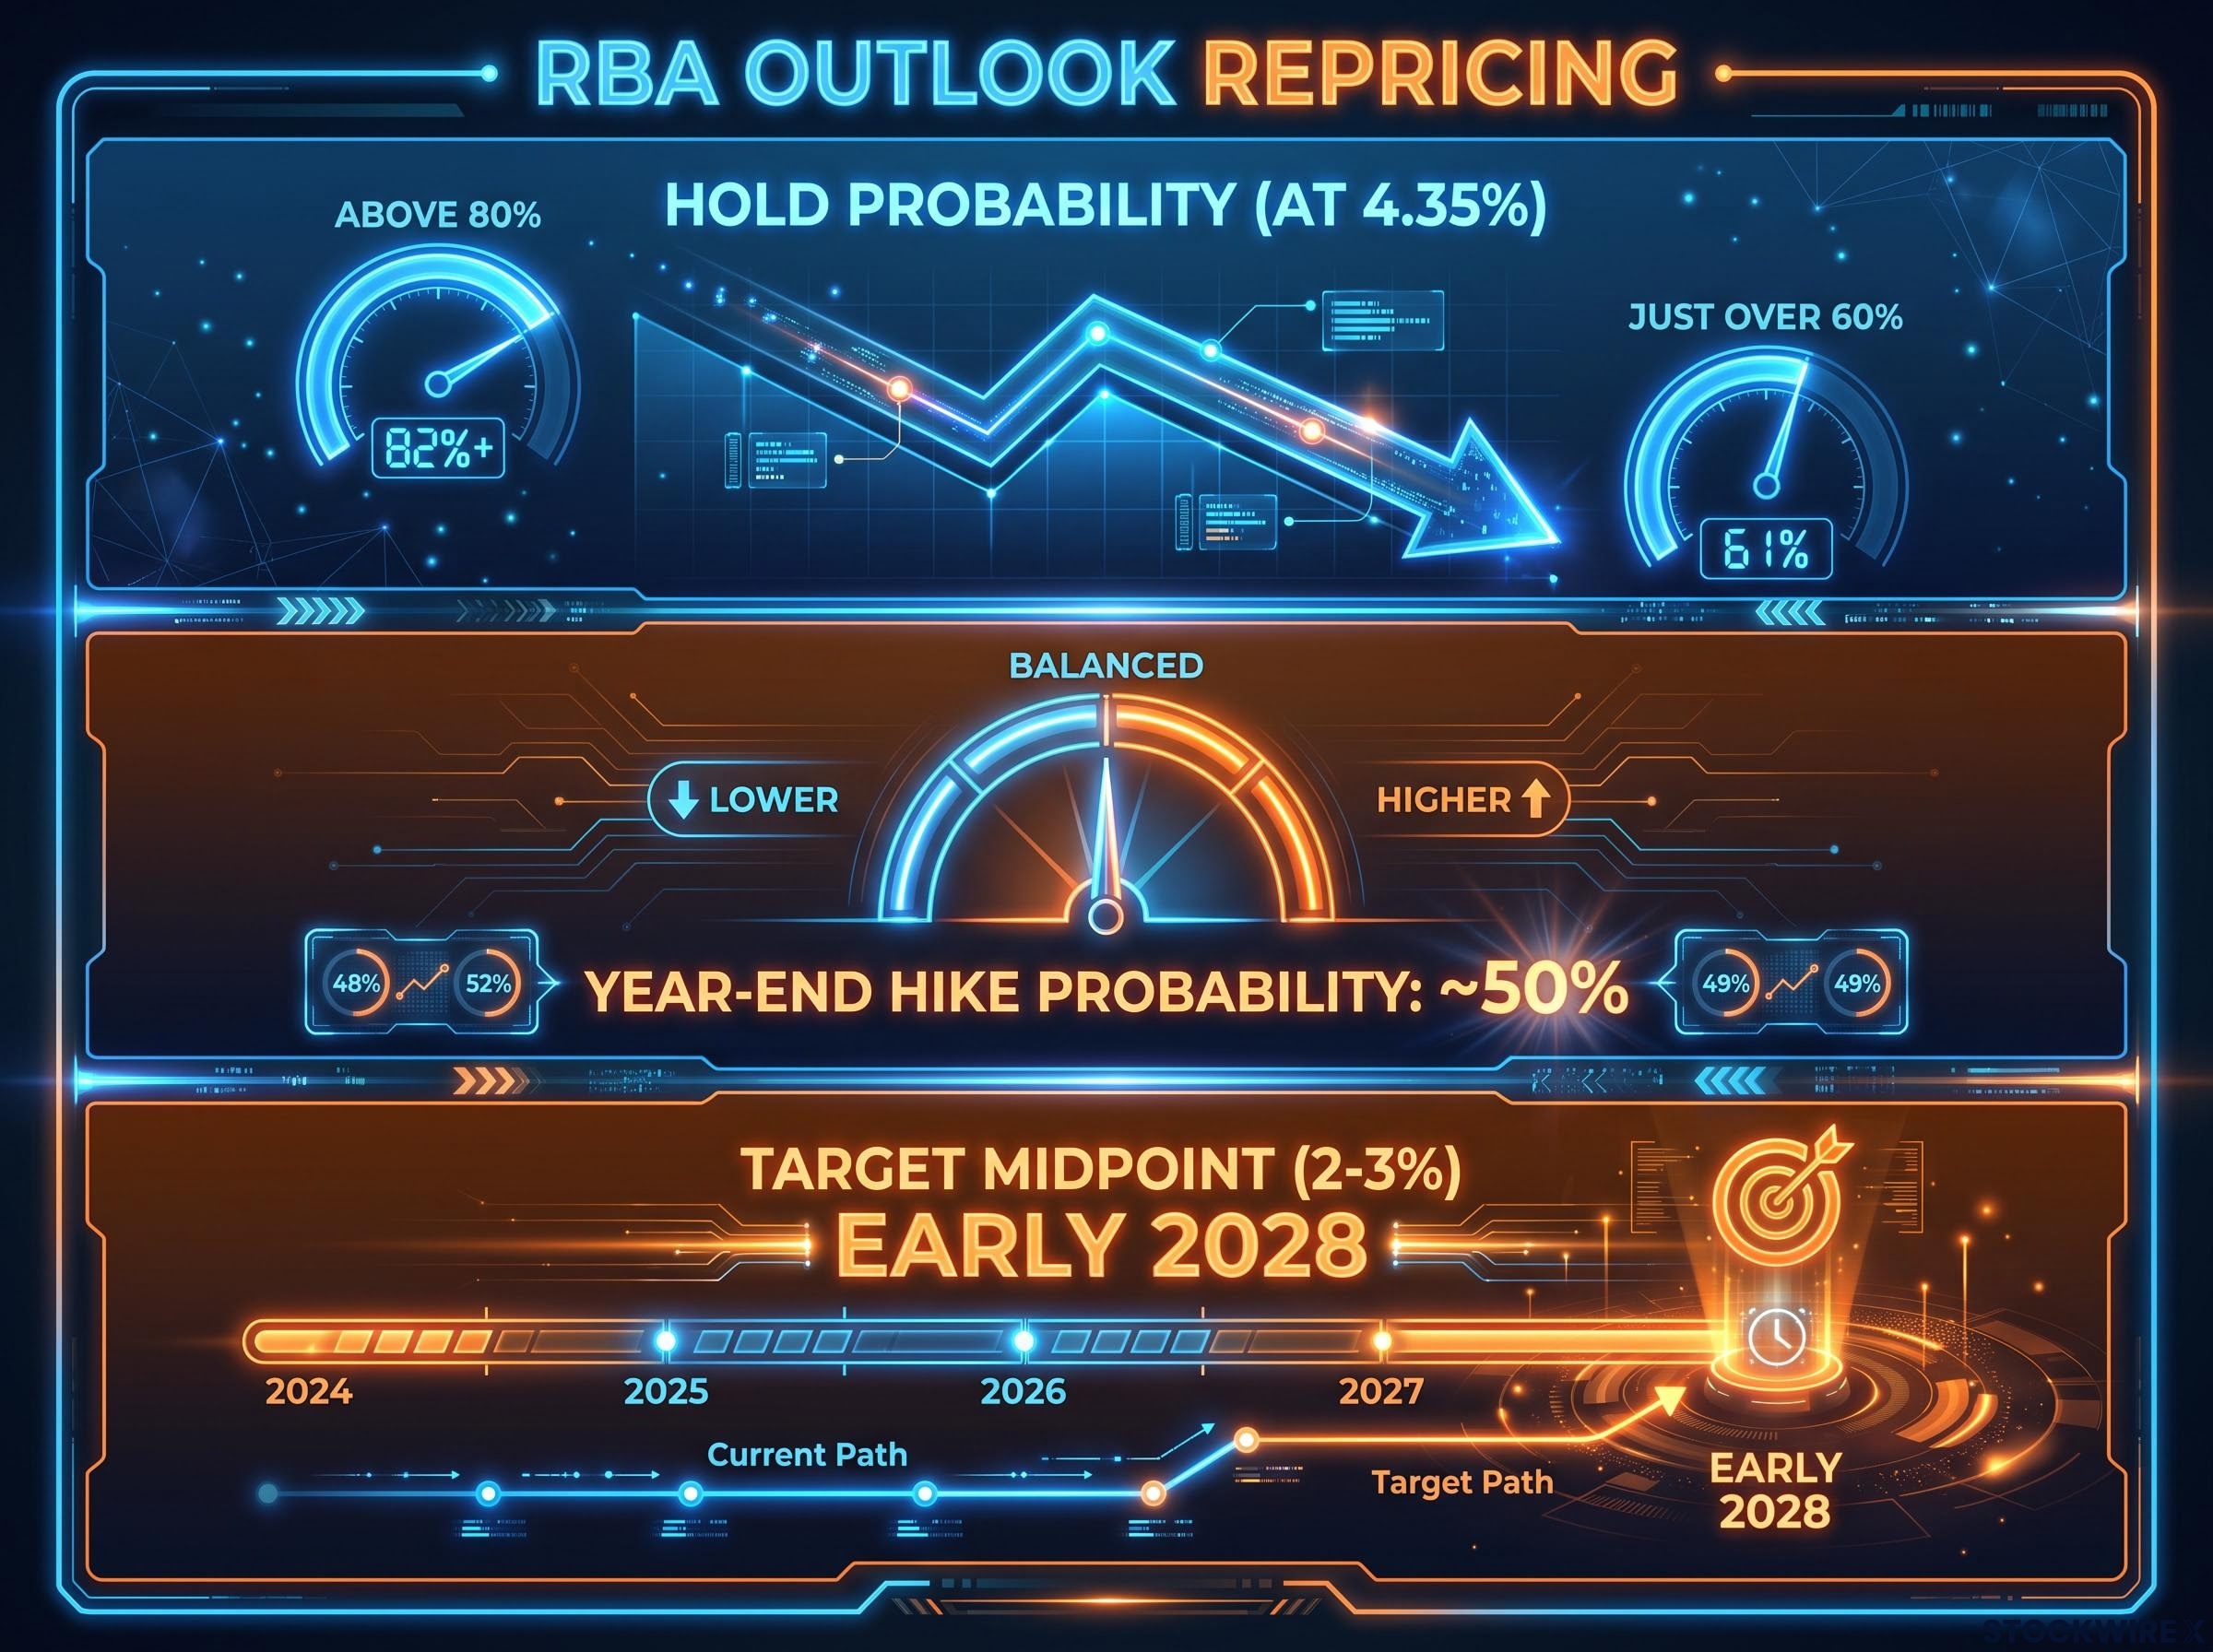
The RBA’s own baseline reinforces the caution. The August Statement on Monetary Policy assumes the policy rate remains steady or edges slightly higher over 2026 before drifting back toward the target range, with inflation not expected to reach the midpoint of the 2-3% band until early 2028. This is not just a market re-rating; it aligns with what the central bank itself is projecting. The 2028 timeline implies a sustained period of above-target inflation even in the RBA’s central scenario.
Two key implications follow from this repricing:
- The timing of the first cut is pushed further out, and the distribution of possible timing has widened considerably.
- The bar for further tightening is higher, but it is not off the table if upcoming data keep surprising to the upside.
A hold probability of just over 60% is not a reassuring margin. It means roughly one-in-three market participants are now pricing something other than a straight hold, and that distribution of uncertainty alone should change how you think about positioning over the next six to twelve months.
What this means for equities, bonds, and the Australian dollar
The same macro input, higher-for-longer rates, transmits differently across different instruments. The read you take from this depends on where your capital sits.
Equities: where the pressure lands and where it does not
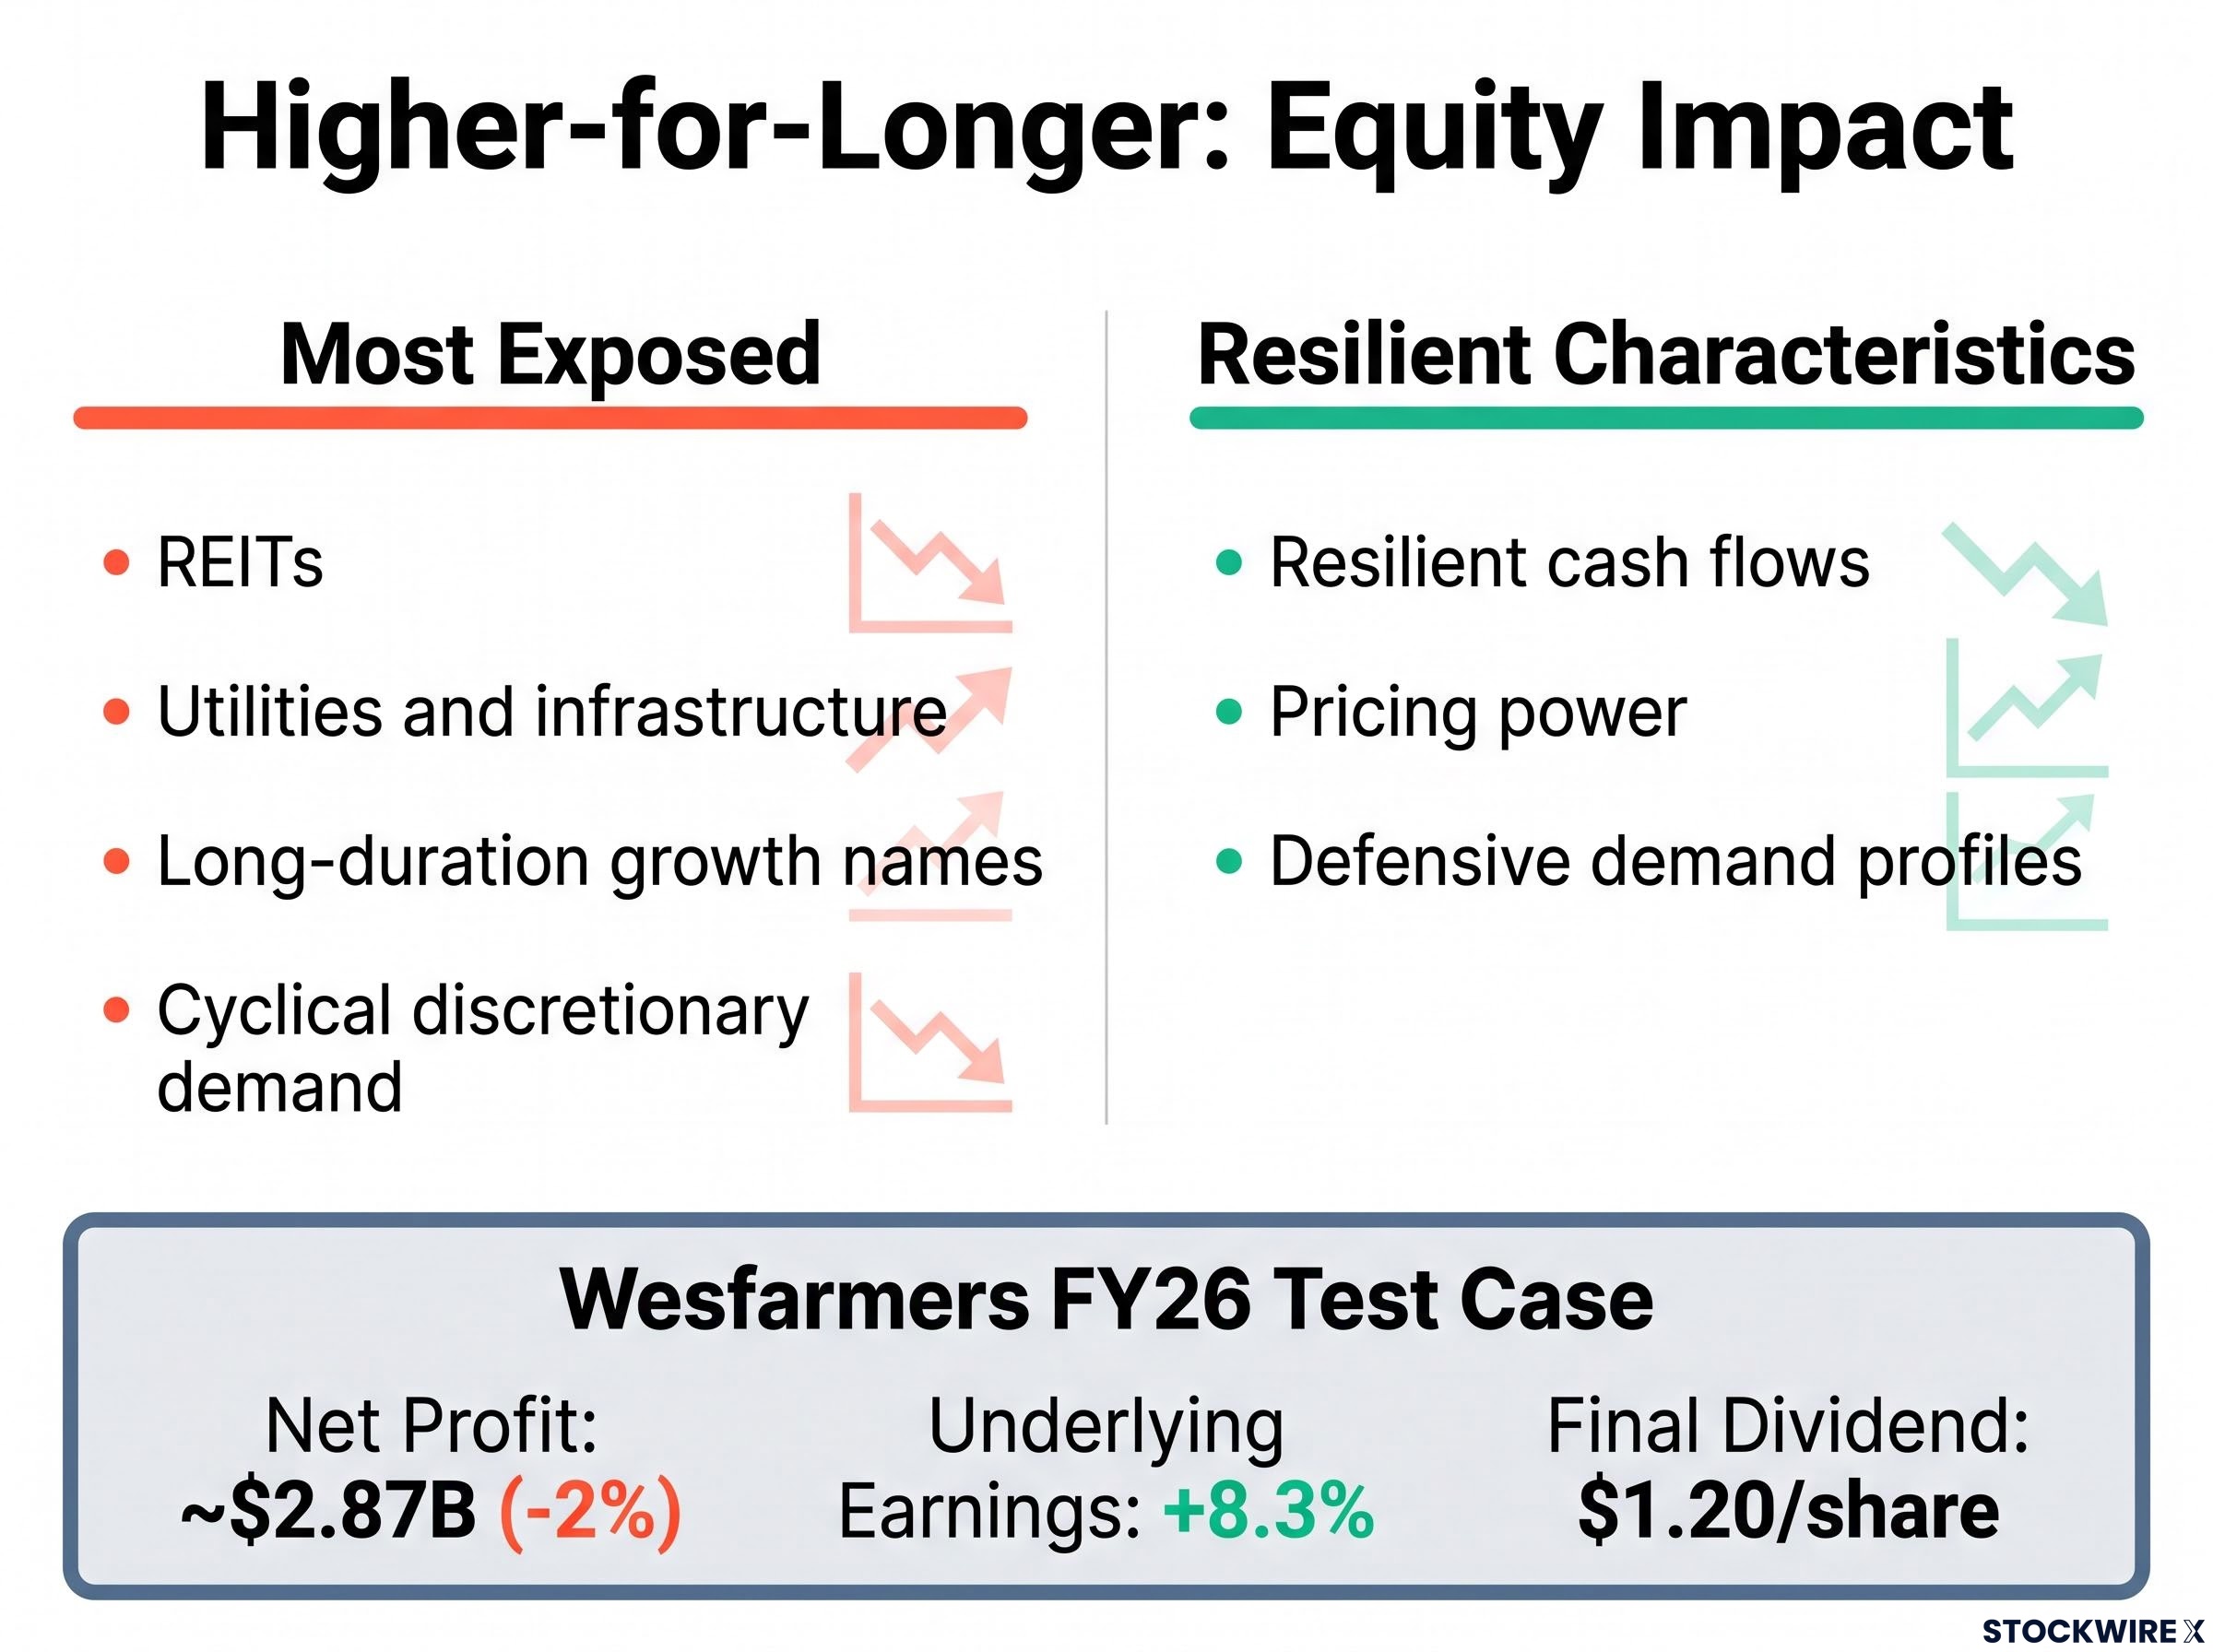
Higher policy rates mean higher discount rates applied to future cash flows, which is the mechanism through which rate expectations flow into share prices. The sectors most exposed to this pressure are:
Equity duration mechanics explain why the pressure on REITs, utilities, and long-duration growth names is not just sentiment-driven: a one-percentage-point rise in the discount rate cuts roughly 17 times more from a cash flow due in 20 years than one due in the near term, meaning the damage is largely mechanical before any earnings deterioration occurs.
- REITs, whose valuations are highly sensitive to the cost of debt
- Utilities and infrastructure, which carry long-duration cash flow profiles
- Long-duration growth names, where valuations are heavily built on earnings far in the future
- Businesses reliant on cheap funding or highly cyclical discretionary demand
Better-positioned businesses tend to share different characteristics: resilient cash flows, pricing power (the ability to pass cost increases through to customers), and defensive demand profiles.
Wesfarmers published its FY26 full-year results on 27 August, providing a useful real-world test case. Annual net profit totalled approximately $2.87 billion, representing a 2% fall compared to the prior year. Stripping out significant one-off items, however, underlying earnings grew 8.3% on the year, coming in slightly ahead of what analysts had forecast. The board declared a final dividend of $1.20 per share.
Wesfarmers’ underlying profit, up 8.3% year-on-year, is a real-world data point on what margin resilience looks like in a high-rate, high-inflation environment. Not all equities are equal in a higher-for-longer world, and the distinction between businesses that can defend their margins and those that cannot is exactly the lens to apply now.
The early trading update added context: in the first seven weeks of the new financial year, Bunnings delivered sales growth that ran a little ahead of the back half of FY26, while Kmart tracked broadly in line with that same prior period. Consumer-facing businesses are not collapsing under the weight of rates, but they are navigating carefully.
Fixed income and the AUD
For bonds, the July data creates opposing forces. Near-term yields face upward pressure as markets reduce cut expectations and price some probability of further tightening. Longer-term yields depend on whether investors believe the RBA will ultimately return inflation to target without triggering a deep downturn. Duration exposure becomes more volatile in this setting; short-to-intermediate maturities are the most sensitive to shifting RBA expectations.
For the Australian dollar, the inflation surprise provides yield-differential support. Reduced cut odds improve relative yield support for the AUD, and the currency edged up to approximately 71.72 US cents on 27 August, notching a small advance even as the US dollar held firm more broadly. But global risk sentiment and the US dollar’s trajectory remain powerful counterforces. The net move in AUD will depend on how Australian data interact with global macro conditions in the months ahead.
Which data releases will determine whether July was a turning point
The question now is whether July’s upside surprise was a one-off driven by fuel prices, or the signal that underlying inflation has plateaued above the RBA’s comfort zone. Four categories of data will answer it.
- Subsequent CPI and trimmed mean prints. Whether core inflation continues to hover in the mid-threes or resumes a clear downtrend toward the 2-3% band will heavily influence the RBA’s reaction function. Given the central bank does not expect inflation to return to the midpoint of the target band until early 2028, every print carries material repricing potential.
- Labour market and wages data. Services inflation, which covers everything from rent to haircuts, is particularly sensitive to wage growth. A still-tight labour market and strong wage growth would increase concern that services inflation will remain sticky, keeping the RBA cautious about easing.
- Household spending and retail sales. Spending data and consumer-facing earnings, including Qantas results that were pending at the time of writing, will reveal whether higher rates and prices are finally biting or whether demand resilience is keeping inflationary pressure alive. Household spending data was scheduled for release alongside the capex figures in the same reporting window.
- Private capital expenditure. Strong business investment can signal confidence and support growth, but if it remains robust alongside stubborn inflation, it reinforces the case for higher-for-longer rates.
The RBA does not expect inflation to return to the midpoint of the 2-3% target band until early 2028. That timeline means every near-term print carries outsized repricing weight. A single strong trimmed mean number shifts the probability distribution materially.
If household spending and labour data remain robust while trimmed mean inflation stays above 3.5%, the probability of another hike will move materially higher. Investors who treat the current two-sided uncertainty as a temporary inconvenience risk being caught offside.
What higher-for-longer actually means for your portfolio
The framing shift is straightforward but consequential. The question is no longer “when do cuts arrive” but “how do I position for a genuinely two-sided rate environment where cuts and hikes both remain live possibilities.” That is a different portfolio construction problem, and it requires a different set of principles.
A higher discount-rate environment favours businesses with resilient cash flows, pricing power, and defensive demand. It penalises businesses reliant on cheap funding or highly cyclical discretionary demand. Wesfarmers’ underlying result illustrates what the right side of that divide looks like in practice.
Five positioning principles for the current environment
- Treat the RBA path as two-sided. Avoid portfolios that only benefit from imminent cuts. If your holdings only work in an easing cycle, you are carrying concentrated directional risk.
- Stress-test equity holdings for higher discount rates. Rate-sensitive sectors (REITs, utilities, infrastructure) and long-duration growth names are most exposed. Run the scenario where the cash rate stays at 4.35% or goes higher, and assess what that does to your positions.
- Favour businesses with resilient cash flows and pricing power. Companies that can defend margins in a high-rate, high-inflation environment are structurally better positioned than those that cannot. Look for defensive demand profiles and demonstrable pricing power.
- Be deliberate about duration in fixed income. Front-end yields are most sensitive to shifting RBA expectations. Greater volatility around curve positioning means passive duration exposure carries more risk than it did when cuts seemed certain.
- Recognise that AUD inflation surprises skew toward yield-differential support, but with high global risk sensitivity. If you hold offshore exposures, the interplay between domestic rate expectations and global risk sentiment is now a more active variable than it was a month ago.
A two-sided rate environment is not just a different macro backdrop; it requires different portfolio construction logic. If you have not stress-tested your holdings against a further hike scenario, you are carrying risk you may not have quantified.
Investors wanting to move from principle to practice on two-sided rate positioning will find our comprehensive walkthrough of all-weather portfolio construction covers asset class allocation across equities, fixed income, inflation-linked assets, alternatives, and cash in a structurally elevated volatility environment.
This article is for informational purposes only and should not be considered financial advice. Investors should conduct their own research and consult with financial professionals before making investment decisions. Past performance does not guarantee future results. Financial projections are subject to market conditions and various risk factors.
Where the rate debate goes from here
July’s inflation data did not resolve the rate debate. It widened the distribution of outcomes around it, and that wider distribution is itself the most important thing to internalise. The RBA’s own 2028 timeline for returning to the midpoint of the target band confirms this is a sustained story, not a question that gets settled at a single meeting.
The practical anchors are clear: subsequent CPI and trimmed mean prints, wages data, household spending, and private capital expenditure. These are the releases that will determine whether July was a one-off fuel-price shock or the beginning of a more persistent problem. Monitor them specifically rather than responding to every daily market move.
The Australian economic outlook carries an additional variable that the monthly CPI print alone cannot capture: the AI-driven capex boom across US and Asian trading partners has provided an external demand buffer that is, for now, absorbing some of the growth damage from persistent domestic inflation.
Investors who understand the two-sided nature of the current environment, and who have stress-tested their portfolios accordingly, are better placed to act on incoming data rather than react to it.
—